Enhanced Structural and Chemical Stability of New Inorganic Halide Perovskite Solar Cell Structures via Nickel Doping and Silicon Dioxide Encapsulation
Abstract
Conventional perovskite solar cells (PSCs) have adapted the organic–inorganic hybrid perovskites as the absorption layer due to low processing temperature, superior optoelectronic properties, and simple solution processing. However, hybrid perovskites are more vulnerable to heat compared to inorganic perovskites. For long-term operation, heat stability is essential for the commercialization of PSCs based on hybrid perovskite. In this study, we synthesized inorganic halide perovskite CsPbBr3 with SiO2 shell to ensure stability against heat. However, due to the lattice mismatch between the SiO2 shell and CsPbBr3, we introduced nickel doping using nickel acetate to reduce this mismatch. The nickel-doped CsPbBr3–SiO2 core–shell perovskite exhibited superior thermal stability, maintaining the 92% of its initial performance after 12 h at 353 K.
1. Introduction
Halide perovskites have an ABX3 structure as well as wide-ranging photoelectric properties that are attributed to the various combinations of ions in the A+, B2+, and X− sites [1, 2]. Based on diverse properties such as high absorption coefficient, long carrier diffusion length, and high carrier mobility, perovskites have been used in various applications, such as in solar cells [3–8], light-emitting diodes (LEDs) [9–15], detectors [16, 17], and sensors [18, 19]. Perovskite solar cells (PSCs) have seen rapid advancements over the past 15 years, with power conversion efficiency (PCE) increasing from 3.8% to 26.08% [20, 21]. However, the conventional lead halide perovskites (LHPs) used in PSCs are typically organic–inorganic hybrid perovskites, which suffer from stability issues due to the organic cations’ vulnerability to external factors such as heat and moisture.
In contrast to organic–inorganic hybrid perovskites, inorganic LHPs are commonly applied in LEDs because of their defect tolerance, high photoluminescence quantum yield (PLQY), and superior stability [22–30]. Inorganic LHPs, such as CsPbI3 [31–33], CsPbI3-xBrx [34–36], and CsPbBr3 [37–42], have also been applied as the absorption layer in solar cells, leading to an improvement in PCE from 2.9% [43] to 21.5% [37] over 10 years. Inorganic LHPs are promising candidates for replacing the traditional organic–inorganic hybrid perovskites, with methods such as quantum dot (QD) solutions, spin-coating, and thermal evaporation being explored [38]. One strategy to further enhance efficiency is the use of tandem structures with other absorption layers [39]. Among inorganic LHPs, CsPbBr3 is a strong candidate for stable performance under heat, with improvements achieved through doping and structural adjustments. CsPbBr3 also demonstrates a stable crystal structure due to its higher Goldschmidt tolerance factor compared to other inorganic LHPs. Using a raw material source that combines transition metals and ligands, extensive studies have reported that the stability of halide perovskites is improved by simultaneously applying metal ion doping and core/shell structure formation [44–48]. Appropriate metal ions, such as Mg2+ and Ni2+, were incorporated into perovskite to modulate its optical properties and stability [49, 50]. Additionally, thiocyanate was introduced to adjust the growth rate of the perovskite [51]. The synthesis of perovskite with a core–shell structure is progressing, involving the encapsulation of perovskite with polymers, other perovskites, and metal oxides. The core–shell structure typically enhances stability against external factors, and synthesized core–shell perovskites have been applied in various fields, including 3D printing [52]. Therefore, this study also aims to provide a theoretical foundation for the improvement of LHPs induced by the synergistic effect of transition metal doping and core/shell structure formation [53]. A previous study synthesized a core/shell perovskite with an SiO2 shell, which exhibited weakened optical properties compared to pristine perovskite owing to lattice mismatches.
In this work, we synthesized the CsPbBr3 perovskites with nickel doping and SiO2 shell for enhancing the stability with alleviating the lattice mismatch. The sources of doping and shell were nickel acetate and 3-aminopropyltriethoxysilane (APTES). Comparing to other nickel source, the nickel acetate can be dissolved in low temperature that be able to synthesize in lower temperature than conventional hot injection methods. The reduction in synthesis temperature indicated a decline in the overall cost of the synthesis process. APTES was integrated with perovskite at the A-site, filling the point vacancy of the Cs ion. As a result, nickel-doped CsPbBr3 with a SiO2 shell (Ni–SiO2) perovskite maintained 92% of their initial performance after 120 h at 353 K. The superior heat stability demonstrated that Ni–SiO2 perovskite is suitable for application as an absorption layer in PSCs.
2. Experimental
2.1. Materials
All chemicals were utilized without further purification. Cesium carbonate (Cs2CO3, 99.9%, Sigma–Aldrich), oleic acid (OA, 90%, Sigma–Aldrich), 1-octadecene (ODE, 90%, Sigma–Aldrich), PbBr2, nickel acetate, APTES (99%, Sigma–Aldrich), and oleylamine (OLA, 70%, Sigma–Aldrich) were purchased for synthesis.
2.2. Synthesis of Pristine CsPbBr3 and Ni-Doped QDs
The procedure used for synthesizing CsPbBr3 and Ni-doped CsPbBr3 QDs was similar to the conventional hot injection method with minor modifications. The Cs–oleate was synthesized by stirring 5 mL of ODE, 0.25 mmol of Cs2CO3, and 0.5 mL of OA in 250 mL three-neck flask under N2 at 110 for 1 h. For utilizing the Cs–oleate precursor again, we preheated the precursor at 100°C. For CsPbBr3 synthesis, 5 mL of ODE, 0.188 mmol of PbBr2, and 0.47 mmol of nickel acetate were added to a 250 mL three-neck round-bottom flask and dried under vacuum at 110°C for 1 h. The flask was filled with N2, and 2 mL of OA and 2 mL of OLA were injected into the flask, which was preheated to 70°C. Subsequently, the flask was heated at 130°C until PbBr2 and nickel acetate completely reacted with OA and OLA, following which the temperature was increased to 160°C. The Cs–oleate precursor (0.4 mL) was rapidly injected into the Pb–oleate solution, and the solution was maintained at 160°C for 5 s to allow for the growth of the QDs. Subsequently, the solution was cooled by immersing the flask in a cold-water bath.
2.3. Synthesis of CsPbBr3 and Ni-Doped CsPbBr3 QDs With SiO2 Shell
The procedures used for synthesizing CsPbBr3 and nickel-doped CsPbBr3 QDs with SiO2 shell were similar to the conventional hot injection method with minor modifications [54]. Briefly, 5 mL of ODE, 0.188 mmol of PbBr2, and 0.47 mmol of nickel acetate were added to a 250-mL three-neck round-bottom flask and dried under vacuum at 110°C for 1 h. The flask was filled with N2, and OA (2 mL) and APTES (2 mL) were injected into the flask, which was preheated to 70°C. Subsequently, the flask was maintained at 110°C until PbBr2 and nickel acetate completely reacted with OA and APTES; subsequently, the temperature was increased to 130°C. The Cs–oleate precursor (0.4 mL) was rapidly injected into the Pb–oleate solution, and the solution was maintained at 130°C for 5–10 s to allow for the growth of the QDs. The solution was cooled by immersing the flask in a cold-water bath.
2.4. Purification and Dispersion
The as-synthesized samples were purified by centrifugation at 13,500 RPM for 5 min. After centrifugation, the bright green supernatants were discarded, and the precipitates were collected, dispersed in 2 mL of hexane, and centrifuged at 3000 RPM for 5 min. During the purification process, perovskite solution was exposed to air for supplementing the H2O. The resulting supernatants were collected and stored in a vial, which was encased with aluminum foil to prevent light exposure.
2.5. Characterization
Field-emission scanning electron microscopy (FE-SEM) (Carl Zeiss SIGMA 300 and Hitachi SU-8100) and field-emission transmission electron microscopy (FE-TEM; JEOL JEM-F200) were used to characterize the morphology and lattice structures of the synthesized colloidal QD samples. An X-ray diffractometer (Bruker-AXS, XRD New D8-Advance) was used to record the XRD patterns. NMR (NMR 600 Hz, Varian, VNS) was used to analyze the behavior of the ligands. A spectrofluorometer (Jasco, FP-8550) was used to analyze the PL intensity, absorbance, and PLQY of the synthesized colloidal QD samples. The XPS survey (K-alpha+, Thermo Fisher Scientific) was measured for analyzing the chemical effect of the nickel and SiO2.
3. Result and Discussion
3.1. Analysis for Perovskites
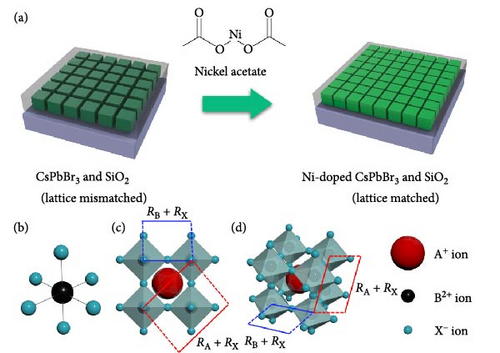
As shown in Figure 1a, changing the passivation material to alleviate the lattice mismatch can maintain or improve the existing optical properties. The Goldschmidt tolerance factor (T) and octahedral factor (μ) are the main parameters that indicate the nature of the existing perovskite phases and structures. The structures of halide perovskites are shown in Figure 1b–d, and the expressions for calculating these factors are given in Equations (1) and (2). These factors are determined by the radii of the A+, B2+, and X− ions and are denoted as RA, RB, and RX, respectively. In particular, the tolerance factor is expressed as the ratio of A+ to Pb2+ ions, and the octahedral factor is determined by the [BX6]4− octahedra, which indicate the radii of the Pb2+ and X− ions. Typically, LHPs are nonradiative phases in terms of these two factors.
Halide vacancy is a common defect in LHPs. Moreover, LHPs are known to be defect tolerant owing to Pb2+ ions. For example, in the case of CsPbBr3, Cs ions do not affect the band states of the LHP. The top of the valence bands in CsPbBr3 forms via s–p antibonding between the empty Pb p orbital and the Br p orbital, resulting in a shallow defect energy level. Moreover, the empty Pb p orbital causes a conduction band minimum, which further contributes to the shallow defect energy level. Although Pb ions endow structural defect tolerance characteristics, a small amount of nickel ion doping enhances Pb–Br binding, which inhibits halide vacancy formation.
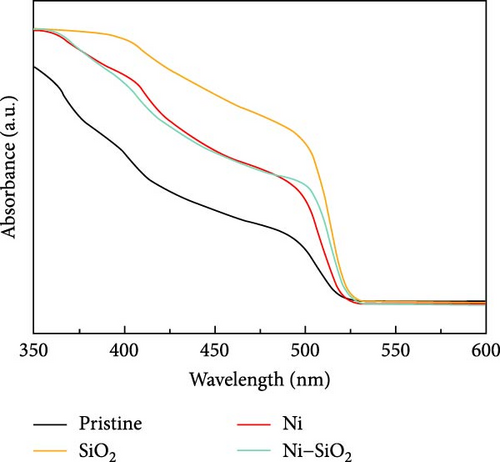
APTES binds to the perovskite at the A-site vacancy through its amine functional group, and the formation of the SiO2 shell inhibits the generation of surface and point defects. The processes of doping and SiO2 shell formation are summarized in Figure S1. The optical properties of the CsPbBr3 depending on the presence of Ni2+ and SiO2 shell were shown in Figure 2. In Figure 2a, the UV-vis absorbance spectra of pristine, nickel-doped CsPbBr3 (Ni), SiO2-encapped CsPbBr3 (SiO2), and Ni–SiO2 perovskite are shown. The peak edge of each sample located at 511, 514, 527.5, and 521.5 nm coincided with PL peak position in Figure 2b. Also, the full width half maximum (FWHM) of the samples were 20.7, 19.5, 20.00, and 21.2 nm as shown in Figure 2b. The red shift of the PL peak position was attributed to difference in size as shown in Figure S2. In Figure S2a,b, the TEM images of the pristine and SiO2 perovskite and the size distributions of each sample was shown in the inset image of Figure S1a,b. The average size of SiO2 perovskites was larger than the pristine CsPbBr3 that contribute to the red shift in PL peak position. The perovskites Ni and Ni–SiO2 showed the difference in PL peak position that shifted smaller than nondoped perovskites. It was attributed to the reduction in lattice mismatch. The introduction of SiO2 also decreases to the PLQY because of the lattice distortion between the perovskite and SiO2 shell.
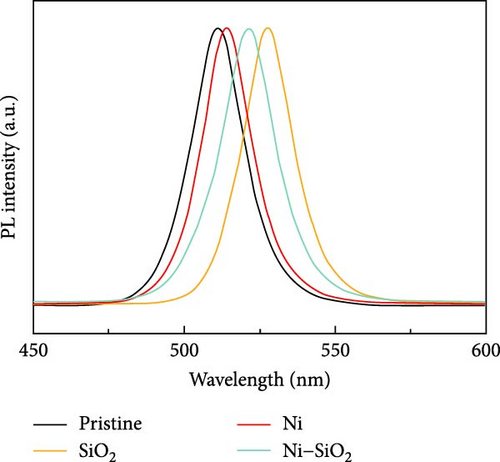
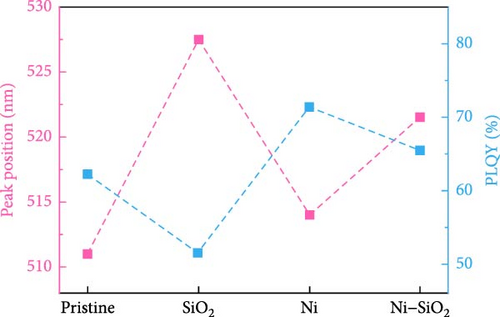
The nickel doping alleviated the lattice distortion, and the gap of PL intensity between the Ni and Ni–SiO2 perovskites was smaller than pristine and SiO2 perovskites. The peak position, FWHM, and PLQY of perovskites were summarized in Table 1.
| Sample | Pristine | Ni | SiO2 | Ni–SiO2 |
|---|---|---|---|---|
| PL peak (nm) | 511 | 514 | 527.5 | 521.5 |
| FWHM (nm) | 20.7 | 19.5 | 20.0 | 21.2 |
| PLQY (%) | 62 | 71 | 51 | 65 |
- Abbreviations: FWHM, full width half maximum; PLQY, photoluminescence quantum yield.
For identifying the phase stability of synthesized perovskites, TEM images of perovskites after 5 days were measured as shown in Figure 3a,–d, and as-prepared perovskites were shown in Figure S1a–d. In Figure 3a, the boundaries of the square CsPbBr3 crystals faded after 5 days, and hexagonal structures with a spherical shape were formed. These hexagonal structures have a very similar shape to that of previously reported Cs4PbBr6 crystals [61, 62]. The pristine perovskite showed the phase transition from CsPbBr3 to Cs4PbBr6, and the SiO2 perovskite partially transformed to Cs4PbBr6 because of the defect. The Ni perovskite showed the black dots and large grain that the morphology was shown as nanorods. In Figure 3b,c, the black dots were Pb0 originated from the lack of surface passivating ligands [59]. The low-temperature synthesis of perovskite influenced the morphology of nanorods, which can be attributed to the excess nickel content. The variation of morphologies attributed to the excess of nickel was shown in Figure S3a−c. Ni–SiO2 perovskites preserved the CsPbBr3 phase because the surface was successfully passivated both A-site and B-site by APTES and nickel doping as shown in Figure 3d. For atomic-scale analysis, we magnified the TEM images, as shown in Figure S4a–d. The nickel ion has a smaller ionic radius than the lead ion, and the formation of the SiO2 shell affected the size of the perovskite QD. As a result, compared to pristine perovskite, the other perovskites exhibited a reduction in planar distance. In Figure S4c,d, the SiO2 shell is shown covering the perovskite QD, with the Ni–SiO2 perovskite demonstrating greater coverage than the SiO2 perovskite, which is attributed to the alleviation of lattice mismatch.
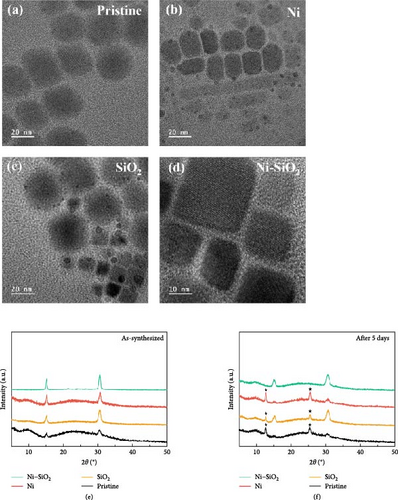
The XRD pattern of the as-prepared perovskites and perovskites after 5 days were shown in Figure 3e,f. In Figure 3e, all XRD patterns showed the same positions for two peaks. The peaks located near 15.2° and 30.6° signified the (100) and (200) planes of cubic CsPbBr3 that coincided with JCPDS no. 54-0752. In Figure 3f, each XRD patterns showed that maintained existing peaks. However, the pristine, SiO2, and Ni perovskites showed the additional peaks near 12.6° and 25.4° that signified the (012) and (240) planes of Cs4PbBr6, and those peaks were coincided with JCPDS no. 73-2478 that denoted Cs4PbBr6. The existence of additional peaks attributed to transition from CsPbBr3 to Cs4PbBr6 was consistent with the TEM images in Figure 3a–d. Despite the other XRD patterns showed additional peak, Ni–SiO2 perovskite retain the original pattern, and it signified that the chemical stability was improved.
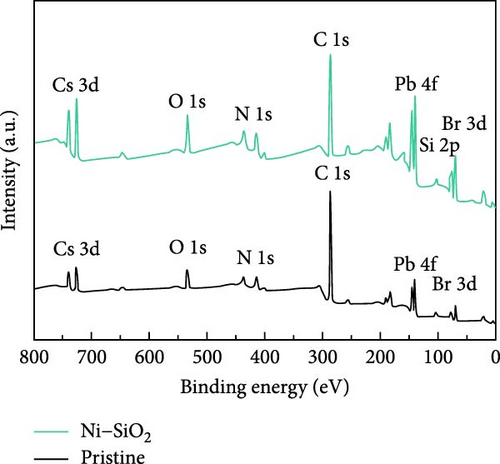
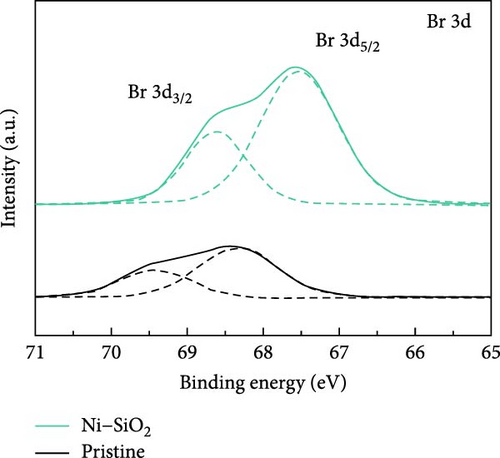
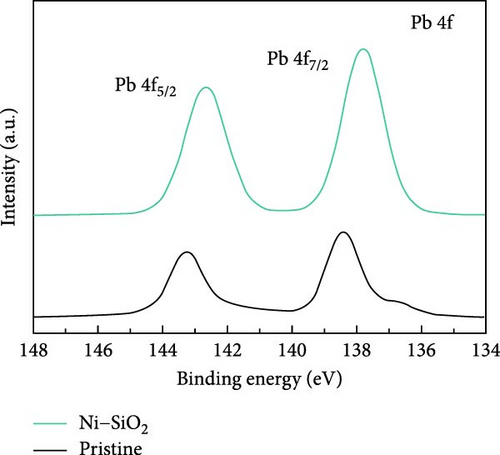
For identifying the chemical environment of perovskites, we measured the XPS spectra of pristine, SiO2, Ni, and Ni–SiO2 perovskites as shown in Figure 4a–c and Figure S5a and S4b. In Figure 4a, the XPS survey spectra of pristine and Ni–SiO2 perovskite was displayed. The Si 2p and O 1s peaks were shown in Ni–SiO2 spectra that signified the presence of SiO2 on the surface of perovskites. For identifying the introduction of the nickel, we measured the XPS Ni 2f spectra of Ni–SiO2 perovskite as shown in Figure S4. However, the amount of the nickel was too small to measure by XPS spectra that showed the peak near 856 eV with weak intensity. For clarifying the presence of nickel, we measured the TEM-energy-dispersive spectroscopy (TEM-EDS) of pristine and Ni–SiO2 perovskites as shown in Figure S6. In Figure S7a, the TEM-EDS mapping of pristine perovskites showed that Cs, Pb, and Br was detected and the ratios of Pb/Cs and Br/Cs were nearly 1, and 3. Those ratios were proved the CsPbBr3 phase was dominated. In Ni–SiO2 perovskites, as shown in Figure S7b, the TEM-EDS detected the Cs, Pb, Br, Si, O, and Ni that the presence of Ni was proved and SiO2 shell was detected. We introduced the nickel acetate in the precursor that was the same ratio with lead bromide, but the doped nickels were not coincided with the number of leads. Figure 4b,c showed the XPS Br 3d and Pb 4f spectra of Ni–SiO2. Both spectra showed the peak shift to low binding energy and that the strong interaction between CsPbBr3 and SiO2 affected the chemical environment [63]. In Figure 4c, the edge of the Pb 4f5/2 and Pb 4f7/2 peaks in XPS Pb 4f spectra of pristine perovskite showed additional peaks in low binding energy. The presence of those peaks was attributed to the Pb0 defects [64]. In XPS Pb 4f spectra of Ni–SiO2, those edge peak disappeared and that the surface of the perovskite was successfully passivated by nickel and SiO2 shell.

NMR is an effective analytical method for confirming the presence of ligands in samples. 1D NMR was performed using CDCl3 as a reference solvent, which exhibited a peak at ~7.3 ppm that did not overlap with those of the ligands, such as OA, oleylamine, and APTES, to be verified. A total of four ligands were detected. The NMR spectra of OA and oleylamine were shown in Figure S8a,b; the peaks observed at 2 ppm or less were attributed to the hydrogen attached to alkyl chains. In addition, the peaks observed at 2.4 and 2.7 ppm were attributed to the hydrogen attached to alkene carbons. APTES formed an SiO2 shell via hydrolysis, and the NMR peak varied as the chemical bonds of the silane group changed. As shown in Figure S8c and S7d, the APTES peak changed before and after hydrolysis from 3.8 to 3.5 ppm, because the three ethoxide groups of APTES were transformed into hydroxyl groups. Figure 4d shows the NMR data for the Ni perovskite prepared using APTES. The peaks indicated by the red circles in the chemical shift range of 2 ppm or less correspond with those of the alkyl chain of OA. Therefore, it is concluded that OA remained in the sample after synthesis. The peaks indicated by the green circle at ~3.8 ppm confirm that APTES was hydrolyzed. Compared with the peak position shown in Figure S6c, the shift in the peak to higher ppm values is ascribed to the decrease in electron density that occurs when APTES combines with the perovskite. The weak intensity of some peaks is attributed to the presence of ethanol during hydrolysis. Consequently, when APTES is injected during perovskite synthesis, NMR analysis can be used to confirm the synthesis of the halide perovskite with the desired core/shell structure by combining hydrated APTES with Ni perovskite.
3.2. Stability Challenges
Conventional QD-sensitized solar cells were fabricated using inorganic QDs such as CdS, ZnS, and ZnO as the active layer, with many QDs encapsulated or treated with various metal oxides [63, 65]. Notably, ZnO nanorods were commonly synthesized with CdS/CdSe QDs or CdS/CdSe/ZnS QDs. Another treatment method involved a two-step process: first, CdS/CdSe QDs were applied, followed by the insertion of ZnS/Al2S3 QDs into the ZnO nanorods to reduce back electron recombination.
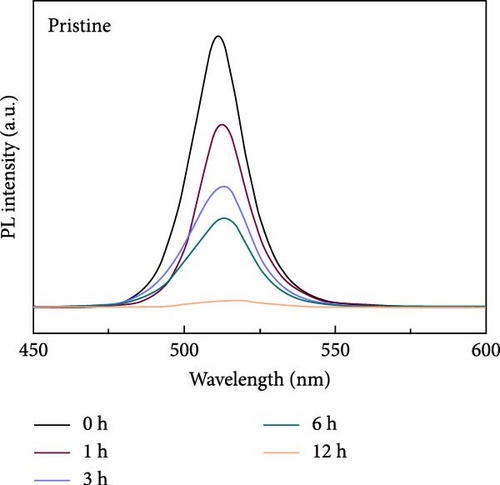
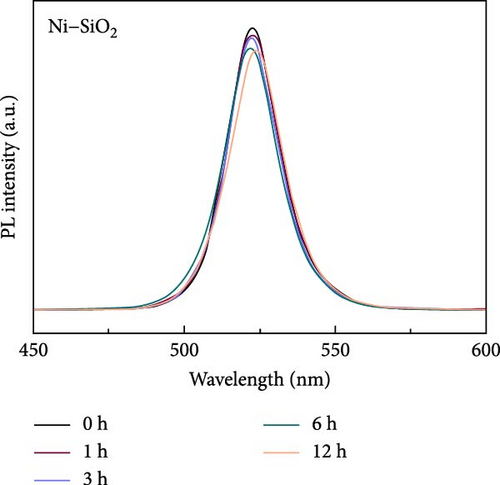
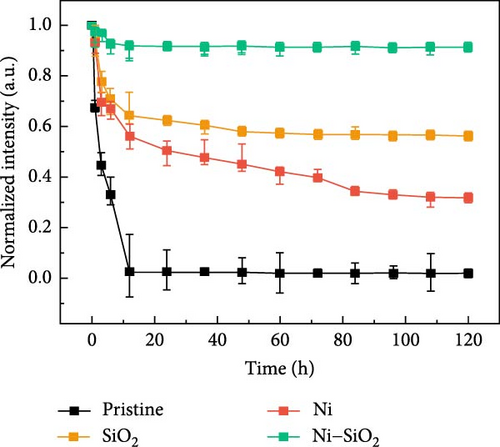
Perovskite QDs exhibited a lower density of surface defects compared to inorganic QDs; however, they were also vulnerable to external stimuli such as water, heat, and oxygen. For applying electric devices, the thermal stability of perovskites especially has to improve the optical stability of perovskites which was improved by the passivation in previous works [66, 67]. For comparing the thermal stability of pristine and Ni–SiO2 perovskites, we conducted the measurement of PL intensity against 353 K in time-dependent as shown in Figure 5 and Figure S9. In Figure 5a, time-dependent PL spectra of pristine perovskites under 353K were measured. The PL intensity of the pristine perovskite declined to 2.6% of initial intensity during 12 h under 353 K. Also, the PL peak position was shifted from 511 to 514 nm and that the size of the perovskites was increased because of the annealing. In Figure S9, time-dependent PL spectra were displayed according to the treatment of APTES and nickel. In Figure S9a, the SiO2 perovskite showed decreased in the PL intensity to 64.6% of initial intensity, and the peak position was red shifted for 5.5 nm. In Figure S9b, the Ni perovskites retained the 56.1% of initial intensity, and the peak position was red shifted from 514 to 518 nm. On the other hand, the Ni–SiO2 perovskites showed the superior stability that the PL intensity preserved 92.0% of the initial intensity after 12 h under 353 K. The preservation of the PL intensity proved that the encapsulation of perovskites was successfully conducted. The improved stability signified that the nickel doping and SiO2 shell simultaneously affect the thermal stability. As a result, the Ni–SiO2 perovskite maintained more PL intensity than other perovskites.
3.3. Feasibility and Implementation Challenges
To fabricate PSCs based on the synthesized Ni–SiO2, two processing steps were necessary. First, the perovskite film deposition needed to be optimized. The Ni–SiO2 perovskites were in solution form, with QDs dispersed in the solvent. Conventionally, perovskite films are fabricated using spin-coating methods, with parameters such as time, RPM, and annealing temperature optimized. Second, the structure of the Ni–SiO2-based PSCs required optimization. Many PSCs use a TiO2 layer as the electron transport layer, while various materials, such as NiOx and CuSCN, are selected as the hole transport layer. An interlayer is also applied to PSCs to alleviate interface defects between the perovskite and the charge transport layer. A comparison of this work with conventional research is provided in Table 2. The active layers were either single structures or tandem structures with other absorption materials.
| Perovskite | Treated material | Method | PCE | Stability | References |
|---|---|---|---|---|---|
| MAPbI3 | — | — | — | 25°C, N2, 50 h | [68] |
| CsPbI2Br | — | — | 9.3% | 25°C, N2, 1500 h | [68] |
| CsPbI3-xBrx | MMI | Interlayer | 20.6% | 65°C, N2, 265 h | [69] |
| CsPbI3 | DMF/DMSO | Solvent engineering | 15.7% | 25°C, N2, 500 h | [70] |
| CsPbBr3 | SiO2 | Core–shell | — | 85°C, air, 120 h | This work |
- Abbreviation: PCE, power conversion efficiency.
The fabrication process order also influenced the PSC structure, such as normal or inverted structures. As a result, the optimized PSCs demonstrated superior heat stability, which is advantageous for modules. The summarized process for application is shown in Figure 6.

4. Conclusion
This study aimed to increase the stability of perovskites, which is the main issue limiting their application. Perovskite materials with improved optical characteristics and high stability were synthesized by combining the advantages of doping and core/shell structures. The source of nickel ions was nickel acetate, which reduced the synthesis temperature from 170−195°C to 130°C. This decrease in temperature indicated a more cost-efficient process. The formation of the SiO2 shell and nickel doping was confirmed by TEM images and NMR. Stability tests showed that the Ni–SiO2 perovskite maintained over 90% of its initial intensity at 80°C for 120 h. The superior thermal stability enhances its suitability for outdoor applications in PSCs.
This study, as well as further research on the stability of perovskites, will facilitate the research and development of photoluminescent perovskites. Moreover, perovskites, which possess high absorption coefficient and long carrier diffusion length are promising next-generation materials for solar cell. The inorganic LHP recently applied to the solar cell and the efficiency of them improved with time. Therefore, this study contributed to development of solar cell with clarifying the chemical properties of inorganic LHP with shell for stability.
Conflicts of Interest
The authors declare no conflicts of interest.
Author Contributions
Myeong Jin Seol: conceptualization, investigation, writing–original draft. Seunghwan Hwang: conceptualization, investigation, writing–original draft. Soo Young Kim: project administration, supervision, writing–review and editing. Myeong Jin Seol and Seunghwan Hwang contributed equally to this work.
Funding
This research was supported by the National Research Foundation (NRF) of Korea (Grant numbers 2020R1A2C2100670 and 2022M3H4A1A04096380).
Acknowledgments
This research was supported by the National Research Foundation (NRF) of Korea (Grant numbers 2020R1A2C2100670 and 2022M3H4A1A04096380).
Supporting Information
Additional supporting information can be found online in the Supporting Information section.
Open Research
Data Availability Statement
The data supporting this article have been included as part of the ESI.


