Enhanced Heat Recovery From Electric Arc Furnaces: Optimization and Comparative Analysis of Steam and Organic Rankine Cycles
Abstract
In this study, two distinct approaches were proposed for recovering heat from the exhaust gases of electric arc furnaces (EAFs)—the steam cycle and the organic Rankine cycle (ORC). These methods were evaluated based on various criteria, including energy and exergy efficiency, economic feasibility, and environmental impacts. To identify optimal performance parameters, the effects of different working fluids in the ORC were examined, revealing significant variations in cycle behavior depending on the fluid used. Consequently, the most effective operational conditions for each specific fluid were identified and recorded based on temperature and pressure fluctuations. The analysis led to the selection of acetone as the optimal working fluid due to its favorable performance despite its high flammability, characterized by its isentropic nature. The energy and exergy efficiencies of the cycle using this fluid reached 21% and 61%, respectively, with a power output of 597.4 kW under maximum conditions. Additionally, the study demonstrated that, given the high temperature of the heat source, the steam cycle is more justifiable than the combined steam and ORC with the proposed configuration. The exergy efficiency of the steam cycle reached a maximum of 57%, with a net power output of 2897 kW and a total cost rate of $0.041/s under these conditions. Finally, by optimizing the steam cycle using a genetic algorithm, the ideal values for exergy efficiency were slightly reduced to 53%, with a significant decrease in the total cost rate to $0.036/s.
1. Introduction
Over time, industrial development and increased human activities have led to a higher increase in energy consumption than before. To meet this growing energy demand, a larger amount of fossil fuels are consumed daily [1]. The use of fossil fuels poses various health and environmental hazards for both humans and ecosystems. Additionally, fossil fuel reserves are limited, and their utilization results in the emission of greenhouse gases (GHGs), contributing to global warming [2]. On the other hand, energy sectors contribute significantly to GHG emissions. Large and energy-intensive industries play a significant role in carbon dioxide emissions [3]; steel and cement industries can be mentioned among these industries [4]. The steel industry is considered one of the largest energy-intensive industries. Steel production annually consumes 21% of the total energy produced and ranks second among the most energy-intensive industries [5]. Global crude steel production for 63 countries was reported to be 152.6 million tons (Mt) in August 2023, representing a 2.2% increase compared to August 2022, according to the World Steel Association. Additionally, global steel demand is expected to grow by more than one-third by the year 2050 [6]. Therefore, recovering wasted energy in these industries can enhance their performance and reduce their emissions [7].
Over the past decades, the steel industry has experienced significant advancements in developing new techniques for energy efficiency [8]. There are ample opportunities throughout the steelmaking process to implement energy-efficient technologies [9]. The largest potential for waste heat in steel plants pertains to the electric arc furnace (EAF) and the reheating furnace (RHF), which are primary processes [10]. Here, we focus on analyzing waste heat from the EAF as the largest source of heat loss in a steel plant. However, besides these primary sources, there are several other sources of wasted heat in a steel plant, such as slag pits, roller tables, or cooling lines in the rolling mill. Although they only provide radiative heat, they can be utilized as small-scale recovery solutions in a heat exchanger (HEX) [11].
Numerous studies have been conducted regarding EAFs, which are commonly used in steel plants. Energy balance studies on EAFs indicate that energy input to these furnaces is wasted in various ways, including exhaust gases, furnace walls, losses due to roof opening, water cooling, radiation losses, and other inefficiencies, with exhaust gases from the furnace accounting for the largest share. Therefore, heat recovery studies from EAFs have primarily focused on recovering heat from this part. Generally, various studies have been conducted on different methods of heat recovery from hot exhaust gases in industries such as steel, cement, glass, and others, involving both high and low-temperature levels. One of the primary methods of heat recovery from exhaust gases in various industries is the utilization of organic Rankine cycles (ORCs). Hoang [12] has investigated ORCs for heat recovery, especially in diesel engines. The results show up to 10% fuel savings, with an overall thermal efficiency of 60%–90% for two or multiloop ORC compared to 10%–25% thermal efficiency for single-loop ORC systems. Liu et al. [13] aimed to enhance marine engine performance and reduce GHG emissions by introducing a new waste heat recovery (WHR) system combining steam and ORCs. Their results show that the new system reduces fuel consumption by up to 9322 tons per year at 100% engine load and increases thermal efficiency by 4.42%. In comparison, a WHR system based on a single steam RC and dual pressure ORC only improves thermal efficiency by 2.68% and 3.42%, respectively. Liao et al. [14] proposed and explored integrated systems based on the ORC as potential solutions for harnessing waste heat from low-to-moderate-temperature flue gases, employing both energy and exergy analysis techniques. The findings of the study showed that compared to ORC systems that solely rely on supercritical carbon dioxide (sCO2), the incorporation of R601a as the working fluid led to significant improvements in thermal and exergetic efficiency, achieving improvements of 16.37% and 45.54%, respectively.
ORC units offer a promising solution for transforming existing industrial plants into carbon-neutral facilities [15]. Bălănescu and Homutescu [16] investigated the addition of an ORC unit downstream of a combined cycle power plant to increase its efficiency. The combined cycle power plant was based on an Orenda OGT15000 gas turbine with a simple cycle output of 16.5 megawatts. This study demonstrated that by adding the ORC unit, the efficiency of the power plant increased by approximately1.1%. Ghoreishi et al. [17] undertook modeling of ORC with various configurations and working fluids, presenting the results in their optimal state. Ultimately, ORCs utilizing n-heptane and toluene were recommended due to their highest efficiencies. Following optimization aimed at making the system more cost-effective, the second law efficiency increased by 5% to reach 20.6%, while the Net Financial Index (NFI) increased by 44.2%.
Holik et al. [18] addressed the heat recovery from exhaust gases in a combined cycle through the RC and ORC, optimizing the proposed system based on the minimum payback period (PBP) and maximum economic output power. The results indicated that the overall energy and electrical efficiencies of the system would reach 66.7% and 42.1%, respectively. After optimization, it was determined that, ultimately, the steam cycle is more economically viable than the ORC, with a total power plant efficiency increase of 2.97%. Kizilkan [19] studied heat recovery from a Brayton closed-cycle power plant, comparing a sCO2 ORC with a simple RC. The results showed higher exergy and energy efficiencies for the ORC compared to the steam cycle. Subsequently, different supercritical working fluids were analyzed, and CO2 was recommended for its energy efficiency of 27.9%.
Khater et al. [20] investigated heat recovery in a cement plant using RC, ORC, and their combination. They proposed six RC schemes and selected cyclopentane as the optimal working fluid for its availability, low cost, and short PBP despite isopropyl pentane showing higher net power and thermal efficiency. The combined steam-ORC was found to be the most effective for high-temperature WHR. Ja’fari et al. [21] studied design criteria, achievable performance, and component costs for ORCs. Various working fluids for the ORC were considered in this research. Additionally, attention was paid to balancing the energy of the EAF as one of the main sources of waste heat generation in the steel production industry.
EAF exhaust gases constitute an intermittent heat source. Therefore, the adaptation of power recovery systems to these temperature fluctuations is a matter of significant importance. Yu et al. [22] propose and investigate integrating an ORC with a latent thermal energy storage (LTES) system to enhance engine WHR, addressing intermittent and fluctuating conditions in-vehicle applications. A melting-solidification model analyzed 12 phase change materials (PCMs), identifying LiNO3-KCl-NaNO3 as the optimal PCM for engine exhaust heat recovery. Comparing three LTES-ORC scenarios revealed that combining ORC with double LTES yields 17.2% more total power output than a single LTES (100 L) under similar conditions. Yu et al. [23] investigated the ORC for low-grade WHR, focusing on the effects of fluctuating thermal power from heat sources. Their study highlighted that safety limitations and efficiency of ORC systems generally decrease with increased amplitude and periods of fluctuations, while higher average temperatures of the heat source expand the allowable fluctuation range. To maintain efficient ORC operation, the allowable relative amplitude should be 25–40 K for large fluctuating periods and above 35 K for periods under 200 s.
Atashbozorg et al. [24] studied and optimized RC and ORC along with Kalina cycles using different arrangements and working fluids to design a WHRS in the steel industry. The results showed that the performance of the Kalina cycle was better than the others, and for ORCs, fluids R11 and R113 were suggested. Biondi et al. [25] conducted a technical-economic analysis of a WHRS using a closed-loop sCO2 cycle for heavy industrial processes. They performed a parametric study on key design parameters, identifying preferred configurations from a thermodynamic standpoint, which were then analyzed economically. The optimal WHR system configuration achieved an overall efficiency of 30.4% and an output power of 21.6 kW.
As evident from the aforementioned studies, numerous research works have individually utilized steam cycles and ORC, with some also exploring these cycles in combination. However, most studies have predominantly focused on the applications of these cycles in nonfluctuating and low-temperature heat sources, lacking a comprehensive comparison between them. One of the innovations in the present study is the detailed evaluation of each of these cycles over a wide range of temperatures and pressures to assess their performance under various conditions. Additionally, a thorough comparison between the steam cycle and the proposed combined cycle has been conducted, taking into account economic and environmental parameters. Another feature of this analysis is the examination of different working fluids and the selection of the optimal fluid for the ORC, along with the bi-objective optimization of the steam cycle. This approach provides clarity and facilitates a more comprehensive comparison between the cycles under the conditions specified in the study.
- •
A comprehensive and multifaceted comparative evaluation of ORC working fluids in a range of turbine inlet temperatures and showing the changes in their various behaviors with respect to this temperature.
- •
A genetic algorithm-based optimization approach for enhancing exergy and economic performance of the final cycle: a coupled Engineering Equation Solver (EES)-MATLAB framework.
- •
A comprehensive analysis of energy, exergy, economic, and enviroeconomic considerations for system evaluation.
2. System Description
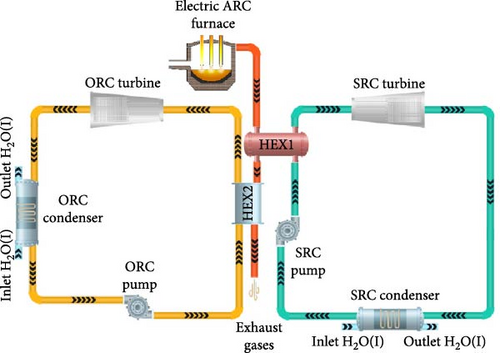
This study aims to design a WHRS for exhaust gases from EAFs. For this purpose, two separate power generation cycles have been utilized, as illustrated in Figure 1, including Figure 1a: a simple cycle consisting of the RC, and Figure 1b: a combined cycle consisting of the RC and ORC. Finally, by examining the performance of the two cycles in optimal conditions in terms of energy, exergy, economy, and environmental aspects, the two cycles were compared with each other. It is worth mentioning that the EES software was used for simulating the cycles, and the system optimization was performed by the genetic algorithm of MATLAB software.

2.1. Methods and Material
- •
All processes have been considered as steady-state.
- •
Pressure drop and gravitational effects have been ignored in all sections.
- •
The ambient temperature and pressure are considered to be 298 K and 101.325 kPa, respectively.
- •
The chemical composition of the exhaust gases is considered as follows: 0.25 CO2, 0.25 CO, 0.50 N2, where the coefficients represent the volume percentages of each component [26].
To better understand the potential of EAFs and obtain accurate values for the flow rate and energy of the exhaust gases from these furnaces, a number of these furnaces from previous studies listed in Table 1 have been used in the energy balance. The furnace specifications used in this study are derived from the average values presented in Table 1. Based on Table 1, a selected furnace capacity of 100 tons per hour has been considered, which is approximately equivalent to the average capacity of EAFs in previous studies and various factories (96.56 tons per hour). The exhaust gas energy is also estimated at 155 kWh per ton, obtained by multiplying the selected furnace capacity by the ratio of average gas energy to furnace capacity.
| Furnace capacity (t) | Off-gas energy (kWh/t) | Total energy (kWh/t) | EAF-electric energy (kWh/t) | Percent of off-gas energy (%) | Off-gas energy/furnace capacity |
|---|---|---|---|---|---|
| 55 | 100 | 726 | 571 | 13.77 | 1.82 |
| 55 | 317 | 832 | 347 | 38.10 | 5.28 |
| 60 | 109 | 683 | 408 | 15.95 | 1.82 |
| 60 | 150 | 715 | 465 | 20.97 | 2.5 |
| 60 | 150 | 715 | 429 | 20.97 | 2.14 |
| 70 | 96 | 664 | 477 | 14.45 | 1.28 |
| 75 | 90 | 696 | 459 | 12.93 | 1.2 |
| 75 | 105 | 659 | 422 | 15.93 | 1.31 |
| 80 | 81 | 678 | 560 | 11.94 | 1.01 |
| 80 | 85 | 590 | 380 | 14.40 | 0.85 |
| 100 | 33 | 732 | 577 | 4.50 | 0.33 |
| 100 | 68 | 628 | 91 | 10.82 | 0.68 |
| 100 | 97 | 606 | 287 | 16.00 | 0.97 |
| 100 | 110 | 625 | 365 | 17.60 | 1.10 |
| 100 | 138 | 754 | 459 | 18.30 | 1.38 |
| 100 | 140 | 791 | 413 | 17.69 | 1.40 |
| 100 | 141 | 798 | 401 | 17.66 | 1.41 |
| 100 | 141 | 786 | 445 | 17.93 | 1.41 |
| 100 | 141 | 809 | 423 | 17.42 | 1.41 |
| 100 | 158 | 810 | 557 | 19.50 | 1.58 |
| 100 | 168 | 798 | 541 | 21.05 | 1.46 |
| 115 | 127 | 704 | 487 | 18.03 | 1.02 |
| 125 | 48 | 660 | 462 | 7.27 | 0.32 |
| 150 | 102 | 649 | 450 | 15.71 | 0.68 |
| 150 | 229 | 678 | 312 | 33.77 | 1.53 |
| 150 | 232 | 775 | 300 | 29.93 | 3.31 |
| 70 | 194 | 757 | 415 | 25.62 | 1.62 |
| 120 | 226 | 720 | 356 | 31.38 | 1.51 |
| 150 | 244 | 732 | 357 | 33.33 | 2.53 |
| Average | Average | Average | Average | Average | Average |
| 96.56 | 138.62 | 716.20 | 421.24 | 19.10 | 1.55 |
- Abbreviation: EAFs, electric arc furnaces.
Another important characteristic of the exhaust gases from EAFs is their temperature. Regarding the temperature of these gases, it should be noted that this temperature varies depending on the different stages of the furnace cycle during the melting process, such as the start of melting, charging, slag tapping phase, and burner opening phase, as shown in Figure 2. For this reason, in most previous studies, an average temperature has been used for calculations. Based on Figure 2, this temperature can be considered to be 600°C [32].
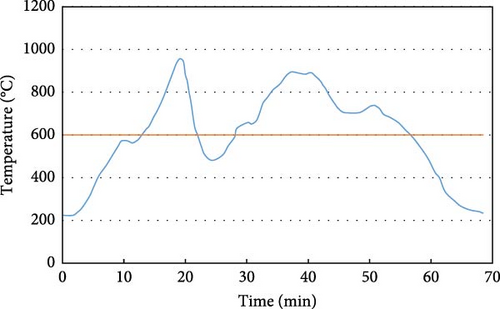
Now, with the temperature and constituents of the exhaust gases, the enthalpy of these gases, equal to 808.9 kJ/kg, has been determined. Moreover, knowing the enthalpy of these gases along with their energy, the mass flow rate can be calculated by dividing the energy by the enthalpy, resulting in a value of 19.12 kg/s.
The remaining computational parameters used for the investigated system are listed in Table 2.
| Parameters | Value | Parameters | Value |
|---|---|---|---|
| Isentropic efficiency of ORC turbine | 0.85 | Isentropic efficiency of SRC turbine | 0.9 |
| Isentropic efficiency of ORC pump | 0.85 | Isentropic efficiency of the SRC pump | 0.8 |
| Exhaust gas temperature | 873 K | Exhaust gas flow rate | 19.2 kg/s |
| Heat exchanger pinch point temperature difference | 10 K | Condenser pinch point temperature difference | 5 K |
- Abbreviations: ORC, organic Rankine cycle; SRC, steam Rankine cycle.
2.2. System Modeling
As mentioned, the system studied in this research consists of two RCs: a steam Rankine cycle (SRC) and an ORC. The general thermodynamic equations for modeling these cycles are as follows:
This equation states that the energy input and output of a device undergoing a thermodynamic process must be equal.
2.3. Enviroeconomic Analyses
The trade cost of CO2 in the above formula is currently set at $40 per ton.
2.4. Economic Analysis
The equations used to calculate the price related to each component of the system in both scenarios are presented in Table 3 [36, 37].
| Components | Cost function |
|---|---|
| RC condenser | |
| RC turbine | |
| RC pump | |
| ORC turbine | |
| ORC pump | |
| ORC condenser |
- Abbreviations: ORC, organic Rankine cycle; RC, Rankine cycle.
While AEP represents the annual energy production, and n equals the project’s lifetime.
Detailed calculations related to this section can be found in Appendix A.
The EUAB represents the equivalent uniform annual benefit, and the electricity selling price in the calculations above is assumed to be 0.023 $/kWh.
2.5. Working Fluids
The thermodynamic behavior of working fluids can be identified based on the slope of their thermodynamic curves [42]. Working fluids are categorized into three groups based on the slope of their saturation vapor curve (dT/dS): dry fluids with dT/dS > 0, wet fluids with dT/dS < 0, and isentropic fluids with dT/dS ≈ 0 [43]. The T–s diagrams corresponding to each category are shown in Figure 3. Since there is no significant working fluid available, some fluids whose saturation vapor curve slope is approximately in the range between −0.5 and 0.5 can be considered isentropic fluids [44]. In systems with low inlet turbine temperatures and high inlet pressures, moist working fluids with a negative slope on the diagram may have lower efficiency due to compression and significant quality drop at the turbine outlet, leading to potential damage to the blades and system inefficiency. On the other hand, dry and isentropic working fluids demonstrate good performance because these fluids will approach isentropic expansion in the superheated region [45]. In general, the selection of a suitable working fluid plays a vital role in the performance of an organic cycle. Depending on the temperature and operational conditions of the organic cycle, the proper selection of the working fluid can lead to increased efficiency and reduced initial costs and system inefficiencies [46–48]. Therefore, the working fluid should have optimal properties at suitable states, considering numerous criteria such as economic viability, nontoxicity, nonflammability, environmental compatibility, and safety [49]. Furthermore, crossing the maximum temperature limit of the working fluid’s chemical decomposition can lead to sudden changes in its properties, which may result in instability within the system [50]. Mago et al. [51] and Hung et al. [52] concluded that wet fluids experience a decrease in efficiency with increasing temperature. Additionally, the study by Köse et al. [53] showed that isentropic fluids perform better than dry fluids under conditions similar to those in the present study.

In the present study, considering the mentioned standards and the high temperature of the waste heat sources used, it was concluded that isentropic fluids, which have shown better performance in previous studies, along with some dry fluids, would be used. These fluids include R113, R141b, acetone, R600, R245fa, and R123, and they are examined in Table 4. As indicated in Table 4, each of these fluids has its advantages and disadvantages compared to others. Some fluids may perform better, but they might pose serious environmental and safety risks. Therefore, all aspects need to be considered when evaluating these fluids. Regarding the parameters of ozone depletion potential (ODP) and global warming potential (GWP) [59].
| Working fluids | Type | Tcrit ( °C) | Pcrit (MPa) | TMax ( °C) | Flammability | Toxicity | GWP | ODP | Safety group |
|---|---|---|---|---|---|---|---|---|---|
| R113 | Dry | 252 | 3.392 | 214 | Low | None | 6130 | 0.85 | A1 |
| R141b | Isentropic | 227 | 4.212 | 204 | Medium | Low | 717 | 0.12 | A2 |
| Acetone | Isentropic | 276 | 4.7 | 234 | High | Low | 0.5 | 0 | A3 |
| R600 | Dry | 302 | 3.8 | 152 | High | Low | 20 | 0 | A3 |
| R245fa | Isentropic | 167 | 3.651 | 154 | None | High | 1050 | 0 | B1 |
| R123 | Dry/Isentropic | 327 | 3.668 | 183 | None | High | 77 | 0.02 | B1 |
- Abbreviations: GWP, global warming potential; ODP, ozone depletion potential.
3. Results and Discussion
In this section, the performance of the first scenario, namely the RC, was initially evaluated parametrically from various perspectives, and the results were discussed. Subsequently, by examining the RC, the performance of different selected working fluids was demonstrated in various ways, and the working fluid that exhibited the best performance was introduced. In the next section, the second scenario, which includes a combined cycle of RC and ORC, was investigated. Finally, the RC was optimized using a genetic algorithm, and by applying the optimal parameters, the performance of the two scenarios was compared from four perspectives: energy, exergy, economic, and environmental, in the most optimal conditions.
3.1. SRC Cycle
To analyze the parametric performance of the steam cycle, the performance of the cycle was evaluated against changes in the inlet turbine temperature and pressure, ranging from 473 to 753 K and 1–10 megapascals, respectively. The variations in parameters such as energy efficiency, exergy, net power output, fluid flow rate, and steam quality at the turbine outlet can be observed in Figure 4.
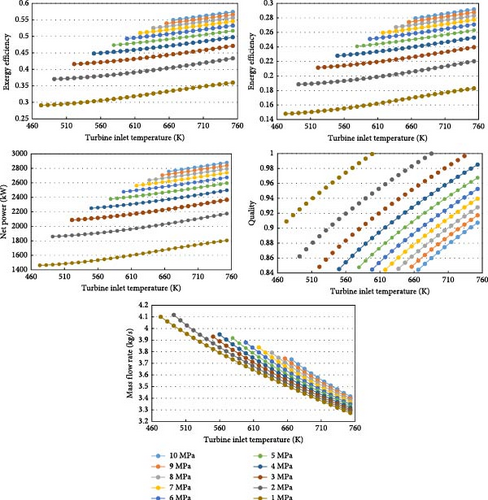
Based on the results presented in Figure 4, it is evident that the system performance improves with an increase in the turbine inlet temperature and pressure. At the lowest turbine inlet temperature and pressure of 473 K and 1 MPa, respectively, the energy efficiency, exergy, and net power output are 0.148, 0.291, and 1461 kW. These values increase to 0.2917, 0.5736, and 2879 kW, respectively, at a temperature and pressure of 753 K and 10 MPa. Additionally, the trend of changes in steam flow rate throughout this range of temperature and pressure variations is completely inverse. The steam flow rate decreases from 4.1 to 3.415 kg/s with an increase in temperature and pressure. The trend of changes in the steam flow rate is such that it decreases with an increase in temperature and increases with an increase in pressure.
As depicted in Figure 4, the steam quality at the turbine outlet exhibits a decreasing trend with increasing pressure, while it increases with temperature. It is noteworthy that in this study, all parameters and variations have been considered to ensure that the steam quality at the turbine outlet remains above 0.8.
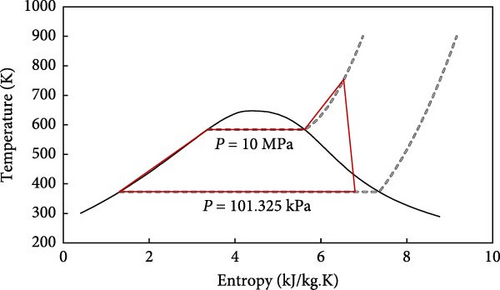
Based on the obtained results for the RC, the best performance of this cycle is observed at a temperature and pressure of 753 K and 10 MPa. Therefore, the temperature-entropy diagram of the steam cycle in this state is presented in Figure 5. Although this study employs a condensing pressure of 101.325 kPa for simplicity, exploring lower condensing pressures, such as 5 kPa, in conjunction with advanced cooling systems and multipressure evaporation strategies could significantly improve the thermodynamic performance of the system. These advanced configurations require further investigation in future studies to optimize cycle efficiency and assess their practical feasibility.
3.2. ORC Cycle
In this section, to facilitate a fair comparison between the selected working fluids, similar to the previous section, variations in parameters such as net cycle power, energy efficiency, and exergy, along with fluid mass flow rate for each fluid, are presented as functions of changes in turbine inlet temperature and pressure.
It’s worth noting that the range of temperature and pressure variations differs for each fluid and is based on the properties reported in Table 4. Specifically, the pressure range for each fluid starts from 1 MPa and continues up to its critical pressure. Similarly, the temperature variations start from the saturation temperature of the fluid at 1 MPa pressure and continue up to the maximum temperature reported for each fluid in Table 4.
The term “maximum temperature” refers to the highest temperature at which the chemical composition of the fluid remains intact. Beyond this temperature, chemical degradation occurs, leading to sudden changes in fluid properties. It should be emphasized that in this section, all parameters and variations have been considered in such a way that the steam quality at the turbine outlet remains above 0.9. Additionally, the condenser pressure in these cycles is assumed to be equal to atmospheric pressure, similar to the steam cycle.
The variations of net cycle power concerning turbine inlet temperature and pressure are depicted in Figure 6. According to the results presented in Figure 6, the net cycle power for different fluids exhibits different behaviors depending on the type of fluid (dry, moist, or isentropic). For instance, at high pressures, an increase in turbine inlet temperature results in an increase in net cycle power for the isentropic fluids, such as R141b, R245fa, and acetone. Conversely, for dry fluids like R113, R123, and R600, the net cycle power initially increases up to a certain pressure and then decreases. At lower pressures, we observe a different trend where, as we move from higher to lower pressures, the net cycle power decreases with an increase in temperature for R600 and R113. This trend is also observed with less intensity for R141b, R245fa, and R123, while for acetone, although the trend remains ascending, its intensity is reduced. Regarding the variations of net cycle power at constant temperature, it can be observed that, except for R141b and acetone, the net cycle power increases with an increase in turbine inlet pressure for all fluids. However, for these two fluids, the overall trend is similar to other fluids, but it reverses at higher pressures.
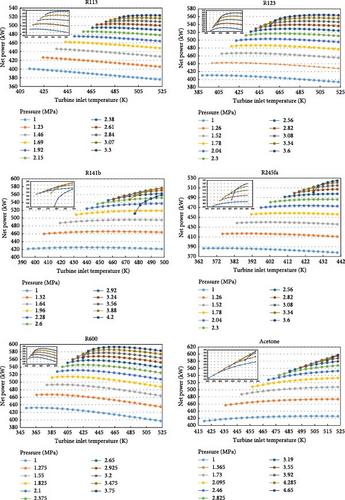
As depicted in Figure 6, the highest net cycle power is associated with acetone, occurring at a temperature of 523 K and a pressure of 4.285 MPa, yielding a value of 597.4 kW. Conversely, the lowest value is related to R113, occurring at a temperature of 523 K and a pressure of 1 MPa, resulting in a value of 376.1 kW.
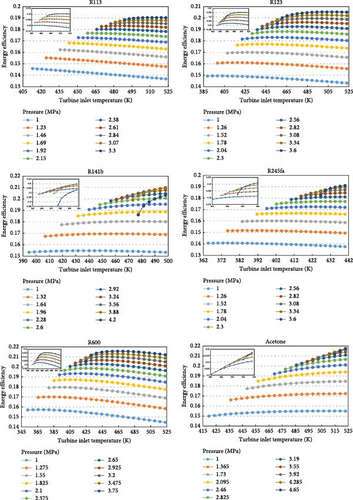
Another important parameter that has been investigated is the energy efficiency of the cycle, whose variations for each fluid are shown as a function of turbine inlet temperature and pressure in Figure 7. Considering the provided relationship for energy efficiency, it can be observed that the behavior of energy efficiency and net power output is similar, as shown in Figure 7 because they have a direct relationship with each other. As depicted in Figure 7, except for specific cases, the system’s efficiency has increased with the increase in turbine inlet temperature and pressure. The highest energy efficiency is equal to 0.2174, corresponding to acetone fluid at a temperature and pressure of 523 K and 4.285 MPa. Similarly, the lowest efficiency value is 0.1368, attributed to the R113 fluid under conditions of 523 K and 1 MPa.
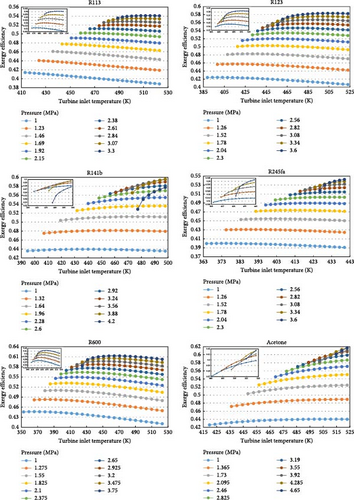
Another parameter is the exergy efficiency of the system, which exhibits a behavior similar to the previous two parameters and can be observed in Figure 8. As depicted in Figure 8, the highest exergy efficiency, like the previous parameters, occurs under similar conditions and is equal to 0.6173. Similarly, the lowest value of this parameter is 0.3886.
Finally, the mass flow rate of the fluid is examined as the last influential parameter, and the results are presented in Figure 9. According to Figure 9, the mass flow rate of fluids decreases with an increase in turbine inlet temperature, a trend observed in all fluids. Additionally, with an increase in turbine pressure, the mass flow rate exhibits a decreasing trend for all fluids as well. The lowest mass flow rate is 3.021 kg/s, observed for R600 under conditions of 523 K and 1 MPa, while the highest mass flow rate is 13.85 kg/s, observed for R113 under conditions of 413 K and 1 MPa. Furthermore, the mass flow rate for acetone under conditions of 523 K and 4.285 MPa, which had the highest energy efficiency, exergy efficiency, and net power output of the system, is 3.895 kg/s.
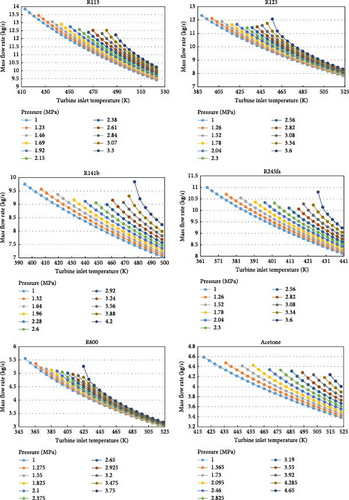
It is important to note that as the required fluid flow rate decreases in the cycle, the power required by the pump will also decrease. Considering this point, it can be expected that the power required by the pump will exhibit a behavior similar to the mass flow rate in response to changes in temperature and pressure. Therefore, the required mass flow rate of the fluid is significant, and having a lower value for the required mass flow rate can be considered an advantage. Now, to better understand and compare the selected fluids, the conditions corresponding to the best performance of each fluid are listed in Table 5.
| Working fluids | ηMax | φMax | Ttur(K) | Ptur(MPa) | ||
|---|---|---|---|---|---|---|
| R113 | 0.1904 | 0.5408 | 523.3 | 10.72 | 511.6 | 3.3 |
| R141b | 0.2099 | 0.5962 | 577 | 7.987 | 498 | 3.88 |
| Acetone | 0.2174 | 0.6173 | 597.4 | 3.895 | 523 | 4.285 |
| R600 | 0.2157 | 0.6127 | 593 | 3.971 | 464 | 3.75 |
| R245fa | 0.191 | 0.5425 | 524.9 | 9.235 | 440 | 3.6 |
| R123 | 0.2053 | 0.5832 | 564.3 | 8.927 | 503.8 | 3.6 |
According to Table 5, the order of fluids based on the best performance they demonstrated from strongest to weakest will be acetone, R600, R141b, R123, R245fa, and R113. It is clear that acetone, which is an isentropic fluid, performs best under the conditions of 523 K and 4.285 MPa.
While acetone is the best-performing fluid for ORC, its flammability poses significant environmental and safety risks. However, acetone has a lower GWP of 0.5 and ODP of 0, making it environmentally preferable. To mitigate flammability risks, an intermediate heat transfer circuit can prevent direct contact with heat sources. Using flame-resistant materials, installing fire and leak detection systems, and conducting regular safety training and emergency drills are essential. These strategies significantly improve the safety and environmental impact of using acetone in ORC systems. The temperature-entropy diagram corresponding to each fluid under the conditions specified in Table 5 can be observed in Figure 10. The potential safety hazards associated with the flammability of some organic working fluids warrant further investigation. Future research should explore the implementation of an intermediate heat transfer circuit, carefully considering its impact on system efficiency, cost-effectiveness, and overall system performance.
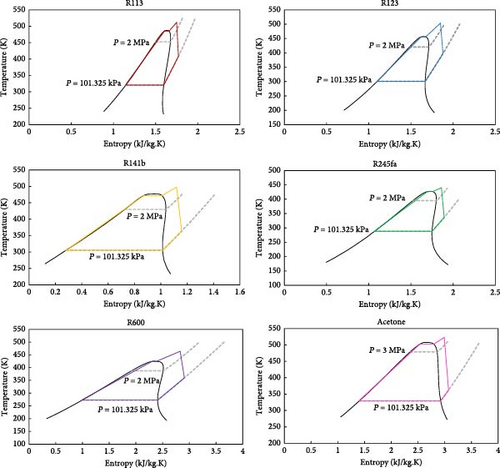
In previous studies, some examples support the results obtained in this study with acceptable accuracy. Köse et al. [53] examined organic cycles with six different working fluids, four of which include acetone, R141b, R113, and R245fa. By reviewing the reported ranges of energy and exergy efficiency for these four fluids, it is evident that the results obtained overlap with the present study. Additionally, Ghoreishi et al. [17] reported the energy efficiency for the working fluid R-245fa at a turbine inlet temperature and pressure of 373 K and 1.275 MPa to be 13.54%. In the present study, this energy efficiency at a turbine inlet temperature and pressure of 375 K and 1.26 MPa was calculated to be 15.15%, which aligns with their research with acceptable accuracy.
3.3. SRC–ORC Combined Cycle
In this section, the second scenario involving the combined SRC–ORC cycle, which consists of an RC and an ORC with acetone as the working fluid in their best operational conditions, has been examined. The results obtained from this scenario have been compared with the previous section and the SRC cycle in terms of energy, exergy, economics, and environmental aspects. To compare the two scenarios in terms of energy and exergy, parameters such as energy efficiency, exergy efficiency, and net power generation have been utilized. For the economic and environmental comparison of the two scenarios, parameters including total cost, NPV, PBP, and capital due to carbon emission reduction have been considered. The results of each scenario comparison can be found in Table 6.
| Scenarios | η | φ | CCG ($/year) | Ztot ($) | NPV ($) | PBP (year) | |
|---|---|---|---|---|---|---|---|
| SRC | 2879 | 0.29 | 0.57 | 335,391 | 1.196 × 10⁶ | 6.142 × 10⁶ | 2.714 |
| SRC–ORC | 2675 | 0.27 | 0.53 | 311,583 | 1.595 × 10⁶ | 4.755 × 10⁶ | 4.259 |
- Abbreviations: CCG, carbon credits gain; NPV, net present value; ORC, organic Rankine cycle; PBP, payback period; SRC, steam Rankine cycle.
Based on the results presented in Table 6, it is evident that in this study, the SRC cycle and the first scenario generally exhibit better performance, with higher net power output, lower initial cost, and shorter PBP. In this study, due to the high temperature of the heat source (exhaust gases) and the greater temperature difference with the working fluids in the ORC compared to low-temperature sources, the ORC loses its efficiency advantage relative to steam cycles. Consequently, the combined cycle’s overall efficiency decreases. However, alternative configurations can still be effective. For example, the waste heat from the steam cycle’s condenser can be used as the heat source for the ORC, or higher-temperature working fluids can be employed to reduce the temperature difference, leading to improved efficiency. These adjustments can make the combined cycles more cost-effective and efficient within optimal temperature ranges. Moreover, advancements in this field continue to enhance their economic viability and flexibility in energy supply compared to steam cycles. Furthermore, to improve the system’s performance and find the optimal operating point in these cycles under the conditions provided in the present study, steam cycle optimization using a genetic algorithm has been conducted.
3.4. Optimization
The genetic algorithm is a type of computational model based on evolution, and for every problem, possible solutions are encoded in chromosome-like structures [60]. In many cases, genetic algorithms are used to optimize objective functions for various problems. A Rankine steam cycle can be analyzed from two perspectives using two main criteria. The first perspective is to assess the system in terms of improving its performance, which is well covered by the criterion of exergy efficiency (φ).
The second perspective is the feasibility of implementation and execution, which can be addressed by the criterion of system cost rate. By selecting these two criteria as the main outputs of the system, the key influential parameters need to be identified. Among the various parameters of the RC in this study, five parameters were considered as decision variables: turbine pressure (Ptur), turbine temperature (Ttur), condenser pressure (Pcond), isentropic efficiency of the turbine, and pump.
Figure 11 illustrates the optimization process steps. As mentioned, in this study, we have two main outputs: exergy efficiency and cost rate. We aim to find the maximum value for the former and the minimum value for the latter based on certain variations of the five decision variables specified in Table 7.

| Decision variable | Lower band | Upper band |
|---|---|---|
| Tture,SRC(K) | 673 | 753 |
| Pture,SRC(kPa) | 5000 | 10,000 |
| Pcond,SRC(kPa) | 100 | 180 |
| ηisture,SRC(% ) | 80 | 95 |
| ηispump,SRC(% ) | 80 | 95 |
- Abbreviation: SRC, steam Rankine cycle.
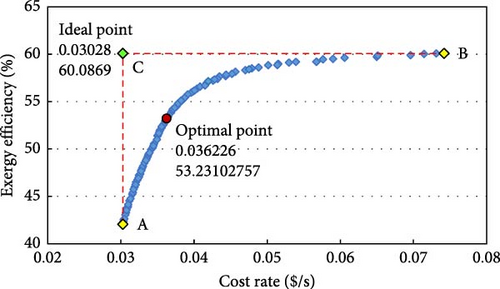
The optimization curve is depicted in Figure 12. Based on Figure 12, the characteristics of the ideal point, which aims for the lowest cost and highest efficiency, are visible in the upper-left part of the chart, marked with green. The main optimal point, which should have the least distance from the ideal point, is indicated in red on the graph, and its specifications are reported. Additionally, the specifications of points A and B, along with the ideal point corresponding to all decision variables and objective functions, are provided in Table 8.
| Parameters | A | B | Optimal |
|---|---|---|---|
| Tture,SRC(K) | 673 | 741 | 741 |
| Pture,SRC(kPa) | 5083 | 9780 | 9653 |
| Pcond,SRC(kPa) | 139.3 | 103.6 | 102.6 |
| ηisture,SRC(% ) | 80 | 95 | 84 |
| ηispump,SRC(% ) | 80 | 93 | 83 |
| Cost rate ($/s) | 0.030 | 0.074 | 0.036 |
| ηexergy(% ) | 42 | 60 | 53.2 |
- Abbreviation: SRC, steam Rankine cycle.
Figure 13 illustrates the validation curves for the neural network model developed for the two objective functions selected in this study. These curves demonstrate the acceptable accuracy of the neural network model in predicting the performance of the power cycle.

The scatter plots of optimal points corresponding to the five decision variables are also provided in Figure 14. The clustering pattern of these points is influenced by the location of the main optimal point. Increasing the pressure in the steam cycle leads to improved efficiency and net power of the cycle. However, it also increases the turbine cost. Considering the selected range for this parameter and the clustering of points in the upper range and around the maximum pressure of 10,000 kPa, it can be concluded that the favorable effect of increasing efficiency and power output outweighs the increase in cost.
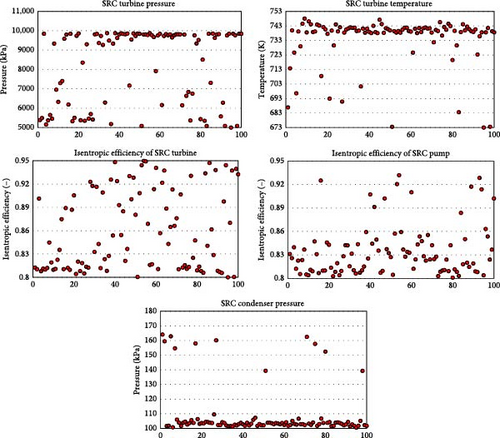
Regarding the turbine inlet temperature, similar to the previous parameter of inlet fluid pressure, increasing this parameter improves system performance while simultaneously increasing the cost. Observing the scatter plot related to this parameter, it can be seen that most points are located in the upper range and around the temperature of 743 K. The next parameter is the low pressure of the steam cycle or the condenser pressure. The scatter plot of optimal points in this parameter indicates that most points are in the lower range and around 100 kPa because increasing this parameter leads to a decrease in the net power of the cycle.
The remaining two parameters are the isentropic efficiency of the turbine and pump. As evident, increasing these two parameters also increases the overall system efficiency. However, these parameters are influential factors in the price of the turbine and pump. Therefore, as observed in the scatter plot related to them, the clustering of optimal points for both of these parameters, especially the isentropic efficiency of the pump, has occurred in the lower range of the considered interval to prevent the final price of the system from exceeding a reasonable limit.
The results related to the analysis of the systems, this time after optimization and at the primary optimum point, are presented in Table 9.
| Scenario | η | φ | CCG ($/year) | Cost rate ($/s) | NPV ($) | PBP (year) | |
|---|---|---|---|---|---|---|---|
| SRC | 2672 | 0.27 | 0.53 | 311,288 | 0.036 | 5.803 × 10⁶ | 2.563 |
| SRC–ORC | 2526 | 0.25 | 0.50 | 294,192 | 0.0515 | 4.531 × 10⁶ | 4.181 |
- Abbreviations: CCG, carbon credits gain; NPV, net present value; ORC, organic Rankine cycle; PBP, payback period; SRC, steam Rankine cycle.
Finally, the effects of variations in the exhaust gas temperatures, as one of the important and influential parameters on the exergy efficiency and net power generation in heat recovery systems, have been investigated. The results obtained are shown in Figure 15 for reference.

As expected, with an increase in the temperature of these gases, the net power generation has increased due to the increase in the input exergy to the heat recovery cycles. However, due to the widening temperature difference between the fluid entering the turbine in the steam cycle and the hot exhaust gases, the exergy efficiency of these cycles has decreased. This phenomenon has led to a reduction in the overall exergy efficiency in all three heat recovery systems.
4. Conclusion
- •
Upon analyzing the first scenario, which involves using the RC for heat recovery with varying turbine inlet temperature and pressure, it was found that the optimal performance occurs at 753 K and 10 MPa. At these conditions, the cycle’s energy efficiency is 29%, exergy efficiency is 57%, and the net power reaches 2897 kW.
- •
Examining the effect of variations in temperature and pressure at the turbine inlet on ORC performance revealed that cycle behavior varies with different working fluids. Based on these variations, the investigation identified and reported the optimal operational state for each fluid.
- •
Acetone exhibited the best performance as an isentropic fluid among the selected working fluids for the ORC. At maximum conditions, the cycle’s energy efficiency and exergy efficiency for acetone reached 21% and 61%, respectively, with a generated power of 597.4 units. The turbine inlet temperature and pressure were 523 K and 4285 kPa. Acetone also required the least mass flow rate and had favorable environmental conditions with low ODP and GWP. However, its flammability is a drawback. Overall, considering all factors, acetone can be introduced as a suitable working fluid among the selected ones.
- •
Examining the combined cycle and the second scenario revealed that the maximum energy efficiency is 27%, and the exergy efficiency is 53%. The net power output is 2675 kW.
- •
By optimizing the RC to minimize total cost and maximize exergy efficiency, the optimal turbine inlet temperature and pressure were found to be 741.43 K and 9653 kPa. At these conditions, the energy and exergy efficiencies were 27% and 53%, and the net power output and total cost rate were 2672 kW and $0.036/s. When these optimal parameters were applied to the combined cycle, the energy efficiency and exergy efficiency decreased to 25% and 50%, respectively, with a net power output of 2526 kW and a total cost rate of $0.051/s.
Nomenclature
Nomenclature
-
- ex:
-
- Exergy (kJ/kg)
-
- h:
-
- Specific enthalpy (kJ/kg)
-
- s:
-
- Specific entropy (kJ/kg⋅K)
-
- P:
-
- Pressure (kPa)
-
- T:
-
- Temperature (K)
-
- M:
-
- Molecular weight (kg/kmol)
-
- :
-
- Mass flow rate (kg/s)
-
- W:
-
- Power (kW)
-
- Q:
-
- Heat (kW)
-
- Z:
-
- Cost function ($/s)
Abbreviations
-
- HEX:
-
- Heat exchanger
-
- LCOE:
-
- Levelized cost of energy
-
- ODP:
-
- Ozone depletion potential
-
- LMTD:
-
- Logarithmic mean temperature difference
-
- NPV:
-
- Net present value
-
- ORC:
-
- Organic Rankine cycle
-
- SRC:
-
- Steam Rankine cycle
Subscripts
-
- ch:
-
- Chemical
-
- cond:
-
- Condenser
-
- in:
-
- Inlet
-
- is:
-
- Isentropic
-
- out:
-
- Outlet
-
- ph:
-
- Physical
-
- ref:
-
- Reference
-
- tot:
-
- Total
Greek Letter
-
- η:
-
- Energy efficiency
-
- φ:
-
- Exergy efficiency
-
- ρ:
-
- Density (kg/m3).
Conflicts of Interest
The authors declare no conflicts of interest.
Author Contributions
Mahdi Mehrpour: conceptualization, data reduction, formal analysis, investigation, methodology, validation, writing–original draft. Ehsan Houshfar: conceptualization, methodology, project administration, supervision, validation, visualization, writing–review and editing. Mehdi Ashjaee: methodology, resources, supervision, writing–review and editing.
Funding
The authors declare this research received no specific grant from any funding agency in the public, commercial, or not-for-profit sectors.
Appendix A
Open Research
Data Availability Statement
The data that support the findings of this study are available from the corresponding author upon reasonable request.


