Lithology Identification and Estimation of Total Organic Carbon in Organic Shale Through Machine Learning Approaches: Insight From Geochemical Analysis for Source Rock Evaluation
Abstract
Identification and classification of lithology and estimating total organic carbon (TOC) content in organic shale for source rock evaluation are challenging through indirect approaches in the sedimentary basin and have been addressed in current research through machine learning (ML) approaches. The Kohat sub-basin is the most prolific basin of Pakistan due to its multiple active petroleum fields and prospective strata ranging from the Cambrian to the Miocene, supported by a hydrocarbon system. While earlier investigations have suggested the potential presence of oil and gas in the source rocks, the region has encountered difficulties making substantial oil discoveries due to a limited understanding of source rock evaluation and complex geological structures. The present study deals with seismic structural interpretation, geochemical analysis for source rock evaluation, lithology identification through ML, and estimation of TOC content using conventional well logs, ML, and lab measured data. The numerical models and ML algorithms based on well log data were applied to estimate TOC content. Lithology delineations through ML were performed within each formation, particularly shale, marl, and limestone in the Patala Formation and sandstone and shale in the Hangu Formation. To evaluate the Paleocene (Hangu and Patala formations) source potential in the basin, a thorough geochemical investigation and source rock evaluation of X-01 core/well cuttings were conducted. TOC, Rock-Eval (RE) pyrolysis, vitrinite reflectance techniques, and well log analysis were employed. The TOC values of Hangu Formation are 0.90%–3.20%, which lies in fair to excellent, and Patala Formation 0.82%–2.70%, which shows fair to good TOC content. In this study, it has been inferred that Passey’s method provided better results in estimating the TOC in comparison to core/well cutting measured TOC. The TOC estimate results indicate that the correlation coefficient (R) values for well log ∆logR method exceed 0.92 for both formations. In contrast, the random forest (RF)–based ML method demonstrates an R value of 0.94. The Kerogen currently seems to be type II and type III. Generation potential is mostly poor, but at some points, Patala and Hangu show fair to good potential. Study formations’ vitrinite reflectance (Ro) exists in the oil window. Ro values represent vitrinite as the dominant maceral in the Paleocene strata. The second principal maceral is inertinite, and the third maceral is solid bitumen. Pyrite is observed as the main accessory mineral in Paleocene strata. This study proves that well log data can be employed confidently to assess the organic source rock potential even without geochemical data in similar basins around the globe.
1. Introduction
Hydrocarbon exploration and production (E&P) are crucial for a nation’s prosperity and economy. There is an urgent need for a thorough investigation of unconventional hydrocarbon resources due to the depletion of conventional hydrocarbon resources [1]. Shale gas reservoir exploitation in Pakistan can increase gas production and lessen the impact of the ongoing energy crisis, a paramount issue for the country to meet its energy demand. The limited availability of core data and samples to evaluate the shale is the main challenge facing researchers as well as E&P companies in Pakistan [2–4]. Due to this, only a few businesses are engaged in shale–gas reservoir exploration and development in Pakistan. Several researchers have investigated the geological characteristics of Pakistani shale. Still, in-depth work on geochemical, oil source correlation, biomarkers, petrophysical, and geomechanical characterization is limited, which is necessary to determine the shale’s true potential [4–8]. This study will be helpful to identify a possible candidate for exploiting unconventional shale–gas and understanding the untapped hydrocarbon resources in the study area by using geochemical and well log data analysis.
Hydrocarbons are used as a source of energy and are projected to constitute over 50% of the global primary energy supply by 2040 [9]. The rapid shift from conventional to unconventional exploration in hydrocarbons is an unavoidable trend because of developments in E&P technology to meet current energy demand. The effective exploration of shale oil and gas in North America attracts the world to exemplify this tendency [10]. The evaluation of quality in heterogeneous shale oil reservoirs, along with the identification of optimal exploration targets, poses significant challenges for geologists and petroleum explorers. Several methods and models have been suggested to assess the unconventional resources [11–13]. Nowadays, there are limited studies available that properly and systematically describe state-of-the-art technology to understand and efficiently predict lithology and total organic carbon (TOC) in organic shale through machine learning (ML) approaches.
Geochemical data sets are unique datasets that internal and external laboratories create to evaluate source rock potential. Such data are difficult to handle, to study geographically or statistically, and costly and time-consuming, but they still provide reliable results [14–16]. Despite its many benefits, the geochemical approach has certain drawbacks, such as the fact that it is expensive and time-consuming, that results are sometimes absent, and that core cutting samples lack consistency [17]. Numerous researchers worldwide are using deterministic and theoretical techniques to extrapolate geochemical data from conventional well logs in an effort to discover the best possible answer to this problem [18, 19]. Nowadays, it has been observed that ML can revolutionize geochemical properties by leveraging the power of data analysis, pattern recognition, and predictive modeling.
Lithology identification is an essential parameter to predict sweet spots for hydrocarbon exploration because well log data and petrophysical observations of subsurface strata that reflect lithological successions are commonly employed in lithology identification [20]. Nowadays, the lithology study is considered essential for describing the composition and structure of sedimentary sequences under different hydrodynamic conditions which has a significant impact on the petrophysical parameters of geological formations. The main conventional techniques that were used to identify subsurface lithology are core observation and logging data analysis and the most straightforward and efficient method and performing thorough visual examinations, but this approach may be significantly expensive and have some limitations in terms of the extent of depth coverage [21–24]. To overcome this problem, a mechanized automated approach effectively predicts lithology by using advanced ML algorithms [20]. Several well logs are the most efficient approach that has been widely used to identify subsurface lithology [25]. ML approaches have been widely employed to identify lithology, resulting in partial solutions for some problems to identify lithology with calibration of core observations precisely [22, 26]. The current study aims to outline the dominating lithology of the Hangu and Patala formations in the Kohat sub-basin, Pakistan.
Organic geochemistry studies (TOC, Rock-Eval [RE] pyrolysis, and vitrinite reflectance (Ro) are widely used to assess the true potential of the source rock as well as the quantity of organic matter (OM). The lab-measured geochemical parameters have challenges in that they are time-consuming and an expensive study. Another factor is the limited availability of core samples and discontinuous data set (normally acquired after 9 m), which poses challenges to accessing the source rock potential only based on core samples. To overcome these challenges, current research endeavors have addressed this issue by establishing correlations between geochemical parameters and conventional well log data. However, getting TOC and RE pyrolysis parameters poses a significant challenge for geoscientists, primarily due to the high costs and limited availability in new hydrocarbon provinces. Consequently, this issue has garnered considerable interest among researchers to get appropriate results through conventional well logging data. Therefore, various numerical approaches have been introduced to address this challenge based on conventional well logs [15, 27–30].
The most precise method for obtaining TOC values from organic-rich source rock involves laboratory measurement of cores/well cuttings samples. However, this technique only offers periodic sample analysis because the core data set is not obtained continuously, finding a way to convert continuous wireline log curves and predict missing values of core samples. Numerous approaches and techniques have been suggested to employ TOC estimation in the nonavailability of core data sets. Nonetheless, each numerical/deterministic method has its limitations in delivering accurate results and requires geochemical data validation to precisely predict TOC values [15, 31–34]. In cases where geochemical data are unavailable, conventional well logging data can serve as a valuable resource for source rock characterization.
Moreover, intelligent systems have harnessed well logging data to predict TOC values, employing ML techniques. Nonetheless, the precision and applicability of well logging data can vary depending on the specific geological settings and lithologies. Through ML, this research predicts TOC values for the Paleocene formations (Hangu and Patala) in Kohat sub-basin, Pakistan. It leverages geochemical RE pyrolysis data, mathematical models, and ML approaches. The prime objectives of the current research are (1) to automate the process of identifying lithology from well logging data, an ML approach that has been used in the current study; (2) find out the TOC from conventional well logs and correlate them with well core/cuttings samples; (3) perform geochemical analysis to access the source rock potential of Hangu and Patala formations; and (4) carry out petrography for finding dominant maceral on Paleocene strata. Geochemical analysis for source rock evaluation was performed on core/well cutting samples and estimation of TOC using conventional well logs. Hence, a multiple analysis was carried out to formulate the calculation for TOC, and the high correlation between the ∆logR method and the actual measurement underscores this approach’s robust applicability, reliability, and straightforwardness, rendering it suitable for application in the study area. This study provides clues of maceral kinds present in Paleocene formations to assess the hydrocarbon generation potential of the target formations. Moreover, the current research is also helpful in better understanding the potential for producing hydrocarbons by geochemically analyzing the Paleocene formations (Hangu and Patala) in Kohat sub-basin, Pakistan.
2. Description of the Study Area
The current study was performed on the Kohat sub-basin, Upper Indus Basin of Pakistan. X-01 and X-02 wells were selected for interpretation based on wireline log data to predict lithology and well cutting samples of X-01 as shown in Figure 1. The Main Boundary Thrust (MBT) is the northern region; the undeformed Bannu Depression and Trans Indus Ranges are the southern region of the Kohat sub-basin. Strike–slip Kalabagh Fault divides Salt Range Thrust from Surghar Range Thrust. The western part is Kurram-Parachinar Range, and the eastern boundary is the River Indus in Kohat sub-basin [36]. This basin is a complicated, hybrid territory including strike–slip faults and compressional features [37].
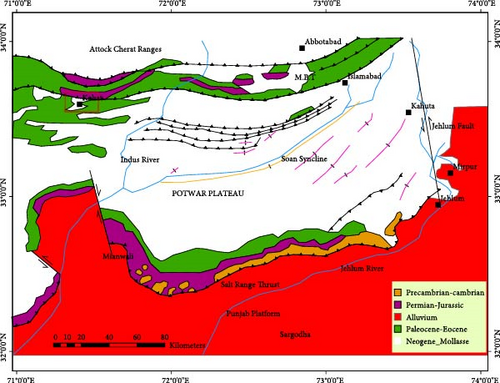
The Kohat sub-basin is a tertiary Foreland Basin in the lower Himalayas. According to Ullah et al. [38], the sub-basin was developed by colliding with Indian and Asian plates. On the northern side, it has MBT, on the west Kurram fault; on the South Trans Indus Salt Ranges Thrust and the east part, it contains Indus River [39] as shown in Figure 1. Eocene shale shows separation in the study region. Paracha [40] states that duplex structures have also been documented in the study area. Asymmetrical structures in the Kohat area appear more prominent and scratched than the competent set (under Eocene). Because of rotating activity, the northern side of Kohat has distorted and tight structures compared to the southern side. The whole Potwar–Kohat area is riddled with imbricate wrench faults, which are steeper in the Kohat region than in the Potwar region.
In comparison to the western section of the Kohat Plateau, the eastern half of the Kohat Formation has a duplex structure, and this area is tectonically less damaged. More damage to the Chorgali Formation (Lower Eocene) in the western Kohat region, as well as wrench faults with high throws and dips, supports evidence of continental rotation (from southeast to northwest) [40].
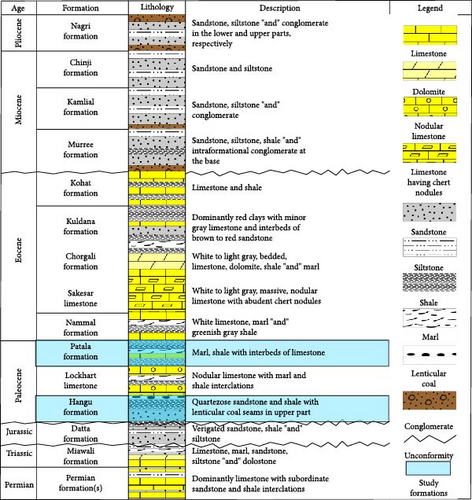
Evaporite, limestone, conglomerates, shale, and Paleocene–Eocene sandstones (0.5–2.0 km thick) make up the Paleogene rock sequence. Wide fluctuations of 150–2000 m from east to west demonstrate the active tectonism in this intermediate unit. Jatta Gypsum and Bahadar Khel Salt demonstrate early Eocene evaporite deposits in a confined basin and that salt acts as diapiric cores in several folds, assemblage the Kohat Plateau further complicated. This intermediate layer was topped by the Kohat Formation (very resistant), which was formed in open saltwater settings [41]. The Cambrian–Paleocene (third unit) sedimentary strata are more competent and are deposited on the northern Indian Plate edge. They are roughly 2 km thick. This bottom series is not visible on the Kohat plateau but may be found in the Trans Indus Salt Ranges [42, 43]. Despite reaching Triassic depths, the Chanda Deep-01 well does not rule out the presence of older formations in the Kohat Basin [44, 45]. Kohat Basin thrust mechanism deposits the Eocene evaporite sequence on Miocene molasse sediments. Figure 2 demonstrates the common formations that are parents in Kohat Basin [16].
3. Materials and Methodology
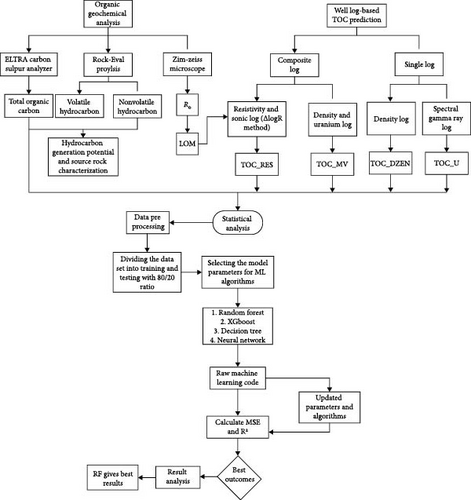
Various screening approaches were employed to access the source rock potential of a full set of well log data, and a total of 23 drill cuttings from Paleocene (Hangu and Patala) formations in X-01 were examined. Geochemical analyses were conducted on a total of 23 extracted from Paleocene source rocks, with 17 samples obtained from the Patala Formation and 6 from the Hangu Formation, and these samples were collected from one well. Well data was sourced from the Oil & Gas Development Company, Pakistan. The depth ranges of the well extend through the Patala Formation from 4140 to 4240 m and the Hangu Formation from 4480 to 4505 m. The well log datasets utilized in this study encompass standard well log tools such as natural gamma ray (GR), uranium (U), neutron, density, resistivity, and SP. The lab analysis was performed at the Hydrocarbon Development Institute of Pakistan (HDIP), Islamabad. The thermal maturity of the organic materials was evaluated using TOC, RE pyrolysis, and organic petrography. The standard procedure has been adopted for said analysis. Before conducting all geochemical analyses, the samples were thoroughly cleaned to ensure the removal of any potential contamination from drilling fluids. The detailed workflow adopted to predict TOC, and source rock evaluation is shown in Figure 3.
Leco’s CS-300 analyzer was used to quantify the TOC. Prior to TOC analysis, source rock samples underwent a four-step preparation, washing, drying, crushing, and acid treatment, for inorganic carbon removal. A quantity of CO2 that is proportionate to the TOC in a sample was found as a result of this method [46].
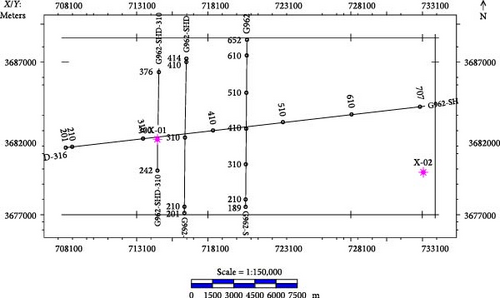
The process of seismic data interpretation is mapping time and depth contour maps and subsurface fault interpretation [47]. The exploration for oil and gas necessitates the generation of a structural map from 2D seismic reflection data, enabling the identification of potential hydrocarbon reservoirs [48]. The advancement of seismic exploration technology has led to increasingly refined seismic geological structure interpretation. The accuracy of traditional geological structure interpretation has been compromised mainly when relying solely on individual seismic data [20]. Seismic interpretation transforms seismic reflection data into structural and stratigraphic pictures by generating time and depth surfaces by applying suitable velocities. This interpretation’s main aim is to mark Patala and Hangu formations horizon. The seismic structural interpretation was carried out to find the structure in the study area, and different structural units were marked based on acoustic impedance contrast. Structural interpretation includes the study of reflection geometry, and this analysis helps in the demarcation of subsurface structures where hydrocarbon gets concealed after migration from the source rock. In seismic data interpretation, the first step was the generation of the base map, which helps to know the orientation of the base map. In this research, the 2D data set was utilized with one strike line and four dip lines. The line’s detail and orientation are demonstrated in Table 1, and Figure 4 represents the base map along with the X-01 well location.
| Name | Seismic line | Orientation |
|---|---|---|
| G962-SHD-309 | Dip line | N–S |
| G962-SHD-316 | Dip line | N–S |
| G962-SHD-311 | Dip line | N–S |
| G962-SHD-313 | Dip line | N–S |
| G962-SHD-316 | Strike line | E–W |
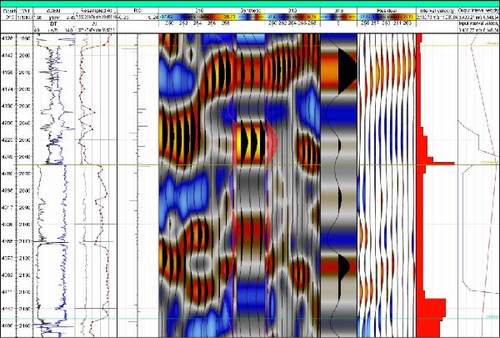
Generating a synthetic seismogram is a forward modeling technique to predict the seismic response. Well log data of X-01 is used as it has been drilled at SP No. 330 of strike line 962-SHD-316. Synthetic seismograms are made using density and sonic logs to calculate acoustic impedance contrast. Synthetic helps correlate formation tops in the depth domain and seismic in the time domain. The density value and sonic log were multiplied, resulting in the calculation of acoustic impedance and the reflectivity series estimation. This reflectivity series was convolved with the wavelet extracted from seismic line 962-SHD-316, which is close to the X-01 well for generating a synthetic seismogram. Figure 5 shows the synthetic seismogram of the X-01 well.
Well log data include commonly used petrophysical logs: GR, sonic (DT), deep resistivity (RD), shallow resistivity (RS), micro spherical log (MSFL), density (ZDEN), neutron porosity (CNC), and U. Table 2 presents a statistical dataset analysis, defining key parameters that indicate the model’s applicability. Table 2 explains the descriptive statistics (e.g., count, mean, standard deviation, minimum, and maximum values) for well logs. The statistical analysis provides insight into the input and parameters used in the current study. The dataset was split into 80% for training and 20% for testing.
| Well logs | Count | Mean | Std | Min | Max |
|---|---|---|---|---|---|
| DZEN | 11,459 | 2.65 | 0.12 | 1.67 | 2.99 |
| DT | 11,459 | 62.58 | 11.94 | 47.42 | 102.85 |
| GR | 11,459 | 53.79 | 29.97 | 10.42 | 181.63 |
| RD | 11,459 | 2708.76 | 7844.66 | 2.44 | 39,198.51 |
| MSFL | 11,459 | 46.18 | 107.73 | 0.14 | 2000 |
| CNC | 11,459 | 0.09 | 0.094 | 0.0089 | 0.52 |
| U | 11,459 | 0.53 | 0.52 | 2.28 | 3.57 |
3.1. Lithology Prediction Through ML
A decision tree (DT) is a type of supervised learning technique that is commonly used for addressing classification issues, as well as regression assignments. The classifier is represented as a tree structure, with internal nodes representing features of the dataset, branches representing decision rules, and each leaf node indicating an outcome [49–51]. There are two distinct categories of nodes in the DT structure: decision nodes, which make decisions involving numerous branches, and leaf nodes, which represent the results without any extra branches. The characteristics of the dataset influence the process of making decisions or conducting tests [52].
One of the significant tools of ML is prediction. ML was used to predict the result on the blind well. Different types of indicated algorithms were used, and every algorithm had its own specification and accuracy. On the given data set, the lithology was predicated on the blind well. In the current research, two well log data were used. One well was X-01, and the other one was X-02. X-01 well was utilized for training data sets for the lithology prediction, and X-02 well was used for testing well for lithology prediction. This study adopts a DT classifier ML model that was trained using the lithology dataset of the Patala and Hangu formations for the X-01 well to make lithology predictions. This was demonstrated by the model’s overall accuracy, 73.20% and 84% for Patala and Hangu formations, respectively.
3.2. TOC Through Well Logging
Precisely predicting TOC values from well logs data is crucial and given the impracticality of conducting direct measurements from core/well cutting samples in numerous wells. The various methods devised over recent decades rely on correlations, numerical relationships, and easily verifiable TOC predictions [34]. This study applied different methods to estimate TOC and assess its viability, a promising correlation with core measured values. The methodology was applied to one well’s publicly available well log data to evaluate the Paleocene (Hangu and Patala formations) hydrocarbon source potential.
3.3. TOC Through ML
Chen and Guestrin [57] introduced XGB trees, a scalable tree boosting method that enhances the gradient boosting DT framework. Tree boosting is a widely used and highly effective ML technique. XGB employs classification and regression trees (CARTs) to train on data by minimizing an objective function.
3.4. RE Pyrolysis and Organic Petrography
RE pyrolysis is the most effective tool that can measure essential geochemical parameters during the source rock geochemical assessment procedure that obtain geochemical parameters which are further used to derive parameters and is the most often used method to access source rock generation potential. The highest pyrolysis yield temperature, S1, S2, S3, hydrogen index (HI), oxygen index (OI), and other parameters were obtained from the RE pyrolysis [58–60]. The conventional well log data set are being considered an alternate solution that might be used to estimate the TOC values of the source rock in the absence of a well cutting/core sample [3]. The utilization of traditional well logs for the rapid evaluation of the TOC content of the source rock is a valuable technique that facilitates the identification of organic richness [61].
Globally, the petroleum industry employs RE pyrolysis to quantify, assess the quality, and determine the thermal maturity of organic materials in rock samples. When used in conjunction with TOC measurements, this screening method is the fastest and most cost-efficient for screening many samples [62, 63]. Plotting RE pyrolsate (S2) yield versus TOC yield offers information on the kinds of insoluble OM, as well as the HI [64, 65]. In the current study, only 12 selected samples of the target formations were analyzed using the MCS CCD Z1M Zeiss microscope at a laboratory. The proper quantity of crushed sample, measuring between 0.8 and 0.2 mm, was mounted with Araldite and then allowed to dry so that it might solidify.
4. Results and Discussions
4.1. Structure Interpretation
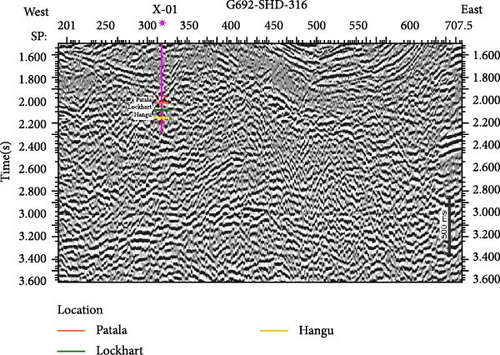
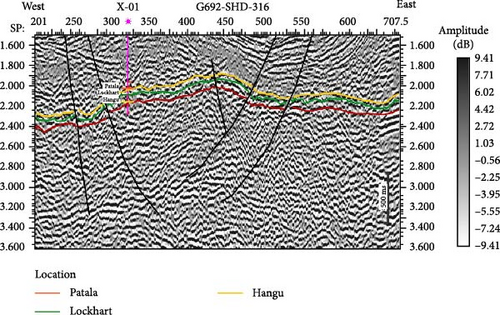
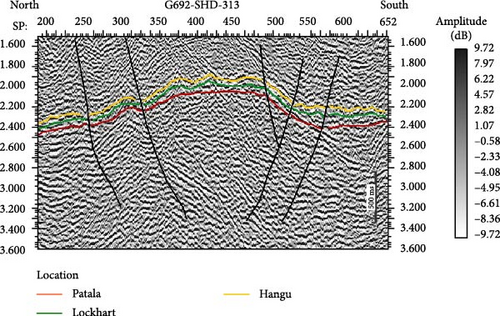
Patala and Hangu formations are marked based on a synthetic seismogram on the dip line G962-SHD-316. The marked horizons are then ultimately shifted to the intersecting strike line and thus traced on the other dip lines. During this procedure, small misties are witnessed and corrected. Patala Formation comprises shales and sandstone, so its reflections are improper. For identifying Hangu, firstly, underlying strong reflections of Lockhart are marked because of prominent acoustic impedance contrast. This facilitated the picking of the Hangu reflector on available seismic lines.
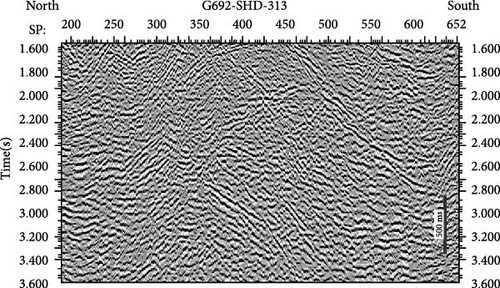
The study field is in an extensively compressional regime dominated by thrust faults. The major structures formed are fault bend folds. Faults are marked on the seismic section based on disturbance in seismic behavior. Most of the marked faults are trending in the NW–SE direction. Faults are evident on the dip lines as most are north–south (NS) trending (invisible on strike lines). Seismic sections of lines G962-SHD-316 (Figure 6) and G962-SHD-313 (Figure 7) are marked with Hangu, Lockhart, and Patala horizons and faults.
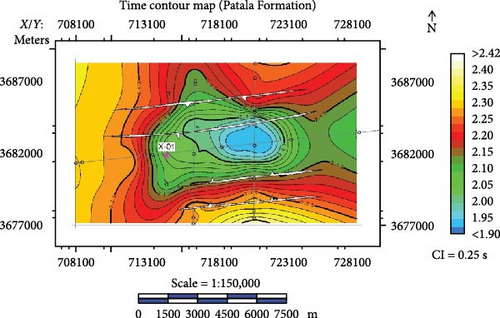
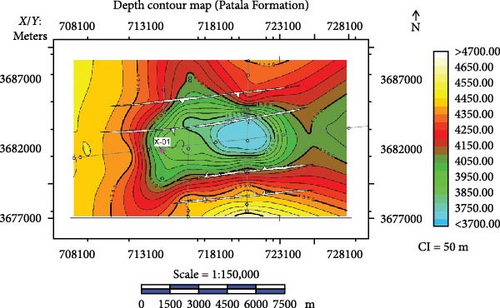
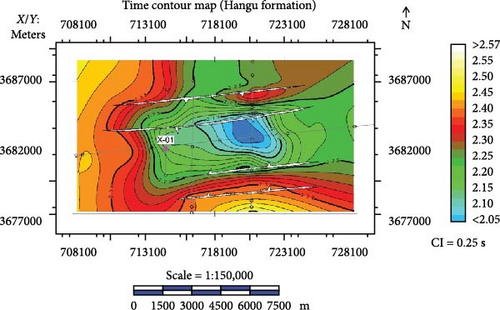
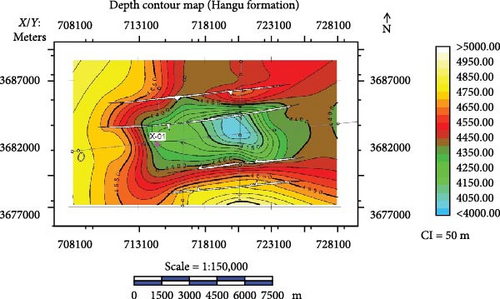
Both time and depth contour maps were yielded for the Patala and Hangu formations to conform to their exact subsurface levels (Figures 8 and 9). The time and depth contour maps are generated at the contour interval of 0.25 s, and the depth contour map is generated at the interval of 50 m. The faults are present in black color, which demonstrates the structure that is present in the subsurface. Figure 8a shows the TWT contour map, and Figure 8b shows the depth contour map of the Patala Formation. Figure 9a shows the TWT contour map, and Figure 9b shows the depth contour map of the Hangu Formation.
4.2. Lithology Identifications
Various previous studies have examined lithofacies and investigated how lithofacies affect diagenesis and reservoir heterogeneity in shale gas plays. Due to its complex diagenesis, rapid lithofacies, and reservoir quality variation, unconventional resource plays make studying lithofacies for diagenesis control more difficult and important [66]. Shale reservoirs exhibit variations in reservoir quality (petrophysical and geomechanical properties) due to variability in their mineral and OM compositions, diverse lithofacies, and sedimentary–diagenetic environment. The reservoir quality of shale directly influences shale gas extraction and development activities. So, the classification of shale lithofacies types and the identification of the optimal shale lithofacies with the highest reservoir quality are for targeting the “sweetspots” [11, 67, 68].
Li et al. [69] conducted a detailed study on lithofacies and organofacies of marine and lacustrine shale (organic-rich matter) and found that a robust association exists between lithofacies and organofacies in the sedimentary rocks. Lithofacies and organofacies play significant roles in unconventional petroleum exploration. The heterogeneity in lithofacies affects the identification of “sweetspots” in shale plays as distinct lithofacies most probably align with varying organofacies. The differences in thermal maturity of organofacies influence the variations in hydrocarbon occurrence states and pose a significant challenge to the identification of sweetspots. Jin et al. [70] performed a comprehensive study on the classification of shale oil reservoirs in China. The shale can be classified as shale oil reservoirs based on its sedimentary structure.
The standard practice to precisely identify lithology and describe reservoir characteristics is from well core observations. However, the limited availability of core samples poses significant challenges for geoscientists precluding a thorough characterization of lithologies. Therefore, well log data are quite beneficial as it provides continuity and ease of acquisition to determine different parameters [71]. Identification of different lithologies from well log data might be difficult due to the presence of a variety of minerals. Additionally, the well log data may be influenced by several geological and drilling conditions [72]. To overcome these issues related to lithology identification, artificial intelligence-based approaches have been employed to improve accuracy as well as efficiency [73].
At present, the rapid development of ML approaches could aid in getting rigorous assessment of lithologic characterization from well log data. These techniques can classify lithology in the absence of core data after being trained with the available core data. Lithology classification is utilized for depth measurement in model training by employing a combination of well log and core data. Main input logs for lithology identification include GR, CNC, RD, and ZDEN [74]. In the current study, these logs are utilized to predict the lithology of the Hangu Formation and Patala Formation by training the core data lithology on X-01, while the testing was performed on X-02 well.
In investigating lithological anomalies, cross-plots are pivotal tools for visually discerning potential hydrocarbon reservoirs through the graphical representation of interrelationships between various well log responses. In the context of the Patala and Hangu formations, four distinct cross-plots have been generated, each elucidating meaningful associations among different variables. These plots include the relationship between RD and density, GR and porosity, density and GR, and GR and RD. These cross-plots, commonly called z-plots, employ GR as the primary indicator variable, with lithological facies serving as the secondary indicator. Notably, the juxtaposition of GR and lithology in these plots underscores the utility of GR as a lithological indicator. Lithology delineations within each formation, particularly shale, marl, and limestone in the Patala Formation, and sandstone and shale in the Hangu Formation, are distinctly discernible as shown in Figures 10 and 11. This characterization is particularly salient in analyzing the X-02, widely regarded as a blind well.
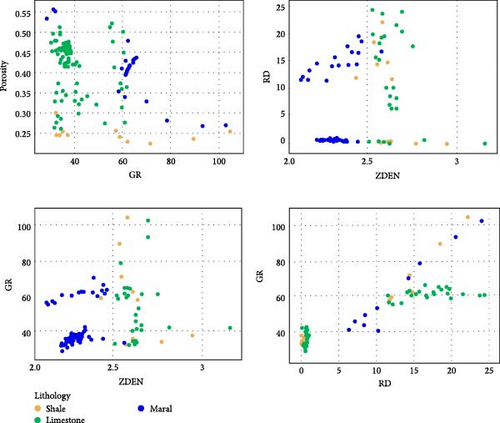
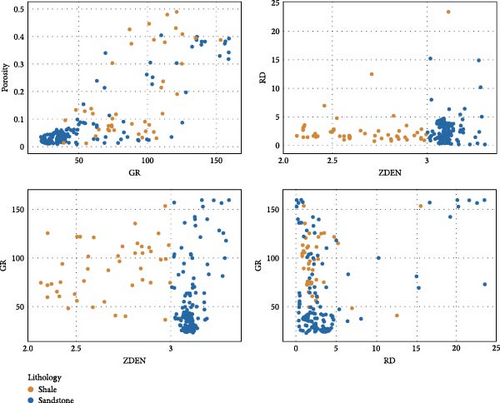
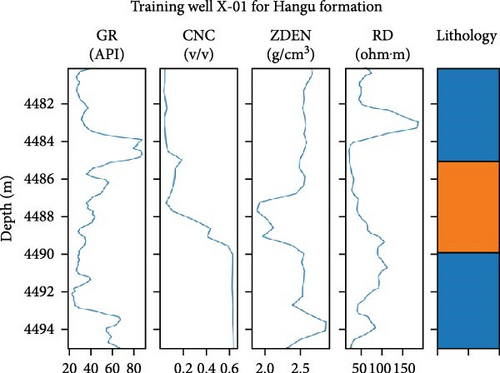
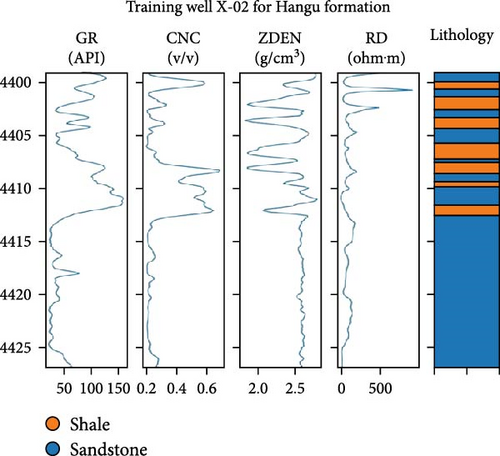
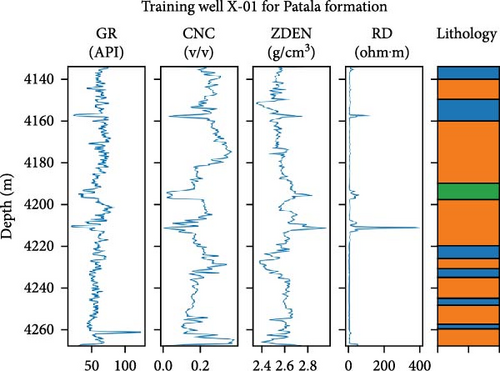
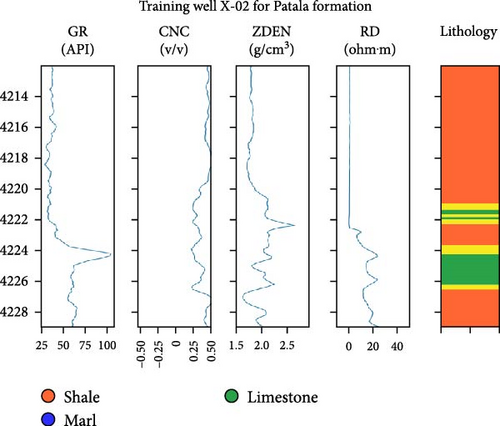
The lithology in the current study has been identified based on observations, descriptions of the core samples, and core pictures. The following are the lithology categories, (1) sandstone, (2) shale, (3) limestone, and (4) marl, which is visible in the Patala and Hangu formations that characterize this type of lithology. The dominant lithology observed in the Patala Formation is limestone, shale, and marl, and Hangu Formation; only sandstone and shale were encountered, as shown in Figure 12a,b. The result of the classifier report for both Patala and Hangu formations is shown in Figure 13a,b. The F1 score for the Patala Formation is 73.20%, and for the Hangu Formation, it is 84%, representing the good training of the data set. Figure 14a,b demonstrates the lithology of both testing and training well, showing the lithology prediction in X-02 on Hangu and Patala formations. The prediction of lithology in the Hangu Formation is reasonable compared to that of the Patala Formation.
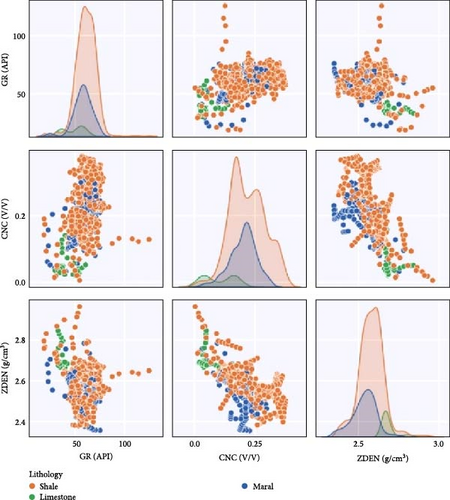
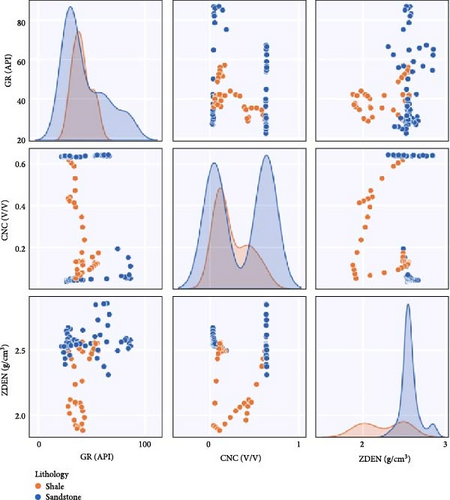

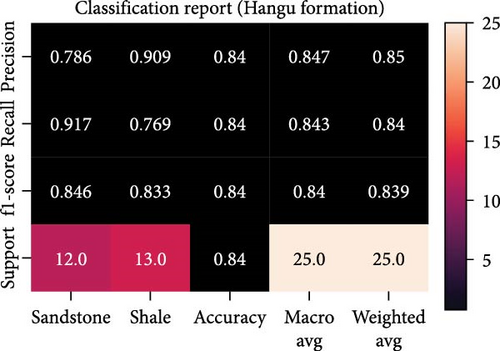
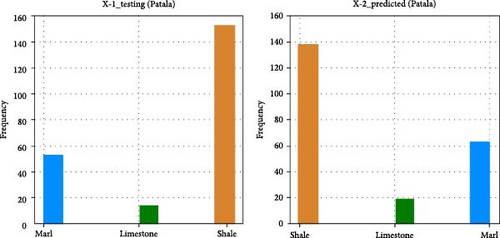
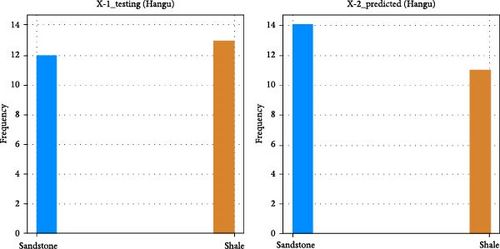
Figure 15a,b shows the training X-01 and testing X-02 well for the lithology prediction in the Hangu Formation. Four different log tracks are shown in the plot: the first track represents the GR log, the second track represents the neutron log, the third track represents the density log, the fourth demonstrates the RD, and the last track shows the lithology prediction. The prediction of lithology results in the Hangu Formation is better as compared to the Patala Formation because of the availability of a log curve. Figure 16a,b shows the training X-01 and testing X-02 well for the lithology prediction in the Patala Formation. The color in the lithology track shows the variation in the lithology.
4.3. TOC Through Well Cutting
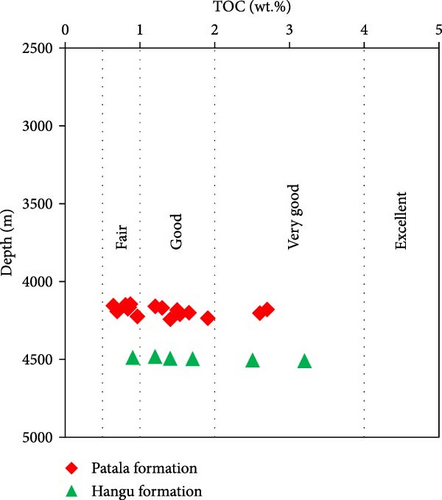
All samples’ X-01 well cuttings have a TOC ranging from 0.64 to 3.20 wt.% (Figure 17) which indicates fair to very good hydrocarbon potential. According to the classification of Bacon et al. [75], Hangu Formation TOC present values are in the fair to very good range. In comparison, the TOC values for Patala Formation are also fair to very good.
4.4. Wireline Log Analysis
The consistent availability of data over the whole zone of interest makes TOC estimates based on well logs quite common [76]. Figures 18 and 19 illustrate the computed TOC content in X-01 in Paleocene formations using the bulk density, GR, ΔlogR, and multivariant techniques. Figures 18 and 19 show that the observed TOC shown with a red color triangle and the predicted TOC shown in the curve with the help of well log data demonstrate the best fit matching in the log plot for Hangu and the Patala formations. The Hangu Formation has six observed sample data in which two points of TOC approximately match the log curve of TOC prediction, while in the case of Patala, the maximum points are tied with the log curve.
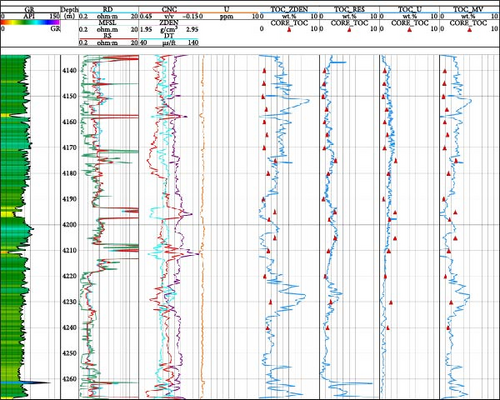
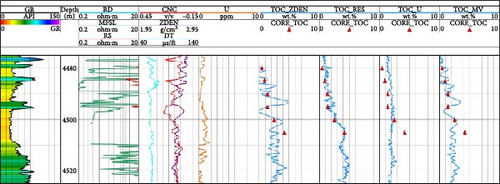
The TOC values estimated through conventional well logs normally differ from laboratory measures [77, 78]. The various well log data-based approaches, including single and composite logs methods, are routinely employed to estimate TOC values. As indicated in Table 3, the correlation between the observed TOC from well cuttings and the predicted TOC (based on the well logs) was assessed in the current study. Table 3 presents the detailed correlation between actual and predicted TOC for the Hangu and Patala formations. The correlation means that the formation Passey method gives the best results compared to other TOC prediction methods.
| Regression statistics | Density method | ΔlogR | Uranium log method | MV fitting method |
|---|---|---|---|---|
| Patala Formation | ||||
| Correlation coefficient (R) | 0.46 | 0.92 | 0.70 | 0.23 |
| Determination of coefficient (R2) | 0.21 | 0.85 | 0.49 | 0.05 |
| Standard deviation (%) | 0.93 | 0.42 | 0.50 | 0.68 |
| Mean squared error (%) | 0.06 | 0.04 | 0.07 | 0.05 |
| Root mean squared error (%) | 0.24 | 0.20 | 0.26 | 0.22 |
| Hangu Formation | ||||
| Correlation coefficient (R) | 0.50 | 0.96 | 0.87 | 0.89 |
| Determination of coefficient (R2) | 0.25 | 0.92 | 0.75 | 0.67 |
| Standard deviation (%) | 0.01 | 0.04 | 0.03 | 0.28 |
| Mean squared error (%) | 0.03 | 0.06 | 0.08 | 0.04 |
| Root mean squared error (%) | 0.17 | 0.24 | 0.28 | 0.20 |
4.5. TOC Through ML
The TOC content prediction using ML techniques helps a lot to overcome the deficiencies of the conventional quantitative regression approaches used to predict TOC content [58, 79, 80]. Several ML algorithms, including RF, NN, SVR, Bayesian regression, DT, and XGB, have been employed to predict TOC content for source rock characterization. In contrast to actual regression models, these algorithms can handle exceedingly complex relationships among independent and dependent variables to forecast unidentified values [56]. TOC content estimated from borehole data using ML method can immediately recognize unidentified relationships between the TOC features and the well logs [10, 23, 81]. ML approach is considered more accurate compared with old empirical regression techniques in estimating TOC content as it is more rigorous [79]. In this study, the effectiveness of RF, DT, XGB, and NN in TOC content forecasting is compared, and the potential of ML models in specific settings is also determined.
In petroleum systems, the prediction of TOC based on ML techniques is a relatively new research area. Various studies reveal that the use of ML approaches along with traditional mineralogical and geochemical techniques can sufficiently increase the precision of TOC predictions. Generally, ML techniques as compared to traditional statistical or deterministic models provide detailed information about the complicated relationships between TOC and other source rock properties [82]. The RF method provides the best results (R2 = 0.915) among the other ML models including SVR and XGB to predict the TOC in organic-rich shale reported in Sun et al. [56]. Khan et al. [83] also applied the same ML models to determine TOC values in shale play basins in Asia and North America and found the best results from the RF approach with a strong correlation (R2 = 0.85). Similar results were obtained to predict the TOC in Devonian Duvernay shale using RF, SVR, and DT methods, and the RF technique provided the optimum results with correlation coefficients (R) between 0.93 and 0.99 [84].
Shan et al. [85] employed a deep spatial–sequential graph convolutional network to predict the TOC with R2 = 0.87 in the Sichuan Basin. Nyakilla et al. [28] employed SVM and Gaussian process regression to predict the TOC and concluded that Gaussian process regression provides the best results with R2 = 0.95. In the present study, four ML models including RF, DT, XGB, and NN techniques were utilized to predict TOC content for Hangu and Patala formations. Subsequently, the results obtained from these models are validated by predicting unknown TOC content and compared to empirical regression methods, multiple linear regression, and ΔlogR. The ML algorithms can reduce the cost and improve the efficiency of laboratory testing in predicting the accuracy of TOC content among different forms and locations.
The research involved calculating correlation coefficients between all input parameters and core and log TOC output parameters. Figures 20 and 21 present pair plots, visually examining the correlations between input and output parameters. In Figure 20, the pair plot demonstrates the plot before removing the outlier or irrelevant data, and Figure 21 represents the pair plot before removing the outlier. It is necessary to remove the outlier for the betterment of results. These graphical representations offer insights into the relationships and trends among various input and output parameters. Some parameters exhibit strong interconnections, while others demonstrate a moderate level of correlation.
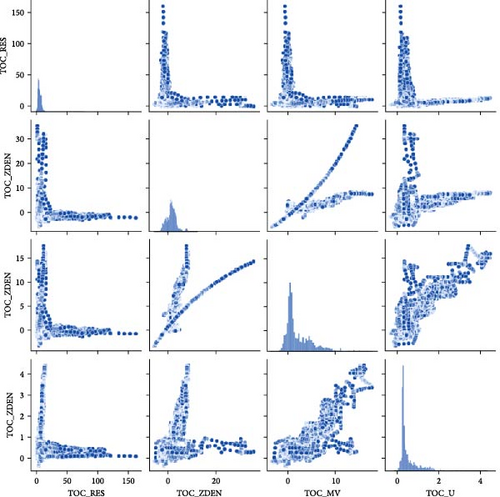
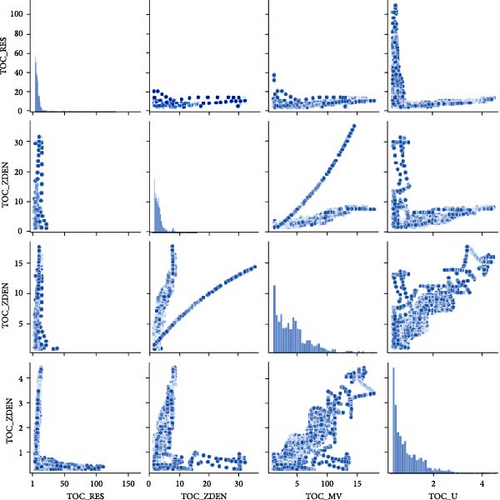
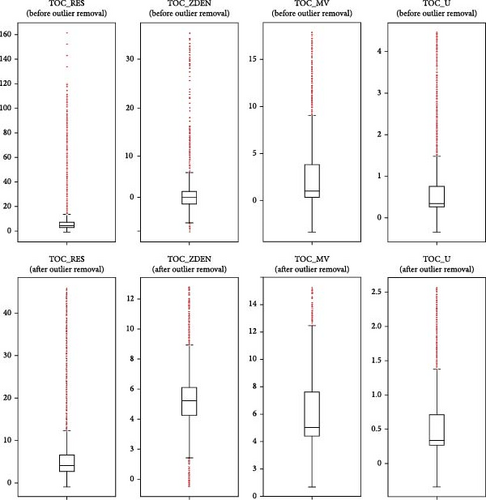
Figure 22 shows the box plot of the TOC estimated by the well log data before and after removing outliers. The primary rationale for outlier elimination is that outliers are exceptional values that differ significantly from the remaining data, hence distorting conclusions and complicating statistical investigations. The removal of outliers improves the reliability and precision of the results by limiting their influence. Outliers are removed from the Z-score treatment method, and this technique is applied to the calculated TOC by different methods, as shown in Figure 22.
A comprehensive performance evaluation was conducted to compare the efficacy of the four artificial intelligence algorithms employed in this study, namely, DT, RF, XGB, and NN. Figure 23 demonstrates the scatter plots illustrating the correlation of actual versus predicted TOC generated based on different algorithms during training data sets. Figure 24 represents the testing correlation of all the algorithms used in studies; blue color shows the original data set, and other colors demonstrate the predicted values. Based on the scatter plot, the XGB, DT, and RF score better than NN because NN data are more scattered than other data sets.
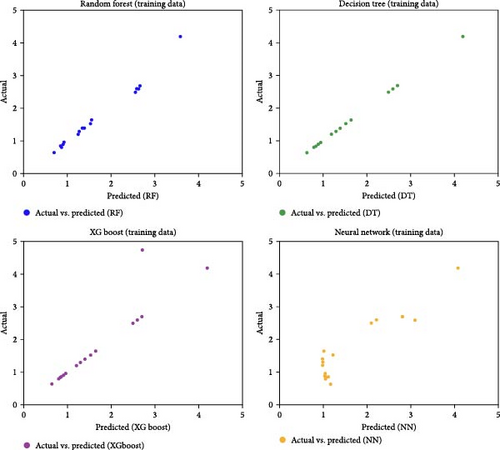
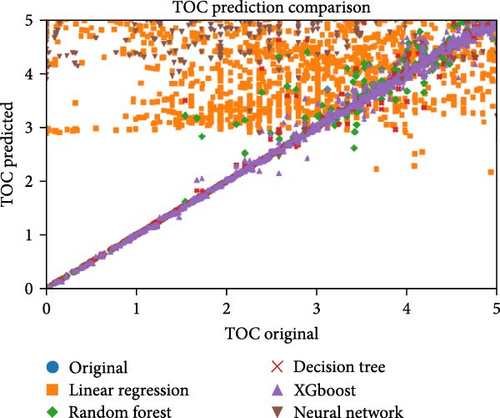
Table 4demonstrates that hyperparameter tuning is the procedure of modifying key variables for each kind of ML algorithm to get the highest accuracy for forecasting. The RF model variables, such as n estimators (the number of trees), max depth (the greatest depth for every tree), and min samples split (the smallest amount of data needed to separate a node), were modified to discover the best values. The choice to increase the tree effectiveness of the model was improved by modifying the max depth and min sample split. Hyperparameters in the XGB model, such as learning rate (step size shrinkage), n estimators, and max depth, were adjusted to balance learning speed and accuracy. To improve the learning abilities of the NN (MLP regressor), the hyperparameter’s hidden layer sizes (structure of the NN layers), activation (activation function for the neurons), and learning rate init (initial learning rate) were changed. The linear regression method did not necessitate hyperparameter adjustment because it employs a straightforward linear method. The optimum variables for every model were selected using grid search CV, and the model’s effectiveness was assessed using mean squared error (MSE). Table 5 represents the training and test results of different ML algorithms used in the current study. The algorithm XGB and DT give the best training, while the RF and XGB provide the best testing results.
| Model | Best parameters | MSE |
|---|---|---|
| Linear regression | N/A | 6.15568 |
| Random forest |
|
0.063288 |
| Decision tree |
|
0.118236 |
| XGBoost |
|
0.033846 |
| Neural network |
|
4.8269 |
| Algorithms | Training results | Testing result | ||||
|---|---|---|---|---|---|---|
| MAE | MSE | R2 score | MAE | MSE | R2 score | |
| Random forest | 0.07 | 0.03 | 0.97 | 0.15 | 0.04 | 0.89 |
| Decision tree | 0.00 | 0.00 | 1.00 | 0.17 | 0.05 | 0.84 |
| XGBoost | 0.00 | 0.90 | 0.99 | 0.17 | 0.04 | 0.86 |
| Convolutional neural network | 0.15 | 0.04 | 0.94 | 0.28 | 0.09 | 0.65 |
4.6. Kerogen Type and Its Microscopy Characteristics
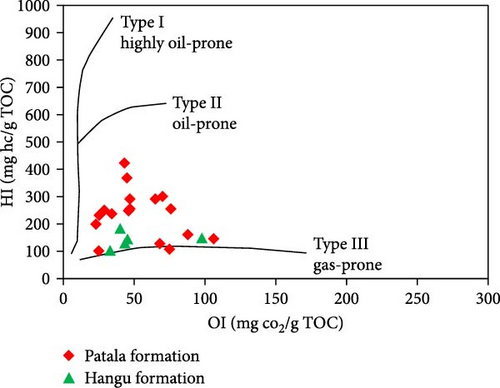
Various sorts of kerogen can yield different kinds of hydrocarbons. Type I kerogen, which integrates marine organic material; type II kerogen, which mostly generates gas but also produces oil; and type III kerogen, which produces gas in the majority, all result in the production of oil [86]. A cross-plot of the HI versus OI was used to find out the kind of kerogen using the Van Krevelen diagram. This cross-plot, which employs the atomic ratios of hydrogen, carbon, and oxygen, was created by Van Krevelen. Later, Tissot [87] used the HI and OI values instead of these atomic ratios.
Samples from Paleocene formations are given in an HI versus OI plot (Figure 25). All Paleocene Age formations’ kerogen types are depicted in the plot. Hangu Formation with an HI value of under 200 is classified as type III. Types II to III kerogen are the Patala Formation with HI values between less than 500.
The kerogen type known as vitrinite derives its composition from organic materials found on land. The amount of incident light returned from the polished surface of the sample is used in this procedure. Compared to the other macerals, the optical characteristics of the vitrinite maceral group alter more gradually as their grade advances. The sample’s thermal maturity is determined using this method. The geochemical changes in the macerals of vitrinite, which are positively correlated with the reflectance value, are also influenced by the geothermal history of the sedimentary basin [88]. Vitrinite reflectance reveals the stage of OM transformation and provides insight into the type of hydrocarbon the sample generated, as seen in Figure 26.
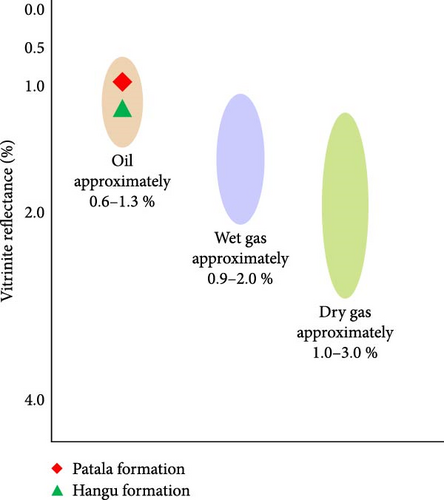
The Ro standards of 1.711%, 0.907%, and 0.589% were used to calibrate the microscope. The Hangu Formation, which belongs to the early mature oil phase category, has a vitrinite reflectance value of 0.78–0.90 (Table 6). The Patala Formation is similar in the oil window thermal maturity stage, according to its value; however, it is shallower than the other formation and has Ro values of 0.83–0.94. The Ro information demonstrates that all formations can generate oil.
| Sr. no | Pr-No. | Lab. No. | Depth (m) | Ro % | Formation |
|---|---|---|---|---|---|
| 1 | Pr-18741 | V-2141 | 4140 | 0.94 | Patala |
| 2 | Pr-18742 | V-2142 | 4160 | 0.83 | |
| 3 | Pr-18743 | V-2143 | 4170 | 0.92 | |
| 4 | Pr-18744 | V-2144 | 4180 | 0.85 | |
| 5 | Pr-18745 | V-2145 | 4198 | 0.86 | |
| 6 | Pr-18746 | V-2146 | 4210 | 0.93 | |
| 7 | Pr-18747 | V-2147 | 4240 | 0.89 | |
| 9 | Pr-18749 | V-2149 | 4480 | 0.78 | Hangu |
| 10 | Pr-18750 | V-2150 | 4490 | 0.88 | |
| 11 | Pr-18751 | V-2151 | 4500 | 0.88 | |
| 12 | Pr-18752 | V-2152 | 4513 | 0.90 | |
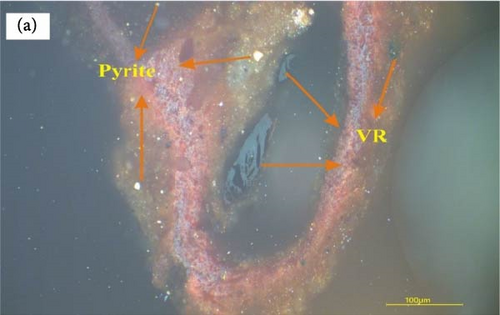
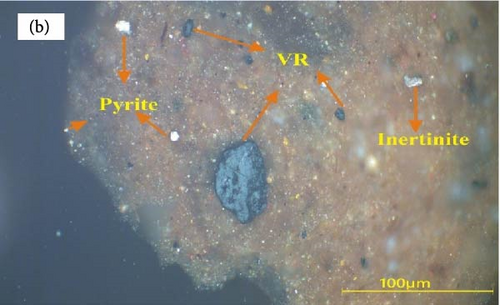
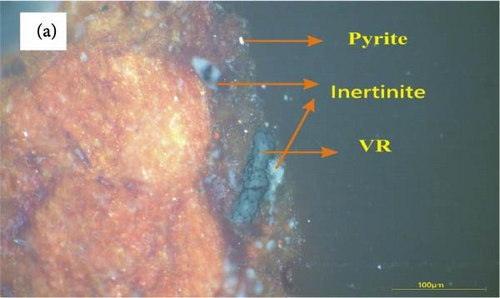
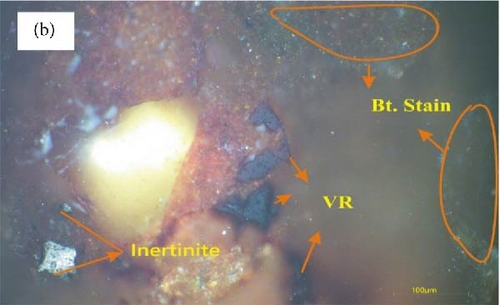
Several kerogen kinds were identified on polished samples, and a Zeiss microscope (MCS CCD Z1M) was used for white and fluorescent light analysis. According to a petrographic study, vitrinite is the primary maceral in Paleocene formations. The second principal maceral is inertinite, and the third maceral is solid bitumen. Pyrite is the main mineral in Paleocene formations. The Hangu and Patala formations are well-characterized by the presence of distinct maceral kinds, including pyrite, inertinite, and vitrinite (Figures 27 and 28).
4.7. Genetic Potential
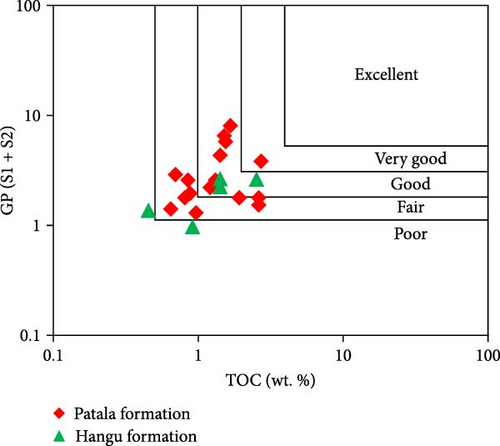
However, the kind of hydrocarbons formed during pyrolysis cannot be foreseen using this method [90]. The cross-plot TOC versus GP values were utilized to assess the source rock’s quality and its potential for hydrocarbon production in Paleocene formations. With the exception of a limited number of samples of Hangu and Patala formations, the GP of Hangu and Patala formations is fair to very good, as shown in Figure 29.
5. Conclusions
- •
Lithology has been identified through cross-plot analysis and ML, and it was concluded that shale, marl, and limestone are in the Patala Formation, and sandstone and shale are in the Hangu Formation.
- •
The research suggests the benefits of combining well log-based TOC estimates, lab-measured TOC, geochemical analysis techniques, and ML-based tools which results in a more accurate prediction of TOC and enhanced source rock assessment. It is inferred based on the analysis that the ∆logR method emerges as the reliable method of well logs using numerical models to estimate TOC values. This is evident in the higher R (exceed 0.92), as well as the RF method, which also exhibits higher R (0.94) between the predicted and measured TOC. It has been concluded that the outcomes derived from the conventional well log through ∆logR method and ML-based RF are most suitable to estimate TOC.
- •
The organic geochemical analysis of the Hangu and Patala formations revealed that the OM has fair to very good potential. Hangu and Patala formations exist in an oil window based on vitrinite reflectance results, and values range from 0.78% to 0.94%.
- •
van-Krevlen diagram, cross-plot HI versus OI, reveals Hangu and Patala formation kerogen type II (oil-prone) and type III (primarily gas-prone).
Conflicts of Interest
The authors declare no conflicts of interest.
Author Contributions
M.E. contributed to the primary conceptual framework, data interpretation, and manuscript writing; R.C. worked on seismic interpretation and technical details in manuscript writing; M.U.H.A. contributed to geochemistry and provided software assistance; J.U. performed the software assistance; and Z.N. and K.A. helped in TOC calculation and reviewed the final manuscript.
Funding
This research was funded by the Basic Science Centre Project of the National Natural Science Foundation of China, Grant Number 72088101.
Acknowledgments
The authors would like to express their utmost gratitude to the Directorate General of Petroleum Concession (DGPC) of Pakistan for providing the essential data required for this research. This research was funded by the Basic Science Centre Project of the National Natural Science Foundation of China, Grant Number 72088101. This research was also funded by the Researchers Supporting Project Number (RSP2025R351), King Saud University, Riyadh, Saudi Arabia. The authors would like to express their sincere gratitude to Dr. Samina Jahndad, the General Manager of Hydrocarbon Development Institute (HDIP), Islamabad, and Mr. Waqas Haider, Sedimentologist (HDIP), for their unusual assistance. Ultimately, the authors are thankful to the Pakistan Council of Scientific & Industrial Research (PCSIR) and the Higher Education Commission (HEC) of Pakistan for providing the funds to access scientific instruments. The authors express their gratitude to the Department of Earth and Environmental Sciences at Bahria University in Islamabad for their assistance in providing support and access to a geophysical software lab, which was instrumental in facilitating the execution of this study. The authors would also like to express their sincere thanks to GeoSoftware and LMK Resources for the provision of geoscience interpretation software, specifically GVERSE GeoGraphix.
Open Research
Data Availability Statement
The data that support the findings of this study are available from the corresponding author upon reasonable request.


