Modeling and Simulation: Investigation of Vapor-Liquid Equilibrium of CO2 Absorption in Aqueous Piperazine Solvent for Application in Biogas Upgradation Using ENRTL Model
Abstract
One of the primary objectives of biogas refinement is carbon dioxide (CO2) removal. Several studies investigated the effect of piperazine (PZ) in a mixture with other amines; however, its capability has rarely been investigated as a stand-alone absorbent. In this study, CO2 solubility equilibrium simulations are performed using the Aspen Plus (v7.3.2, AspenTech) simulation tool for the CO2/H2O and CO2/H2O/aqueous PZ component systems to predict the CO2 absorption rate and absorption capacity of the solvent. CO2 equilibrium partial pressures (up to120 kPa) were calculated using electrolyte non-random two liquid (ENRTL) model with a full explanation of crucial dissociation representing the complicated electrolyte system based on Henry’s Law. The ENRTL model was used to calculate the activity coefficients in the electrolyte system, while the dissociation and equilibrium constants were implemented as a function of temperature and or obtained from reference state free energy. Aspen Plus calculations from the ENRTL model showed excellent results having less than 4% deviation from the experimental results reported in the published literature. A selected range of 0.1–1.2 m PZ concentration and temperature between 298–343 K was used to estimate CO2 loadings using the simulations from the validated model. Various concentrations of aqueous PZ were then compared to benchmark solvent, that is, pressurized water for CO2 absorption loading. The observed result showed that CO2 absorption at PZ concentration of 0.5 m was 120% higher than the pressurized water solvent at the same temperature and partial pressure conditions. Additionally, the efficiency of CO2 removal obtained by using PZ was also observed to be higher than pressurized water scrubbing. In short, the obtained encouraging results portrays that PZ may be used as model solvent for CO2 absorption from biogas and to limit its effect toward global warming.
1. Introduction
The leading causes of greenhouse effect are the emissions of harmful gases and oxides of carbon (CO and CO2). The carbon dioxide (CO2) global emissions have reached 37 GtCO2e in 2023 rising 60% since 1990 according to EDGAR [1]. Therefore, clean and sustainable energy is an essential demand worldwide to secure environmental sustainability goals for the future [2]. Towards this goal, researchers are putting efforts to improve existing processes and develop new techniques to produce clean and sustainable energy. Substitution of fossil fuels with biofuels is one of the significant areas of research due to rising oil/gas prices and global warming. Biogas production from biomass and agricultural residues is a widespread and straightforward option for biofuel production, however, to obtain pure methane (CH4) and to limit CO2 in biogas is a primary challenge in biogas refining. The purified CH4 can be fed to the natural gas grid, utilized for the synthesis of chemicals, or used as vehicle fuel [3].
Several CH4/CO2 separation processes are available, such as adsorption, membrane separation, or absorption, etc. Struk et al. [4] reported that removing CO2 by chemical absorption was the most competitive among other available methods. Kapoor et al. [5] reported chemical absorption-based biogas up-gradation advantages: lower methane loss, high CO2 removal efficiency, and high biomethane quality. Several studies have related to the development of processes for removing CO2 from exhaust gases resulting from burning fossil fuels [6, 7]. Several solvents such as amine-based, organic, and inorganic, are used to remove CO2 during pre or post-combustion. Commercially, the most important solvent used in the absorption of CO2 on a large scale is the monoethanolamine (MEA) or comparable amines [7]. However, these solvents are not economically feasible for CO2 removal in small-scale biogas facilities. Therefore, other solvents have been suggested, for example, pressurized water and or cold potassium carbonate solution. Unfortunately, potassium carbonate has a low CO2 absorption rate at low temperatures; however, the rate of absorption can be enhanced by an activator [2]. Several promoters, such as, ammonia, MEA, and diethanolamine (DEA) have been studied to investigate their capability to increase the absorption rate of CO2. However, researchers are still working on characterizing the absorption capacity, solubility, and amine volatility of these solvents. Recently piperazine (PZ) has been suggested as a potential effective promoter for enhancing the CO2 absorption [8]. PZ is a cyclic diamine reacting with CO2 twice, forming carbamate and di-carbamate. Several studies investigated the effect of PZ on the solubility of CO2 for mixtures with other amines like methyldiethanolamine (MDEA) [9, 10]. The effect of PZ on MDEA, was reported to cause a low heat of reaction making regeneration energy-efficient [11, 12]. PZ and MDEA blend was also investigated by Bishnoi and Rochelle [13], and Dang [14], the rate constant was found to be greater than MEA. Further, PZ was also studied as an effective promoter with a blend of potassium carbonate and was reported to enhance CO2 absorption rates [2, 6]. Pashei et al. [15] evaluated and studied the optimization of CO2 absorption for the PZ–H2O–CO2 system, reporting a CO2 removal efficiency of 97.9% and a loading of 0.25 mol/mol with an absorption rate of 3.12 g/min. According to Kadam and Panwar [16], PZ can be used as an activator because it rapidly forms carbonates with CO2 while Stephanie et al. [17] demonstrated the absorption rate of CO2 using PZ is more than double that of 7 m MEA due to the presence of primary and secondary amines. More than 90% efficiencies and CO2 purity of more than 99% were reported by Baena-Moreno et al. [18] using MEA or PZ in chemical scrubbing. Akinpelumi et al. [19] studied PZ and its aerosol mitigation during absorption with less than 1 ppm PZ emissions. Borhani et al. [20] presented a model for a mixture of PZ and potassium carbonate in a packed bed column. The authors reported that increased resistance to thermal degradation and oxidation are the additional benefits for using PZ with MDEA. Privalova et al. [21] reported that the efficiency of CO2 removal could be increased by up to 30% by adding PZ in small concentrations. To summarize, this is obvious that PZ has mostly been studied as an activator and blended with a solvent of high capacity; however, it has rarely been studied as a stand-alone absorbent. Furthermore, numerous researchers worked on the removal of CO2 from natural gas, but this work focuses on investigating PZ as solvent for removing CO2 during small scale biogas upgradation. Moreover, PZ has not been explored previously to assess its potential as a stand-alone absorbent for its comparison with an industrial standard, for example, pressurized water scrubbing.
Different concentrations of aqueous PZ solutions may be useful to simulate for evaluating biogas upgradation performance under viable representation of dynamic equilibria. For model development, proper representation of equilibrium is necessary to know the influence on absorption capacity. Before development and design of a dedicated absorption-desorption cycle for small scale biogas upgradation, in a first step, equilibrium studies are performed in this work to investigate the solubility of CO2 in PZ. Based on previous experimental investigations and available literature data, simulation studies are presented using commercial simulation environment Aspen Plus software at equilibrium conditions in this work. A comparative simulation study of PZ solvent to that of a benchmark process was performed to evaluate it as a potential alternative, in terms of its capacity and performance. The results are promising, suggesting the use of PZ as a potential solvent for CO2 absorption.
2. Material and Methods
2.1. Aqueous PZ Solvent
PZ is an organic compound with a cyclohexane basis consisting of two nitrogen atoms at opposite ends in the ring (see Figure 1), also known by the names hexahydropyrazine, piperazidine, or diethylenediamine. A broad class of chemical compounds of piperazine (PZs) exists, which contain a core PZ functional group, and many have important pharmacological properties.
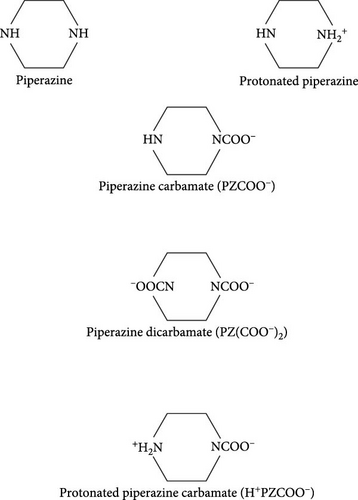
PZ has been explored as a promoter with potassium carbonate under various concentrations of 0.1–4 molal solutions by Cullinane and Rochelle [2], Chen [22], Oexmann and Kather [7], Oexmann et al. [23], and Hilliard [6]. The German based company, BASF A.G., has used PZ commercially as a promoter blended with MDEA to sweeten the natural gas. PZ is a cyclic diamine has a boiling point of 146°C–148°C and a molecular weight of 86.14 g/mol. It has a saline taste, and an amine odor and exists as small alkaline deliquescent crystals. It is hygroscopic in nature and freely soluble in ethylene glycol and water. Its solubility in water at 20°C is 15 g/100 mL and has a melting point of 106°C. It is a weak base that has two Pkb values of 9.73 and 5.35 at 25°C. A 10% aqueous solution of PZ has a pH value between 10.8 and 11.8, has high absorptivity for carbon dioxide and water, and absorbs them readily from the air. Many PZ derivatives occur naturally as illustrated in Figure 1, however, PZ can also be synthesized by a reaction of 1,2-dichloroethane and alcoholic ammonia, by reducing pyrazine with sodium in ethanol, or by the action of ethylene glycol and sodium on ethylene diamine hydrochloride [24]. Commercially PZ is produced as a coproduct from ammoniation of ethanolamine or 1,2-dichloroethane. From the product stream, it is separated which contains diethylenetriamine, ethylenediamine, and other cyclic and linear chemicals of this type. Commercially available PZ is as hexahydrate, C4H10N2 · 6H2O, its applications include use in the manufacture of resins, pesticides, plastics, and other industrial materials [24]. A widespread application has been found for adding primary or secondary amine to tertiary amine in absorbing CO2 from the process gas [2, 6, 22, 23]. Therefore, a high absorption rate is seen during absorption, and low regeneration heat is required in the regeneration unit/stripper if a small amount of primary or secondary amine is added [25, 26].
Equilibrium reactions of aqueous PZ with CO2 have been described by Bougie and Iliuta [28], Derks et al. [29], and Hilliard [6]. The electrolyte system is represented by the following equilibrium reactions [30].
2.2. Model Development
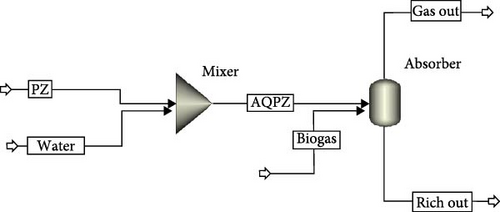
Therefore, the system satisfies the condition of thermodynamic equilibrium when the Gibbs free energy derivative at constant pressure and temperature reaches a minimum for a closed homogeneous system. The model from the example [30] described the dissociation chemistry of PZ quite accurately. Henry’s law was the basis for the equilibrium calculation of CO2 solubility. The complicated electrolyte system is described by crucial dissociation reactions in the model. Dissociation and equilibrium constants are described as a temperature function or obtained from reference state free energy [30]. ENRTL model calculated activity coefficients in the electrolyte system. Specific parameters are adjusted to preset values using design specs without influencing other settings. To avoid the effects of condensation and evaporation, concentrations were maintained constant, and to calculate loading on specific partial pressure, partial pressure of CO2 was kept constant. A flash column was used to calculate the vapor–liquid phase equilibrium (Figure 2). The apparent component approach was used for the models. The specific parameters like temperature, partial pressure, and solvent concentration were adjusted to defined values without affecting other settings to maintain equilibrium conditions. The temperature was kept constant to prevent system effects owing to the heat of absorption and heat of evaporation. Concentration also needed to be kept constant to avoid the effects caused by condensation and evaporation. The model was modified to include design specifications to ensure a constant concentration of PZ. Additional water, solvent, or nitrogen streams were added to maintain a constant concentration of PZ. In addition, design specifications were added to maintain a constant partial pressure of CO2 in the system. Depending on the requirements, the total pressure of the column or nitrogen stream flowrate variable/s were chosen to either maintain or achieve a certain partial pressure of CO2. CO2 loadings were obtained by analyzing concentrations of CO2 in the liquid stream. The partial pressure of CO2 was varied at a constant temperature to calculate CO2 loading in aqueous PZ for a specific solvent concentration. Moreover, the temperature was varied at constant pressure to observe the effect on CO2 loading for a particular solvent concentration. This procedure was repeated for each concentration of solvent. Salt formation and precipitation were not considered in the development of this model. Convergence of the simulation model was the main issue at lower partial pressures of CO2. This needed to be handled carefully, adjusting variables range, number of iterations, and convergence methods. The secant method was used as a default convergence method as the model included design specs.
2.2.1. H2O–CO2 System
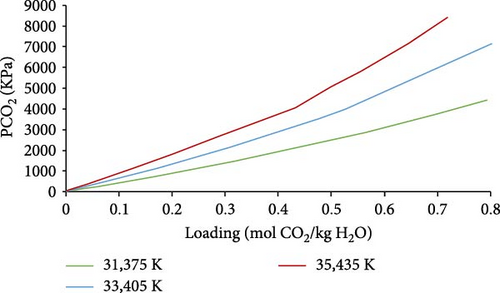
Aspen Plus calculations were done for the H2O–CO2 system to report the CO2 solubility calculations at different temperatures of 313.75, 334.05, and 354.35 K to varying temperatures.
2.2.2. PZ–H2O–CO2 System
Equilibrium reactions of PZ with CO2 can be described by the mechanism already described in Equations (1)–(8) [30].
2.3. Model Validation
The developed model for combined solvent was validated for PZ solvent by comparing calculations with literature at different partial pressures of CO2. Literature data reported by Derks et al. [29] and Bishnoi and Rochelle [13] were selected for Aspen Plus model validation. Graphical comparisons were made for (a) various temperatures versus fixed concentrations of aqueous PZ solution and (b) various concentrations versus fixed temperatures.
2.4. Speciation
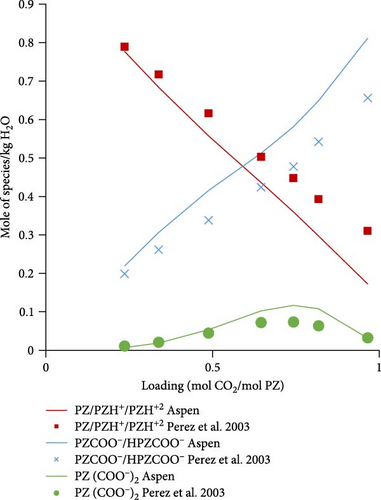
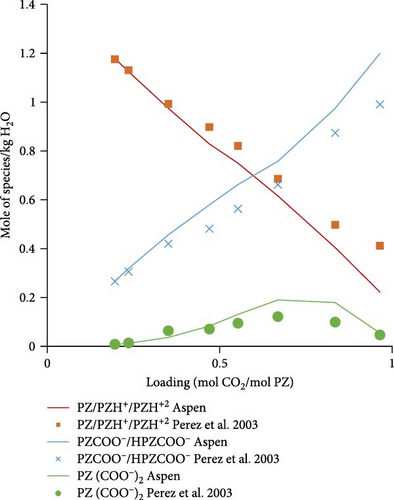
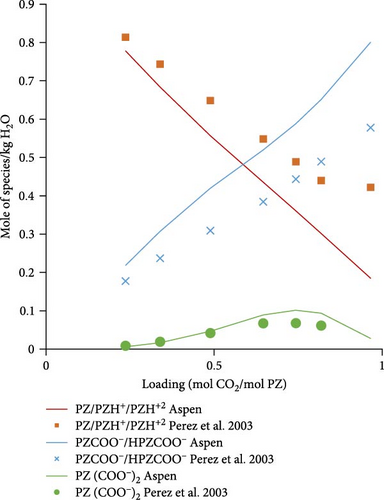
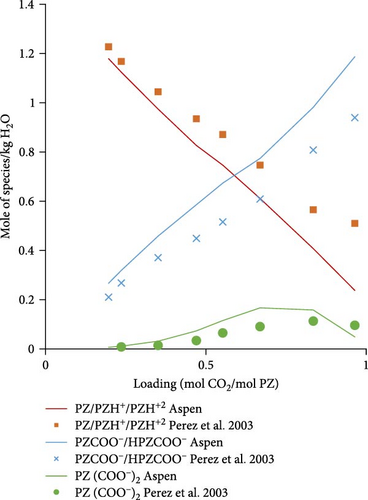
Speciation was done to better understand and analyze the electrolyte system. This would give us the extent of dissociation of salt and CO2 in water in balancing the system. Speciation calculations on Aspen Plus were made using the true component approach. The design specs were thus modified, and PZ and water concentrations were defined as the sum of species. A design spec was also created to obtain loadings by varying partial pressure and keeping the temperature and concentration of PZ constant. Moles of species are given on the y-axis after being normalized per kilogram of water in the following graphs. Loadings are presented as moles of CO2 absorbed per mole of PZ in the rich solution to compare the calculated data with literature from Ermatchkov et al. [34].
2.5. Comparison of Results With Benchmark Solvent
Once the model was validated and used for speciation studies, the potential of PZ was compared with an established solvent used for CO2 removal from biogas, that is, a pressurized water absorption system due to its cost-efficiency [35]. PZ aqueous solvent results were compared with the benchmark optimum water absorption system [36–45] at 313.75 K temperature and 13.3–1486 kPa partial pressure of CO2. The partial pressure range was chosen in the range usually used for pressurized water scrubbing of biogas. A comparison of CO2 loading in PZ versus water was made and reported in the results section.
3. Results
3.1. H2O–CO2 System Simulations
The simulations were performed on the validated model described by Equations (1)–(3) based on data from the literature [36–46]. The results of H2O–CO2 system simulations are shown in Figure 3, in which we can observe the effect of temperature rise on CO2 loading. Higher loading was obtained at low CO2 partial pressure for low temperatures. Nearly linear behavior of equilibrium loading with a varying partial pressure of CO2 was observed (Figure 3).
3.2. PZ–H2O–CO2 System
3.2.1. CO2 Solubility Model Validation
The Aspen Plus model developed for the system PZ–H2O–CO2 described by the Equations (1)–(8) was validated with literature data. In Figure 4a,b, the results are shown for 0.6 and 0.2 molal aqueous PZ solution at different temperatures. Literature data from Derks et al. [29] and Bishnoi and Rochelle [13] match calculated data from Aspen calculations except for a few outliers which might be due to experimental errors. At very low partial pressures of CO2, the deviation can be observed, for example, at 0.063 and 0.13 kPa. That might be due to convergence problems caused during calculations at very low partial pressures. When the partial pressure of CO2 is not very low, it can be observed that literature data matches better with Aspen Plus calculations at low partial pressures. In addition, the effects of temperature on loading was examined. The lower the temperature, the higher the loading of CO2 in rich solution at any given partial pressure of CO2 in the vapor phase. Figure 4a illustrates that CO2 stoichiometric loading of around 1 can be achieved at partial pressures of CO2 lower than 100 kPa.
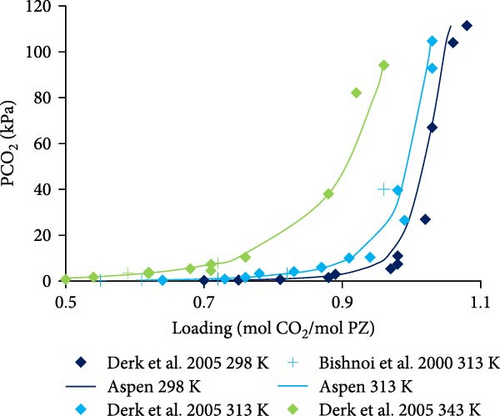
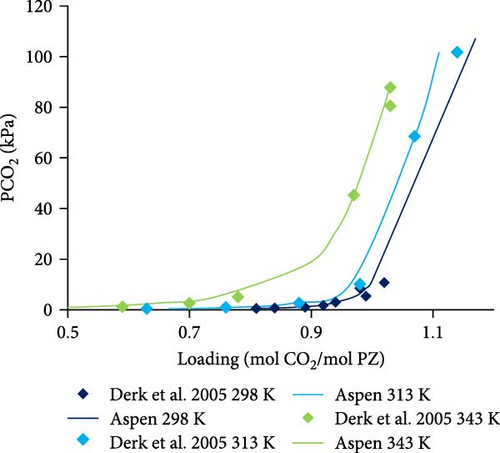
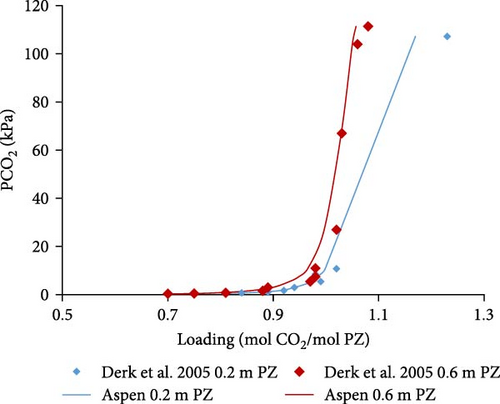
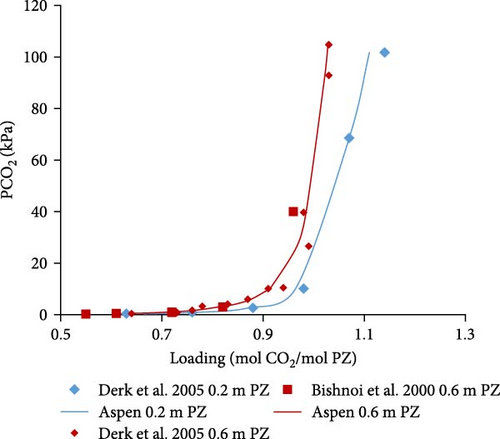
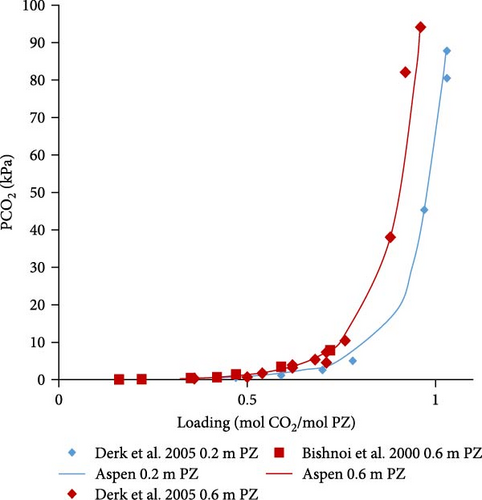
In Figure 4c–e, the Aspen calculated equilibrium data are compared with literature data from Derks et al. [29] and Bishnoi and Rochelle [13] for 0.2 and 0.6 molal PZ at specific constant temperatures (298, 313, and 343 K). It was noticed that the calculated data fits well with the literature data. There are a few outliers but with little deviations at very low partial pressures due to convergence reasons discussed before. Apart from those outliers, the data matches perfectly.
3.2.2. Speciation Model Validation
Figure 5a shows the comparison of Aspen calculated data with literature data obtained from Ermatchkov et al. [34] for 1 molal aqueous PZ at 283.15 K. The calculated data matches quite well with the literature data except for some deviations at higher loadings. Figure 5b shows the comparison data for 1.45 molal aqueous PZ at 283.15 K. Apart from a few outliers, especially for the sum of PZCOO− and HPZCOO at higher loadings, calculated data shows a reasonable match. Trends in calculations, in general, follow experimental speciation results from Ermatchkov et al. [34]. In Figure 5c, the comparison is shown for 1 m aqueous PZ this time at 298.15 K, here again the similarity of trends is observed as earlier for each species set. In Figure 5d, a comparison for 1.45 molal aqueous PZ at 298.15 K is shown, it is obvious that the sum of species sets remains equal to the molality of PZ confirming that the balance is right for a specific loading. Figure 5a–d shows moles of the set of species formed at different maximum loadings of CO2 in the liquid. It can be seen at different loadings the extent of dissociation that takes place and the concentrations of species changing as CO2 is absorbed. At a loading of around 0.5, the sum of PZ/PZH+/PZH+2 decreases to less than half of the initial concentration, whereas concentrations of HPZCOO/PZCOO− increase more than half of the initial concentration absorbing CO2. Most of the Aspen Plus calculated data shows reasonable comparability with literature data except for slight deviations at higher loadings. As a general observation, it can be seen that the deviations are the highest for 1.45 m PZ at higher loadings.
3.2.3. Simulation Studies on the Validated Model
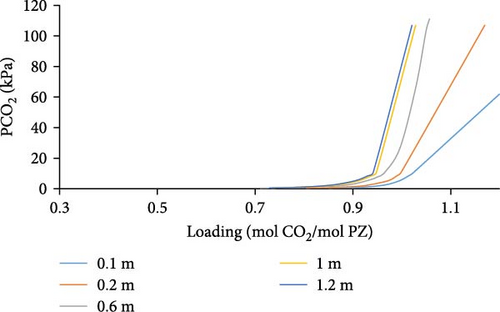
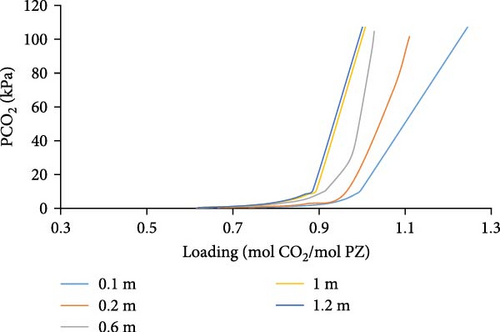
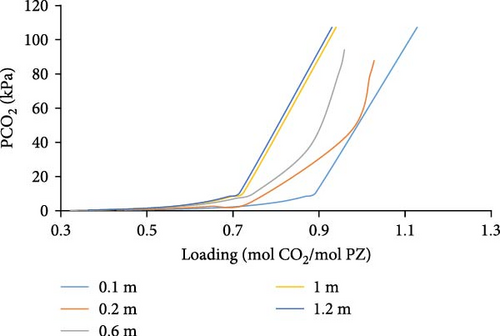
Aspen Simulations were carried out and are presented in Figure 6, at a temperature of 298, 313, and 343K showing absorption loading curves for a range of different PZ molalities, that is, 0.1–1.2 m PZ concentrations. We observed in (Figure 6a–c) that we have higher absorption loading of CO2 per mole of PZ for lower concentrations of PZ. That is due to the fact, that PZ only acts as an activator, an absorption rate enhancer, and does not have a high absorption capacity. Moreover, low loading of CO2 can be observed at higher temperatures for a given partial pressure of CO2.
3.3. Comparison of PZ With Water Scrubbing
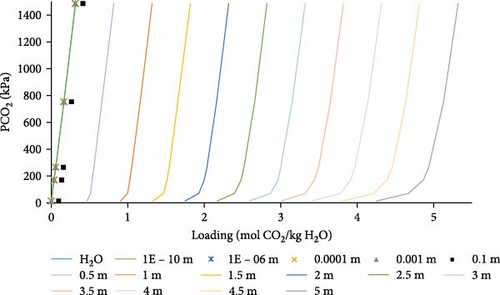
In Figure 7, different aqueous PZ concentrations were used for the comparison, starting with a concentration of about 5 molal PZ, the aqueous PZ was diluted until it reached a very low concentration. This was done to evaluate the influence of decreasing PZ concentration until it approaches water and to compare loading for each concentration to that obtained by water. As the concentration of PZ is decreased (Figure 7), a lower absorption loading was obtained at the same partial pressure of CO2. Very diluted systems act almost like pure water, little or no difference in absorption loading can be observed for solvent with the concentration of PZ lower than 0.001 molal as compared to water. Moreover, a very little difference was observed in loading for partial pressure of CO2 higher than 200 kPa, so increasing the partial pressure of CO2 has little effect on loading above 200 kPa. It was observed that around 1 mol of CO2 is absorbed per mole of PZ. An absorption loading of higher than 1 mol CO2 per mole of PZ can be obtained at higher partial pressures of CO2.
4. Discussion
The results matched very well with the literature data [13, 29] with less than 4% deviation. Speciation results showed dissociation species also in agreement with the literature data [34]. PZ as a stand-alone solvent performed very well even at smaller concentrations of 0.5 m aqueous PZ showing 120% higher absorption loading of CO2 than water at the same temperature and partial pressure. Higher concentrations of PZ reported further higher absorption loading, however considering economic viability the 0.5 m PZ may be chosen for further economic evaluation. In conclusion, PZ solubility of CO2 is a much better solvent as compared to pressurized water. Around 1 mol of CO2 is absorbed per mole of PZ below 200 kpa. The optimum partial pressure of CO2 was 200 kPa, above which there was no significant influence on CO2 loading. PZ concentrations above 0.1 molal should be used for significant change in CO2 loading as witnessed in the results obtained. In addition, the efficiency of CO2 removal obtained was higher while we know that the CO2 absorption rate in primary and secondary amines such as PZ is generally higher [46]. The model developed can now be extended to rate-based model development for finding optimized parameters for CO2 solubility using the PZ–CO2–H2O system. The economic valuation of the rate-based model may let the solvent be employed for biogas upgradation.
5. Conclusions
This work aimed to develop an equilibrium model within Aspen Plus (v7.3.2, AspenTech) simulation environment to enable the calculation of CO2 absorption in aqueous PZ solutions. From experimental data of CO2 solubility in PZ, up to 4 molal PZ concentration and 10,000 kPa partial pressure of CO2, reliable literature data was selected after rigorous comparison for model validation. To generate reliable results, simulations were performed on a validated model using PZ concentration from 0.1 to 1.2 molal for the temperature range of 298–343K and partial pressure of CO2 up to 120 kPa. Specific parameters are adjusted to preset values using design specs without influencing other settings. The temperature was kept constant to prevent system effects owing to the heat of absorption and heat of evaporation. To avoid the effects of condensation and evaporation, concentrations were maintained constant, and to calculate loading on specific partial pressure, the partial pressure of CO2 was kept constant. The model was validated for the PZ solvent system at different temperatures and partial pressures of CO2 for various concentrations of PZ through extensive comparisons with literature data. Detailed analysis of electrolyte system for aqueous PZ was studied by speciation studies on Aspen Plus and validated by speciation literature data. Aspen Plus calculations matched very well with literature data for CO2 solubility in PZ solution with less than a 4% deviation. Deviations can be observed at very low partial pressures of CO2, probably related to convergence problems. The model created on Aspen Plus was shown to provide appropriate results that may be used to predict CO2 absorption at equilibrium in the PZ solvent system. It was observed that the highest CO2 loading per mole of PZ was obtained at lower temperatures, higher partial pressures of CO2, and higher concentrations of PZ. Since pressurized water scrubbing is an industrial standard for biogas purification, maximum loadings of different concentrations of PZ solvent were compared to CO2 solubility in water. The simulations demonstrated that the PZ system has greater CO2 absorption capability than water; therefore, it is a potential solvent for CO2 removal from biogas. PZ shows 120% higher absorption loading of CO2 as compared to water for 0.5 m aqueous PZ at the same temperature and partial pressure. The acquired results may be used in future to design comprehensive absorption and desorption phases in the biogas upgrading process with aqueous PZ solutions using rate-based absorption studies in Aspen Plus. The study forms the basis for using PZ as a promoter in blend with other potential solvents with high CO2 absorption capacity.
Conflicts of Interest
The authors declare no conflicts of interest.
Author Contributions
Muazzam Arshad: conceptualization, methodology, software, validation, formal analysis, investigation, data curation, writing–original draft, visualization. Walter Wukovits: conceptualization, methodology, software, validation, resources, supervision. Anton Friedl: conceptualization, project administration, resources, supervision, validation and project administration. Hayat Khan: writing–original draft & editing, data analysis, investigation & funding. Khan Muhammad: writing–original draft. Mansoor Ul Hassan Shah: writing–review & editing. Muzammil Arshad: writing–review & editing.
Funding
This work was supported by the Deanship of Scientific Research, Vice Presidency for Graduate Studies and Scientific Research, King Faisal University, Saudi Arabia [Grant No. KFU251726].
Acknowledgments
The authors greatly acknowledge the Institute of Chemical Engineering, Vienna University of Technology, Austria, and King Faisal University, Saudi Arabia for using the Aspen Plus software tool and supporting this research.
Open Research
Data Availability Statement
The data that support the findings of this study are available from the corresponding authors upon reasonable request.


