Valorization of Distillery Spent Wash: Enhancement of Biomethane Potential Through Optimization of Inoculums and Substrates
Abstract
Utilization of distillery spent wash (DSW) as an energy source not only addresses the major environmental concern but also promotes sustainable energy practices. This study evaluates the biomethane potential of DSW through anaerobic digestion. Proximate analysis and optimization of the inoculum-to-substrate (I/S) ratio were performed to enhance biomethane production. Various combinations of substrates, including DSW, rice straw, dry leaves, and kitchen waste, were codigested with inoculums such as cow dung, baker’s yeast, and Saccharomyces cerevisiae strain 2044. Experiments were performed at a controlled temperature of 37°C with an optimal I/S ratio of 2:1 decided based on volatile solid (VS) content. Results indicate that the combination of cow dung and baker’s yeast yielded the highest biogas volume (310.97 NmL), followed by baker’s yeast alone (299.17 NmL) and cow dung alone (261 NmL). The optimal substrate mixture of DSW, cow dung, and kitchen waste exhibited a favorable carbon-to-nitrogen (C/N) ratio between 20 and 30, which is critical for efficient anaerobic digestion. In contrast, dry leaves and rice straw were found unsuitable due to their high C/N ratios. Although the impact of dry leaves and straw were noticeable in the early stages of digestion, they did not significantly contribute to the overall biogas yield.
1. Introduction
Research on alternative energy sources has been gaining more attention due to increased energy demand and rising fuel costs [1, 2]. Rapid industrialization generates a significant amount of effluent with high organic content, which, if treated appropriately, could serve as a sustainable energy source. Ethanol production has a long history, with applications ranging from beverages to industrial use and transportation fuel. The ethanol production process in distilleries typically involves four main steps: feed preparation, fermentation, distillation, and packaging [3–5]. Distilleries often use locally available sugar sources for fermenting mild alcoholic beverages.
Ethanol production from biomass sources depends on factors such as cost and availability. Globally, 61% of ethanol is produced from sugar crops, and distilleries in the Indian subcontinent predominantly use cane molasses for fermentation [6, 7]. Over the years, global ethanol production has increased significantly; the USA and Brazil together produce 94 billion liters of ethanol annually, accounting for 85% of the world’s total production. Approximately 80%–95% of this ethanol is produced using fermentation and distillation processes [8].
However, the generation of distillery stillage, also known as spent grain, ethanol distillery waste, or vinasse, at a rate of ~8–15 m3 per m3 of ethyl alcohol is a significant factor in this process [9–11]. Distillery stillage is a complex, highly oxygen-demanding organic waste that poses a significant environmental challenge [12, 13]. Soil erosion and degradation, deforestation, and pollution of water sources by chemicals and waste exacerbate the scarcity of freshwater [14, 15].
The ethanol distillery industry has expanded significantly, owing to its widespread industrial applications in pharmaceuticals, food, perfumery, and as an alternative fuel [16, 17]. However, these industries pose a serious threat to the environment in developing countries due to the large volume of wastewater generated containing significant amounts of recalcitrant compounds [18, 19]. Molasses contains around 15% fermentable sugars, of which only 9% is utilized for conversion into ethanol during fermentation [20, 21]. The rest of the organic and inorganic chemicals in the molasses end up in the effluent, popularly known as spent wash (SW), which is acidic [22]. Ethanol is separated from the fermented product in a distillation column as a top product, while the bottom product is waste, known as distillery SW (DSW). DSW is considered one of the most caramelized wastes [23] to treat due to its high chemical oxygen demand (COD) (110,000–190,000 mg/L), very high biological oxygen demand (BOD) (35,000–70,000 mg/L), and presence of total solids (TSs) (82,480 mg/L), nitrogen (2200 mg/L), phenolics (4.20 mg/L), sulfate (3410 mg/L), heavy metals (Mn, Fe, Zn, Cd, Ni, and Pb), and low pH [22, 24]. SW contains antinutritional and toxic substances, including melanoidins, posing risks to human and animal health. High melanoidin levels could cause mutagenic, carcinogenic, and cytotoxic effects on cells [25, 26].
The disposal of untreated or inadequately treated wastewater into fresh and marine water bodies causes pollution and poses a major hazard to aquatic organisms [27–29]. Although the cheaper and more commonly used treatment system for SW is the open lagoon, including anaerobic lagoon, facultative lagoon, and aerobic lagoon [30, 31], a significant amount of greenhouse gases (GHGs) are released into the atmosphere. The organics in the wastewater undergo anaerobic degradation in the open anaerobic lagoons, releasing methane (CH4) and carbon dioxide (CO2) into the atmosphere. The release of CH4 into the atmosphere is estimated to have a global warming potential 28–36 times greater than that of the same volume of CO2 [32–34]. However, SW is identified as a potential source of energy if processed anaerobically [35, 36]. Anaerobic digestion is a promising waste treatment technology that not only minimizes environmental hazards but also generates biogas, a clean and sustainable energy source [37]. This process involves the microbial breakdown of organic material in the absence of oxygen. The addition of codigestion substrates and inoculums is known to enhance biogas yield significantly [38]. Codigestion involves mixing different organic wastes to optimize the carbon-to-nitrogen (C/N) ratio, improve nutrient balance, and enhance microbial activity. In this study, rice straw, dry leaves, and kitchen waste were selected as substrates along with SW due to their abundance, low cost, and high organic content. Cow dung and baker’s yeast were used as inoculums because of their cost-effectiveness and availability, providing an active microbial population to initiate and sustain the digestion process. Utilizing SW as an energy source is considered a promising approach to minimizing environmental hazards while harnessing an alternative energy source. This strategy is expected to significantly contribute to a sustainable environment in developing countries. This study aims to explore the potential of using the DSW as a source of biomethane. Key factors such as microbial population, codigestion substrate type, and composition are analyzed to optimize the anaerobic digestion process. The findings of this study enhance the understanding of DSW as a renewable energy source and provide insights into the optimal utilization of DSW through an anaerobic digestion process. This study establishes the optimized anaerobic process conditions, enabling more efficient utilization of organic waste for hazard minimization and energy recovery. This would encourage sustainable energy practices in developing countries, addressing challenges in waste management and energy production.
2. Material and Methods
2.1. Characterization of Substrate Biomass
Various substrates, including SW, rice straw, dry leaves, and kitchen waste, were considered in this study. SW was collected from Sunypun Organic Ltd., Bangladesh, and the samples were stored at a controlled temperature of 5°C to preserve their composition. Representative samples were regularly taken for comprehensive characterization, including the analysis of parameters such as TSs and volatile solids (VSs). Rice straw was sourced from a local farm, while dry leaves were collected from the university campus. Both were stored at ambient temperature (27–29°C) in sealed containers to prevent contamination or moisture loss. Before use, the substrates were sun-dried and manually cut into small pieces (2–3 cm) to facilitate uniform mixing in the reactor and minimize substrate compaction, which could potentially damage the agitators employed during the experiment. Kitchen waste, primarily consisting of vegetable peels and food scraps, was collected daily from the university residential hall canteen. The waste was sorted to remove non-biodegradable materials and cut into small pieces before use. To ensure freshness and consistency, kitchen waste was prepared shortly before the start of each experimental batch.
2.2. Characterization of Inoculum
Three distinct inoculums were utilized: cow dung, baker’s yeast (Saccharomyces cerevisiae), and S. cerevisiae strain 2044 (SCS-2044). Cow dung, sourced fresh from a local dairy farm, was collected 2–3 h prior to the experiment to ensure an active and diverse microbial population. It was stored in a sealed container to maintain its quality and prevent contamination. Baker’s yeast, obtained locally, was stored at ambient temperature (27–29°C) to maintain its viability. The saccharomyces cerevisiae strain 2044 (SCS-2044) was cultivated in a yeast extract peptone dextrose (YPD) medium. The cultivation process involved a sterile medium containing yeast extract, peptone bacteriological, and dextrose. After cultivation, the strain was stored at 5°C in a sealed container to preserve its activity and prevent contamination.
2.3. Experimental Design
The substrates and inoculums were subjected to proximate analysis to obtain an idea of the organic share of the material. The VS and TS content of the inoculum and substrate were evaluated relative to the total amount of wet sample to establish the appropriate inoculum-to-substrate (I/S) VS ratio. An appropriate I/S ratio was developed for this process based on the chosen method and the properties of the substrate. Typically, at the bioprocess control (BPC) laboratory used in this study, I/S ratios of 3:2–2:1 (based on VS) were used [39]. Cow dung-based microorganisms, baker’s yeast, mixed yeast culture, and other strains of microorganisms were used in this study. SW, kitchen waste, dry straw, and leaves were used as substrates. All the experiment temperatures were maintained at 38°C, which was the optimum temperature for microorganism growth. Various combinations of substrate and inoculum were tested through experiments to determine the optimal mixture for achieving the highest yield and for codigestion of the inoculum.
2.4. Determination of TS and VS
In preparation for the biochemical methane potential (BMP) test, assessing the biomass characteristics, specifically TSs and VSs, were deemed crucial. TSs, comprising both inorganic and organic substances, were quantified through a standardized procedure involving heating at 105°C to eliminate moisture content. VSs, representing the organic compounds in the sample, were determined by heating the sample at 550°C for 2 h following the TS measurement. The weight disparity between the samples after heating at 105 and 550°C was used to indicate the content of VS [40].
2.5. Preparation of NaOH Solution for CO2 Absorption
The preparation steps for NaOH in CO2 absorption involved a 3 M NaOH solution being created by blending 240 g of pure NaOH with distilled water up to 2 L. Additionally, a 0.4% thymolphthalein pH-indicator solution was prepared by combining 40 mg of thymolphthalein with 9 mL of 99.9% ethanol and 1 mL of water. Subsequently, 10 mL of the pH-indicator solution was added to the prepared 2-L NaOH solution. Finally, bottles containing ~80 mL of the 3M NaOH solution and Thymolphthalein pH-indicator were prepared in 100 mL bottles.
2.6. Biomethane Potential Setup and Kinetics
The biomethane potential of SW was determined using the automated CH4 potential test system (AMPTS-II, BPC Instruments AB, Sweden). A total of 15 reactors were arranged, each comprised of different combinations of inoculum and substrate at various stages. To facilitate the removal of the reactor cap after the experiment, silicon spray was applied as a lubricant on the cap. The reactors were equipped with overhead stirrers and interconnected in a series arrangement. Mixing was done intermittently, alternating between clockwise and counterclockwise directions. Throughout the experimental run, the motor speed was set at 60%. A specific pattern of operation was followed, with 10 min of stirring followed by 3 min of rest, ensuring a vibration-free environment. The reactors were subjected to a constant temperature of 38°C by immersion in a water bath. The gas produced during anaerobic digestion was directed through the reactor outlets to bottles containing a solution of 3 M NaOH and 0.4% thymolphthalein pH-indicator, which effectively removed CO2 and H2S from the gas mixture. The utilization of this technique facilitated the automatic quantification of the generated biomethane.
This equation shows that the ratio between the amount of organic material from the inoculum in the sample versus the one in the blank was equal to the ratio between the total amount of the inoculum in the sample (mIS) and the one in the blank (mIB). Triplicates within the sample were used for BMP tests, and hence, the average of the replicates was used to produce the plots, which are reported here. The standard errors of the data were calculated and plotted as error bars with the experimental data.
3. Results
3.1. Physical and Chemical Characterization of Substrate and Inoculum
The assessment of TSs, which represented the TS matter present in the substrate, was undertaken to ascertain the substrate’s overall solid content. VSs, a subset of TS, were measured to determine the fraction of organic material within the substrate, which was pivotal in microbial degradation and bioconversion processes. Moisture content, a crucial factor influencing the overall suitability of the substrate for biological processes, was rigorously determined. Additionally, the ash content, indicative of inorganic mineral matter within the substrate, was analyzed to evaluate its impact on substrate stability and its potential role as a source of essential nutrients for microbial growth.
Cow dung serves as a rich reservoir of microorganisms, including bacteria, fungi, and protozoa, which are essential for nutrient cycling and the decomposition of organic matter. As a facultative anaerobe, baker’s yeast is capable of both aerobic respiration and anaerobic fermentation. Its ability to convert sugars into ethanol and CO2, along with its tolerance to ethanol and adaptability to various environmental conditions, highlights its significance as an inoculum. One of the objectives of the study was to leverage the distinctive characteristics of these inocula for diverse applications in research, industrial processes, and biotechnological production. Physical characteristics are summarized in Table 1.
| Substrates | Total solids (%) | Moisture content (%) | Volatile solids (%) | Ash (%) |
|---|---|---|---|---|
| Spent wash | 7.67 | 90.43 | 6.50 | 1.18 |
| Cow dung | 22.60 | 77.40 | 17.77 | 4.82 |
| Kitchen waste | 9.57 | 90.43 | 8.40 | 1.16 |
| Dry straw | 90.77 | 9.23 | 77.97 | 12.80 |
| Dry leaf | 90.73 | 9.27 | 73.77 | 16.96 |
| Baker’s yeast | 75 | 7 | 18 | 0.1 |
Chemical characterization, equally critical, was explored in terms of facets such as pH, nutrient content, and the presence of organic compounds. pH levels were deemed pivotal as they could be influenced by the availability of nutrients and shape the composition of the microbial community. Nutrient content, including crucial elements like nitrogen, phosphorus, and potassium, was considered pivotal in supporting microbial growth and driving biochemical reactions. Chemical characteristics are summarized in Table 2.
| Item | C (%) | H (%) | O (%) | N (%) | S (%) | P (mg/kg) | C/N ratio |
|---|---|---|---|---|---|---|---|
| Spent wash | 30.79 | 5.37 | 39 | 7.69 | 9.10 | 300 | 4.00 |
| Cow dung | 40.48 | 5.29 | 29.66 | 1.37 | 0.211 | 5312.11 | 29.55 |
| Kitchen waste | 48 | 6.4 | 37.6 | 2.6 | 0.4 | 15,000 | 18.46 |
| Dry straw | 37.45 | 5.1 | 33.81 | 0.412 | 0.061 | 637.49 | 90.90 |
| Dry leaf | 48.1 | 6.1 | 44.6 | 1.2 | 0.1 | 15,800 | 40.08 |
| Baker’s yeast | 48.3 | 6 | 34.5 | 10.6 | 0.2 | 7,589 | 4.56 |
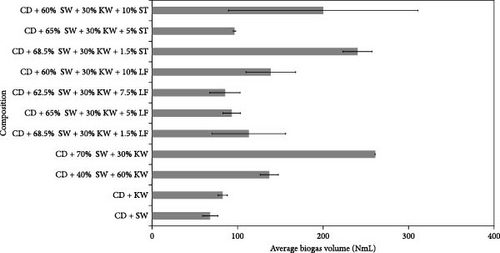
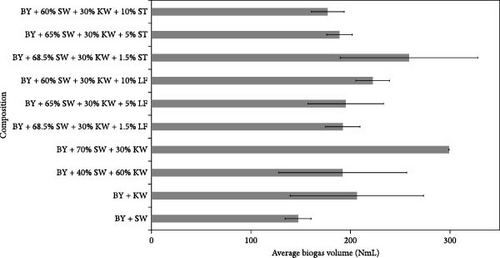
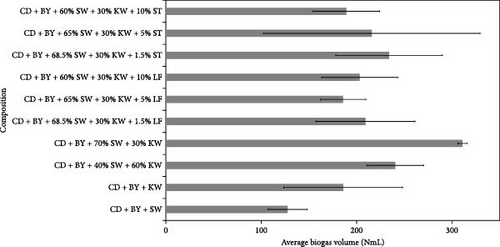
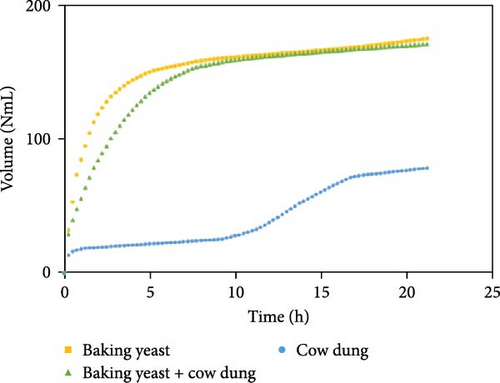
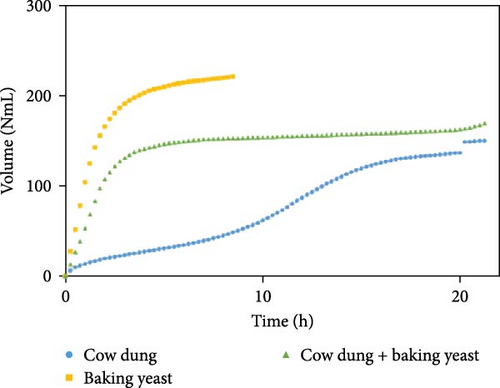
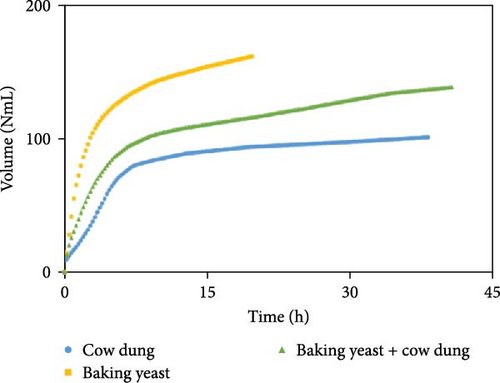
The outcomes of the experiments are illustrated in Figures 1–3, highlighting the average biogas volumes (measured in NmL). These experiments were conducted to evaluate the biogas production potential of various substrate mixtures, including cow dung, SW, kitchen waste, dry leaves, and rice straw. Cow dung, baker’s yeast, and both together were the inoculums in Figures 1–3, respectively. The characteristics of the substrates, such as TSs, moisture content, VSs, and ash content, were analyzed in the context of their suitability for biogas production. These properties were found to play a critical role in determining the effectiveness of the substrates. Substrates with higher TSs and VSs content were generally observed to exhibit greater potential for biogas production, as they provided a larger amount of organic matter for conversion into biogas through anaerobic digestion.
3.2. Effect of Different Compositions With Each Inoculum
The experimental data was examined in relation to time, as the duration and flow rate of biogas production varied due to the different compositions utilized. A constant time parameter was imposed to ascertain whether the collected data aligned with this standardized condition. The experimental data presented in Figures 4–6 provide visual representations of the biogas volumes achieved under the standardized time parameter using different inoculum compositions. Figure 4 illustrates the results obtained with cow dung inoculum, Figure 5 depicts the outcomes with baker’s yeast inoculum, and Figure 6 combines cow dung and baker’s yeast inoculum. These figures highlight the influence of substrate composition on biogas production.
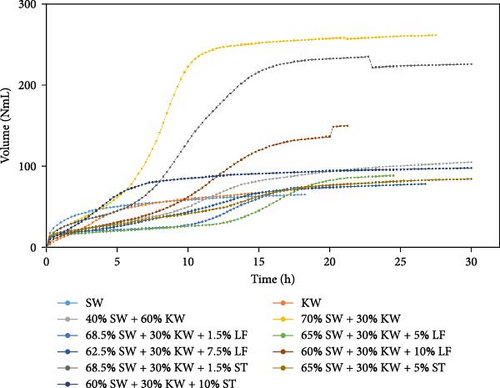
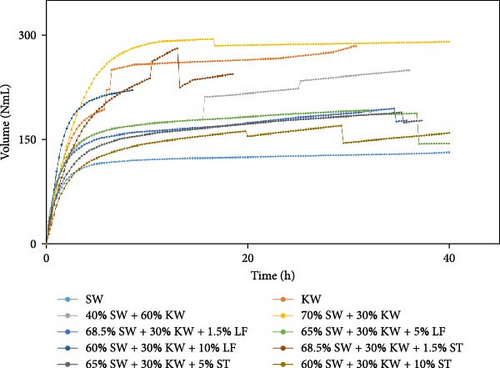
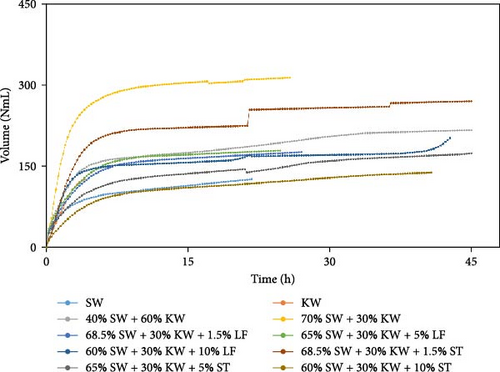
The dataset of each sample in Figures 4–6 is represented in Figures S1–S3, respectively. The experiments were conducted three times for each dataset. The error bars were shown to depict the variability in the results.
3.3. Inoculum Effect in Each Composition
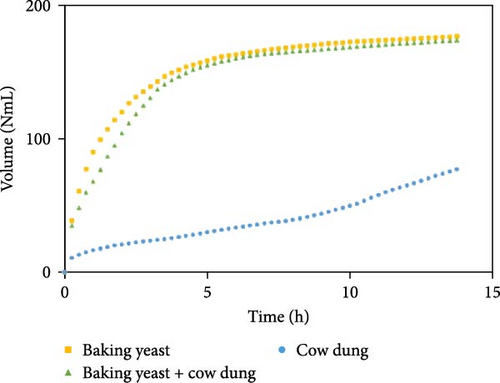
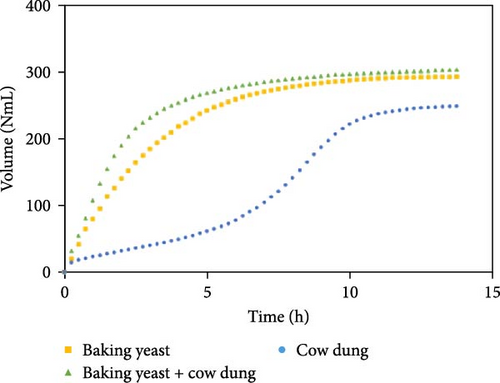
Figure 7 illustrates the influence of inoculum on biogas production for each substrate composition, enabling the identification of the optimal inoculum to maximize biogas production using SW. These findings offer valuable insights into the role of the inoculum in biogas production and present a comparative performance of cow dung, baker’s yeast, and a combination of both. Some other combinations are shown in Figure S7.

3.4. Proximate Analysis of Residue
The proximate analysis of residues obtained from biogas production using various inoculums and substrates revealed significant variations in moisture content, ash content, VSs, and TSs (Table 3). Among the tested combinations, those involving cow dung as the inoculum exhibited relatively higher moisture content, ranging from 87.81% to 96.55%. Conversely, samples incorporating baker’s yeast tended to have lower moisture content, with values ranging from 88.30% to 92.56%. Ash content was generally low across all samples, with the highest recorded at 2.18% for a combination of cow dung, baker’s yeast, 68.5% SW, 30% kitchen waste, and 1.5% straw. The VSs content varied considerably, with the highest value of 10.83% observed in a mixture of cow dung, 70% SW, and 30% kitchen waste, while the lowest value of 2.59% was found in a blend of cow dung, baker’s yeast, 65% SW, 30% kitchen waste, and 5% straw. TSs content ranged from 3.45% to 12.19%, indicating the presence of organic matter suitable for biogas production. These findings underscore the importance of selecting appropriate inoculums and substrates to optimize biogas production from DSW, with implications for both efficiency and environmental sustainability.
| Sample name | Moisture content (%) | Ash content (%) | Volatile solid (%) | Total solid (%) |
|---|---|---|---|---|
| Cow dung + 70% spent wash + 30% kitchen waste | 87.81 | 1.36 | 10.83 | 12.19 |
| Cow dung + 68.5% spent wash + 30% kitchen waste + 1.5% straw | 89.00 | 2.05 | 8.95 | 11.00 |
| Cow dung + 60% spent wash + 30% kitchen waste + 10% straw | 91.98 | 1.79 | 6.23 | 8.02 |
| Baker’s yeast + 70% spent wash + 30% kitchen waste | 92.37 | 1.48 | 6.16 | 7.63 |
| Baker’s yeast + 68.5% spent wash + 30% kitchen waste + 1.5% straw | 92.56 | 1.54 | 5.90 | 7.44 |
| Baker’s yeast + 60% spent wash + 30% kitchen waste + 10% leaf | 88.30 | 1.97 | 9.73 | 11.70 |
| Cow dung + baker’s yeast + 70% spent wash + 30% kitchen waste | 89.01 | 1.97 | 9.02 | 10.99 |
| Cow dung + baker’s yeast + 68.5% spent wash + 30% kitchen waste + 1.5% straw | 88.23 | 2.18 | 9.59 | 11.77 |
| Cow dung + baker’s yeast + 65% spent wash + 30% kitchen waste + 5% straw | 96.55 | 0.87 | 2.59 | 3.45 |
| Cow dung + baker’s yeast + 40% spent wash + 60% kitchen waste | 95.46 | 1.06 | 3.47 | 4.54 |
4. Discussion
Table 1 illustrates the composition of various substrates, including SW, cow dung, kitchen waste, dry straw, and dry leaf, with details on TSs (%), moisture content (%), VSs (%), and ash (%). Notable differences were observed among the substrates, with dry straw and dry leaf having the highest TSs content, indicating a greater concentration of solid material. Higher moisture content values were observed for cow dung and kitchen waste, indicating significant water presence. Dry straw and dry leaf were high in VSs content, suggesting a higher proportion of organic matter. However, dry leaf had the highest ash content, indicating a significant portion of inorganic residue as well. Variations in composition are considered to be one of the major challenges for the implementation of better waste management and energy production, necessitating informed decisions for proper utilization and resource management. In Table 2, insights into nutrient content and decomposition characteristics were provided through the composition analysis of organic materials used in composting. SW, a byproduct of ethanol production, is known for its high carbon content and low C/N ratio, making it suitable for energy recovery and accelerated composting. Cow dung is a common organic waste that contains moderate levels of carbon and nitrogen, contributing to balanced decomposition. Kitchen waste, rich in carbon and with a relatively low C/N ratio, is identified as an excellent addition for accelerating the composting process. Dry straw acted as a bulking agent due to its high carbon content and large C/N ratio, preventing compaction. Dry leaves offered a balanced composition with high carbon content and a moderate C/N ratio. These findings facilitated the optimization of the composting processes for efficient nutrient recycling and sustainable waste management. The C/N ratio, an important indicator for anaerobic digestion quality, is known to ideally fall between 20 and 30. Therefore, SW, cow dung, and kitchen waste were identified as suitable substrates, while dry straw and dry leaf were deemed unsuitable due to their high C/N ratios. Baker’s yeast, with a low C/N ratio, might have required codigestion for balance.
Biogas volumes in the experimental results were examined, and a gradual increase was observed (Figure 1) when cow dung was combined with SW and kitchen waste, indicating enhanced biogas production potential. Higher biogas volumes were seen (Figure 2) with the addition of baker’s yeast to SW and kitchen waste, indicating the potential of baker’s yeast as the inoculum. However, increased biogas volume was demonstrated in Figure 3 with baker’s yeast alongside cow dung, SW, and kitchen waste, suggesting a potential synergistic effect of both inoculums. In Figures 4–6, distinct combinations of organic materials and inoculums were analyzed for biogas production. Notably, in Figure 4, the highest biogas output was achieved with cow dung inoculum and a composition of 70% SW and 30% kitchen waste, followed by other effective combinations. It was indicated in Figure 5 that cow-dung inoculum was crucial, with the optimal mix being 70% SW and 30% kitchen waste. These findings were supported by Figure 6, which emphasized the importance of cow dung and baker’s yeast inoculums, particularly in the 70% SW and 30% kitchen waste combination. Overall, these figures visually represented the impact of diverse substrate compositions on biogas production, providing a comprehensive summary of the experimental outcomes and highlighting the trends and variations in the relationship between substrate composition and biogas volume. In Figure 7a, baker’s yeast was found to be the most effective in enhancing biogas production when combined with SW, followed by cow dung and baker’s yeast combined. A similar trend is shown in Figure 7d. The relative performance of different inoculum types in biogas production across various substrate compositions was further demonstrated, emphasizing the effectiveness of baker’s yeast in most cases. These results underline the significance of inoculum type and substrate composition in maximizing biogas production efficiency.
Various combinations of substrate and inoculum mixtures were explored to determine the optimal conditions for biogas production from DSW. The best average biogas volume was achieved with the combination of cow dung and baker’s yeast as inoculum, yielding 310.97 NmL, followed by baker’s yeast alone at 299.17 NmL and cow dung alone at 261 NmL. When time was considered a factor, baker’s yeast alone was found to outperform the combination of cow dung and baker’s yeast. It was observed in experiments that inoculum with kitchen waste and SW performed the best across all variations of inoculum. Following that, 1.5% rice straw demonstrated the best performance, followed by 1.5% dry leaf. 5% dry leaf and 5% dry straw showed lower performance, whereas 10% dry leaf and 10% rice straw exhibited the least favorable results. The impact of dry leaf and rice straw compositions appeared negligible, with their effects diminishing after the initial 2–3 h of digestion.
These findings provide valuable insights into the complex dynamics of biogas production processes. They emphasize the importance of optimizing substrate composition and inoculum type to enhance biogas production, which is crucial for improving waste management practices and renewable energy generation. The study highlights that SW, kitchen waste, and cow dung are the most effective substrates due to their favorable C/N ratios, while baker’s yeast plays a vital role as an inoculum to maximize biogas yields. Future studies could delve deeper into the effects of varying proportions of dry straw and dry leaf to further optimize biogas production processes. Additionally, exploring the scalability of these findings for large-scale anaerobic digestion applications in diverse environmental and socioeconomic settings can enhance their practical applicability.
5. Conclusion
The results of this study provide valuable insights into the feasibility of commercializing the anaerobic digestion of DSW in developing countries. By optimizing the I/S VSs ratio and substrate mixture, the most effective methods for the anaerobic digestion process were identified. The experimental results demonstrated that the addition of SW, kitchen waste, and baker’s yeast enhanced the potential of biogas production with cow dung, indicating the synergistic effects of different substrates. The type of yeast strain used was also found to affect the biogas production process.
The C/N ratio, which represents the C/N ratio in substrates, was identified as a critical indicator of substrate quality for anaerobic digestion. The optimal C/N ratio for anaerobic digestion was found to be between 20 and 30, as ratios that were too high or too low could inhibit the digestion process. Based on C/N ratios, SW, cow dung, and kitchen waste were identified as the most suitable substrates for anaerobic digestion, while dry straw and dry leaf were deemed unsuitable due to their high C/N ratios. Baker’s yeast, on the other hand, exhibited a very low C/N ratio, suggesting the need for codigestion with other substrates to balance the C/N ratio. Overall, these findings provided valuable insights into the composition and performance of different substrates in biogas production, contributing to the optimization of waste management and resource utilization strategies. It is evident that the anaerobic digestion of DSW can simultaneously contribute to sustainable waste management and renewable energy generation, showcasing its potential as a viable solution for addressing waste disposal and energy challenges in developing countries. Further research and analysis could explore the specific applications and limitations of these substrates in different contexts.
Conflicts of Interest
The authors declare no conflicts of interest.
Author Contributions
Sakib Hasan Jeebon: data curation, formal analysis, investigation, methodology, validation, visualization, writing–original draft preparation, writing–review and editing. Vaskur Kanti Roy: investigation, methodology, validation, visualization, writing–review and editing. Partha Sarathi Paul: investigation, methodology, validation, visualization, writing–review and editing. Shoeb Ahmed: conceptualization, funding acquisition, methodology, project administration, supervision, validation, writing–review and editing.
Funding
This research received no specific grant from any funding agency in the public, commercial, or not-for-profit sectors.
Acknowledgments
The authors would like to acknowledge the support of the Applied Bioengineering Research Incubator (ABRI) and Sunypun Organic Ltd.
Supporting Information
Additional supporting information can be found online in the Supporting Information section.
Open Research
Data Availability Statement
The data that support the findings of this study are available from the corresponding author upon reasonable request.


