Energy-Export Decoupling in China: Evolutionary Trends, Driving Forces, and Sectoral Heterogeneity (2002–2022)
Abstract
This study utilizes a noncompetitive input–output (IO) model, the Tapio decoupling model, and the Logarithmic Mean Divisia Index (LMDI) method to examine the decoupling between China’s export trade growth and energy consumption from 2002 to 2022. The main findings are as follows: (1) Despite a declining share of total domestic energy consumption, China’s export trade continues to exert substantial energy demand, highlighting the need for enhanced energy efficiency to ensure sustainable trade growth. (2) Between 2002 and 2022, China made significant strides in decoupling export growth from energy consumption, with notable energy intensity reductions from 2002 to 2014. However, progress slowed post-2014. (3) Energy intensity reductions were the primary driver of decoupling, followed by export scale shifts, while trade structure changes had a lesser impact. Technological innovation, industrial restructuring, and green policies were key factors, enabling energy efficiency improvements and a shift to less energy-intensive sectors. This study analyzes China’s export growth and energy consumption, highlighting decoupling from energy use and offering insights into sustainable trade, economic-environmental integration, and policies for long-term global multidomain sustainability.
1. Introduction
China’s rapid economic growth and trade expansion following its accession to the World Trade Organization (WTO) in 2002 have significantly increased energy consumption, positioning the country as a leading global exporter and energy consumer [1]. This dual role makes China an exemplary case for examining the intricate relationship between export activities and energy consumption [2]. Prior research has demonstrated the substantial impact of exports on clean energy consumption and structural transformation, yet the decoupling dynamics between export growth and energy consumption remain insufficiently explored [3].
This study holds significant implications for bridging key sustainable development goals, including ensuring responsible consumption and production patterns, combating climate change, and fostering sustainable economic growth. By analyzing the decoupling relationship between export growth and energy consumption, the research contributes to advancing energy efficiency and trade sustainability, which is essential for both China and the global community’s environmental and economic priorities.
This study employs a comprehensive methodological framework integrating Leontief’s input–output (IO) model, Tapio’s decoupling model, and Ang’s Logarithmic Mean Divisia Index (LMDI) decomposition approach to examine the sustainability of China’s export activities from 2002 to 2022. Specifically, it addresses three key questions: What are the evolutionary trends of decoupling between export growth and energy consumption? What are the driving forces behind these trends? How do these dynamics vary across industrial sectors? By providing actionable insights, this research offers valuable lessons for policymakers in achieving sustainable trade and energy use, both in China and globally.
2. Literature Review
2.1. Introduction to the Decoupling Model and Its Applications
The decoupling model is fundamental to sustainable development [4], aiming to detach economic growth from environmental degradation and resource depletion, with a primary focus on greenhouse gas (GHG) emissions [5, 6]. It examines whether economic progress can occur without disproportionately increasing environmental pressures [7], promoting growth while mitigating environmental harm [8, 9]. Decoupling is categorized into two types: relative decoupling, where the environmental impact grows at a slower rate than the economy, and absolute decoupling, where economic growth is accompanied by a reduction in environmental impact [10, 11].
Stern [12] introduced the environmental Kuznets curve (EKC), exploring the relationship between economic growth and environmental pollution and addressing whether pollution and energy consumption can decouple during development. The OECD further developed this concept by providing indicators for measuring decoupling, focusing on environmental pressures and economic growth [13]. Tapio [4] advanced the model by introducing elastic-based measures to assess decoupling strength and direction, widely applied across sectors and regions. Dietsch [14] examined the decoupling of global carbon emissions from economic growth, emphasizing the role of policies and technology.
The OECD’s decoupling model uses indicators such as CO2, sulfur oxides, and nitrogen oxide emissions to measure decoupling. It employs the DPSIR framework (Drivers, Pressures, State, Impact, Response) to assess decoupling, particularly in relation to GHG emissions, energy production, and waste generation linked to GDP growth [15]. Notable reductions in sulfur and nitrogen oxide emissions suggest success in decoupling environmental pressures from economic growth [16, 17]. The model also addresses the “3E dilemma” (economic growth, energy consumption, and environmental protection), a key for energy security policies [18].
Countries like Australia, Switzerland, Germany, Denmark, and Sweden demonstrate stable decoupling due to effective energy security measures [19]. In OECD nations, agricultural decoupling shifts from price support to regional payments, reducing inefficiencies but affecting production [20]. Decoupling also necessitates coordinated industrial strategies and green technology investments, highlighting the challenge of detaching economic growth from environmental harm [21]. The OECD model also examines the diminishing returns of growth on welfare and ecological impact, underscoring the need for interdisciplinary research and policy innovation [22].
Some OECD countries have achieved relative decoupling, where environmental pressures increase more slowly than economic growth [23]. However, absolute decoupling, where economic growth accompanies reduced environmental impact, remains rare [24].
2.2. Application of IO Models in Environmental Studies
IO models are indispensable tools in environmental economics, providing a framework for analyzing the relationship between economic activities and environmental impacts [25, 26]. Developed by Wassily Leontief, IO models have evolved to incorporate environmental factors, enabling comprehensive evaluations of how economic activities influence environmental resources and vice versa [27].
The environmental extended IO (EEIO) model expands upon the traditional IO framework by incorporating data on resource use and pollutant emissions, facilitating a holistic assessment of environmental footprints [28, 29]. EEIO models are extensively used to examine the environmental impacts of international trade, revealing how environmental burdens are transferred across borders via global supply chains [30].
By integrating environmental variables, IO models allow researchers and policymakers to evaluate the environmental footprints of individual sectors [31, 32]. These models are widely applied in various fields, including lifecycle assessments [33], footprint tracking [34], and policy analysis [35]. They help assess the sustainability of resource use and inform strategies to mitigate environmental impact.
A key application of IO models in environmental economics is economic IO lifecycle assessment (EIO-LCA). This top-down approach uses economic IO tables and sector-specific environmental data to assess the environmental impacts of sectors like electricity generation [36]. EIO-LCA offers a comprehensive analysis, addressing sectoral disaggregation and modeling issues related to varying IO table formats [37].
At regional and national levels, IO models are applied through frameworks such as StateIO and the USEEIO model. StateIO develops state-specific IO models in the United States, capturing production, consumption, and trade patterns, which are essential for regional economic impact analysis [38]. In contrast, the USEEIO model evaluates the environmental impacts of US goods and services, integrating waste sector classifications and price adjustment matrices [39].
IO models are also used to estimate environmental footprints at the household level, linking economic activities to environmental consequences. This approach offers insights into how household behavior, such as time use and spending patterns, influences environmental impacts, highlighting disparities among different household types [40]. Additionally, IO models are employed to analyze sectoral linkages and identify priority industries for GHG reduction, as demonstrated by [41] in their climate policy and economic growth research.
Furthermore, IO models have been applied to waste management, quantifying solid waste generation across sectors. The USEEIO model, for example, identifies industries with high waste generation, providing a basis for waste reduction and resource management decisions [42]. Additionally, energy-based IO models integrate ecological energy conversion rates to analyze ecological-economic systems, overcoming the limitations of traditional IO models in handling diverse material inputs and measurement units [43].
Despite the widespread use of EEIO models, challenges remain. Data aggregation is a significant issue, as it can lead to information loss and suboptimal decision-making. Aggregating IO data may obscure the true environmental impacts of economic activities, highlighting the need for careful consideration in model development and application [44]. Moreover, the transferability of models like StateIO to international contexts remains limited, underscoring the need for further research and adaptation to different economic systems [45].
2.3. Factor Decomposition Methods and the Selection of the LMDI Approach
Factor decomposition methods are essential tools for identifying the underlying drivers of changes in environmental indicators, such as energy consumption and emissions [46]. These methods decompose overall changes into contributions from factors like economic activity, energy intensity, and structural shifts, facilitating a deeper understanding of the complex dynamics between economic growth and environmental impacts [47]. They provide valuable insights for policymakers in formulating strategies for sustainable development. Common decomposition methods, including Laspeyres, Paasche, and Divisia indices, offer distinct advantages and limitations based on the context of the study [48, 49]. However, these approaches are often criticized for their reliance on base-year assumptions and the potential distortions they introduce in the decomposition process.
Among these techniques, the LMDI method stands out due to its theoretical consistency, ability to handle zero and negative values, and straightforward interpretation [50]. LMDI offers several key advantages: it uses the logarithmic mean to ensure path independence, meaning it is not influenced by base-year choices or subjective factors [51]. Additionally, LMDI provides clear insights into the relative contributions of each factor, making it an invaluable tool for policymakers seeking to identify the main drivers of environmental change [52]. Furthermore, LMDI can be applied across various contexts, from national energy consumption and carbon emissions analysis to sector-specific studies [53].
LMDI has gained widespread adoption for its ability to provide unbiased and consistent results without requiring base-year weighting, making it an ideal method for decomposing environmental indicators like energy consumption and emissions [54]. Unlike traditional methods, LMDI decomposes changes into additive components representing factors such as energy intensity, economic activity, and technological progress while maintaining consistency throughout [55]. This allows for a more accurate understanding of how each factor contributes to decoupling, particularly in terms of energy efficiency and structural changes [56, 57].
In recent years, LMDI has been increasingly applied in studies examining the decoupling of economic growth from environmental impacts, such as China’s energy consumption and carbon emissions, offering valuable insights into the interplay between economic development and environmental sustainability [58]. Its versatility in handling data from various sectors and regions makes it the preferred tool for analyzing the multidimensional impacts of trade, energy consumption, and technological advancements on sustainable development goals [59, 60].
LMDI ensures perfect decomposition without residuals, providing a clear understanding of the relative importance of different driving factors [51]. It has been extensively used in energy and environmental research to analyze trends and inform policymaking [61]. For example, researchers have employed LMDI to decompose changes in carbon emissions, identifying contributions from energy intensity improvements, economic growth, and structural changes [62]. Additionally, LMDI has been used to assess factors influencing energy consumption across industries, helping to develop targeted energy efficiency measures [63]. Its stability and flexibility make LMDI the preferred method for decomposition analysis in environmental research.
Although LMDI provides a robust framework for analyzing decoupling, it is crucial to consider the broader economic and environmental policy context [64]. The success of decoupling strategies often hinges on the integration of technological innovation, policy interventions, and international cooperation [65, 66]. For instance, trade liberalization and access to green technologies can enhance decoupling efforts, particularly in developing regions [67, 68]. Therefore, a holistic approach that combines economic, technological, and policy dimensions is vital to achieving sustainable development goals [65, 69].
2.4. The Lack of Existing Literature and the Innovation of the Article
Existing research demonstrates that noncompetitive input–output (NCIO) models are effective in estimating the energy consumption associated with exports by distinguishing between domestic production and imports. The Tapio decoupling model provides a dynamic framework to analyze the relationship between energy consumption and export growth, identifying periods of decoupling and coupling. The LMDI decomposition method further dissects the driving factors behind changes in energy consumption, such as energy intensity, export scale, and export structure.
- 1.
Many analyses have employed individual models, such as NCIO models, Tapio decoupling models, or LMDI decomposition methods, in isolation. This siloed approach limits the ability to capture the multifaceted interactions between energy use and export activities.
- 2.
Existing research often focuses on short-term periods, lacking a comprehensive longitudinal perspective that encompasses the long-term trends and structural changes in China’s export-driven energy consumption, especially since its accession to the WTO.
- 3.
There is a paucity of studies that delve into sector-specific dynamics, which are crucial for understanding the heterogeneous impacts of export activities on energy consumption across different industries.
- 1.
This research pioneers the integration of the NCIO model, Tapio decoupling model, and LMDI decomposition method into a unified framework. This comprehensive approach enables a nuanced analysis of the dynamic decoupling trends between energy consumption and export growth in China since its accession to the WTO.
- 2.
By combining China’s NCIO tables for 2018 and 2022 with the World Input–Output Database (WIOD) tables for 2002, 2006, 2010, and 2014, this study conducts a longitudinal analysis spanning two decades (2002–2022). This extensive dataset allows for the examination of long-term trends and the identification of structural changes over time.
- 3.
The study delves into sectoral heterogeneity by analyzing industry-specific decoupling dynamics and driving factors. This granular analysis provides insights into how different sectors contribute to or mitigate energy consumption in the context of export growth, informing targeted policy interventions.
3. Methodology
3.1. Dynamic Decoupling Framework
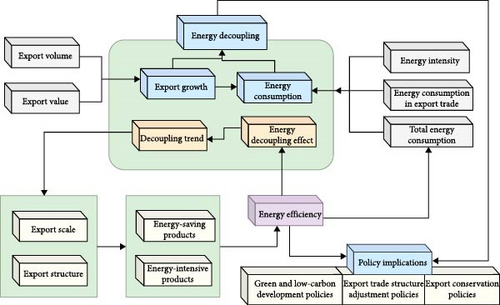
Figure 1 presents a dynamic decoupling framework between energy consumption and export growth in China. Export volume and value drive export growth and energy consumption, respectively, shaping the decoupling outcomes. The framework highlights the roles of export scale and structure in influencing energy efficiency through the interaction of energy-saving and energy-intensive products. Enhanced energy efficiency contributes to green development. Additionally, it emphasizes policy linkages—green and low-carbon policies, export structure adjustments, and energy conservation policies—which collectively reduce energy consumption and support sustainable export growth, offering a clear theoretical and practical foundation for aligning energy conservation with export growth.
3.2. Model for Estimating Energy Consumption in Export Trade
An NCIO table elucidates intersectoral production linkages within an economy and highlights trade and industrial connections with other nations. The relationships among sectoral output, final demand, and imports can be expressed in Table 1 and Equation (1).
| Output | Input | |||||||
|---|---|---|---|---|---|---|---|---|
| Sector | Intermediate use | Final use | Import | Total output | ||||
| 1, 2, …, n | Consumption | Investment | Export | Total | ||||
| Domestic intermediate inputs |
|
— | Xi | |||||
| Imported intermediate inputs |
|
Mi | — | |||||
| Value added | Vi | — | — | — | — | — | — | — |
| Total input | Xj | — | — | — | — | — | — | — |
As a global manufacturing hub, China utilizes a significant amount of imported raw materials and components in producing export goods. Since the energy consumption of imported intermediate goods occurs abroad, it should be excluded when calculating the energy consumption of China’s export sectors. Similarly, transshipment trade, which involves re-exporting goods produced abroad , also does not consume domestic energy and should be excluded to avoid overestimating energy consumption in China’s export trade. The following sections employ the NCIO framework to construct models for computing energy intensity and consumption in China’s export trade.
This total energy consumption of exports provides a basis for assessing the energy efficiency of China’s export trade.
3.3. Measuring Decoupling Between Export Growth and Energy Consumption
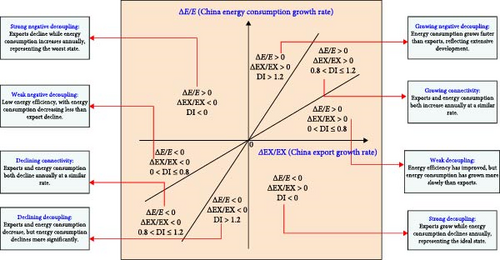
Building on Sun and Song [70] and Sun et al. [71], the Tapio framework classifies decoupling into eight states. These range from “strong decoupling” to “strong negative decoupling,” based on elasticity values, as shown in Figure 2.
3.4. Factor Decomposition Analysis for Decoupling
To analyze the influencing factors of export growth and energy consumption decoupling, a factor decomposition method is employed to break down the impact of export scale, trade structure, and energy intensity of export sectors on energy consumption.
ΔEG measures the impact of changes in export volume on energy consumption, showing how the growth in the quantity of exports leads to increased or decreased energy use. ΔES quantifies the effect of changes in the structure of export trade, such as shifts in the types of goods exported (e.g., from energy-intensive products to less energy-consuming ones). ΔET reflects the changes in energy intensity in export production, capturing improvements in energy efficiency.
The total energy consumption change in export trade is the sum of these three effects, and the DI allows policymakers to understand how effectively export growth is being decoupled from energy consumption over time.
Since , equals 0.
As the sum of these effects equals the total change in energy consumption, the decomposition method produces no residuals. This highlights the method’s advantage, as it accurately captures the impact of export scale, export trade structure, and energy intensity on the decoupling of export growth from energy consumption.
3.5. Data Sources
This study utilizes the 2018 and 2022 National NCIO Tables of China1. In addition, to assess the decoupling between China’s export trade growth and energy consumption since WTO accession, this study incorporates NCIO tables from the WIOD for 2002, 2006, 2010, and 20142.
To ensure consistency, the WIOD China IO tables, denominated in million USD, are converted to 10,000 RMB, aligning with the 2018 and 2022 National NCIO Tables. This conversion uses the average annual USD to RMB exchange rates for 2002, 2006, 2010, and 20143.
This conversion aligns data from 2002 to 2014 with the 2018 Chinese tables, enabling the creation of a time series from 2002 to 2022. This period, encompassing China’s WTO accession, forms a solid foundation for analyzing long-term trends, particularly the relationship between energy consumption and economic growth. By merging data across years, the study sheds light on changes in China’s economic structure and its influence on global energy markets. Energy consumption data for subsectors is sourced from the National Bureau of Statistics4, with IO tables and energy data consolidated into 15 sectors (Table 2).
| No. | Sector name | Included industries | Classification basis |
|---|---|---|---|
| S1 | Agriculture | Agriculture, Forestry, Animal Husbandry, Fishery | Primary sector with similar environmental impact and trade characteristics. |
| S2 | Mining and Extraction | Coal, Oil, Natural Gas, Metal, and Nonmetallic Mining | High-energy extraction industries with shared resource intensity. |
| S3 | Food and Tobacco | Food Manufacturing, Tobacco Products | Processing sector for primary consumables. |
| S4 | Textiles and Leather | Textile, Apparel, Leather Products | Focus on fabric and fashion-related products. |
| S5 | Wood and Furniture | Wood Processing, Furniture | Shared materials and similar processing techniques. |
| S6 | Paper and Education Goods | Paper, Printing, Educational and Sports Goods | Medium-intensity manufacturing processes. |
| S7 | Petrochemical Products | Petroleum Refining, Coking, Nuclear Fuel Processing, Chemical Manufacturing | High-energy and pollution-intensive sectors. |
| S8 | Metals and Mineral Products | Nonmetallic Minerals, Metal Smelting, Metal Products | Industries related to metal and mineral processing and manufacturing. |
| S9 | Machinery | Machinery and Equipment Manufacturing | High-value manufacturing sector. |
| S10 | Transportation Equipment | Transportation Equipment Manufacturing | Specific to transportation technology. |
| S11 | Electronics | Electrical Machinery, Communication Equipment, Computers, Electronics, Instruments and Meters | Shared technological base and energy use. |
| S12 | Waste and Miscellaneous Manufacturing | Waste Utilization and Other Manufacturing | Industries focused on recycling and diverse manufacturing activities. |
| S13 | Utilities | Electricity, Thermal Energy, Gas, Water Supply | Core energy inputs. |
| S14 | Construction | Construction, Civil Engineering | Reflects national development focus and infrastructure priorities. |
| S15 | Transport and Services | Transportation, Warehousing, Postal Services, Wholesale, Retail, Accommodation, Catering, Other Services | Key logistics, trade, and service industries. |
4. Results and Discussion
4.1. Energy Intensity of China’s Export Sectors
4.1.1. Totality Analysis
According to Equation (3), Figure 3 illustrates the trend in China’s export trade energy intensity over time. The average energy intensity per sector for the years 2002, 2006, 2010, 2014, 2018, and 2022 was 1.9 tons, 1.45 tons, 0.87 tons, 0.69 tons, 0.59 tons, and 0.5 tons of standard coal per 10,000 yuan, respectively. These data show a consistent decline in energy intensity, with a reduction of ~73.7% from 2002 to 2022, from 1.9 tons per 10,000 yuan in 2002–0.5 tons in 2022. This trend reflects China’s ongoing improvement in energy efficiency during the export process [72], likely driven by technological advancements [73], industrial optimization, and the implementation of environmental policies [74].
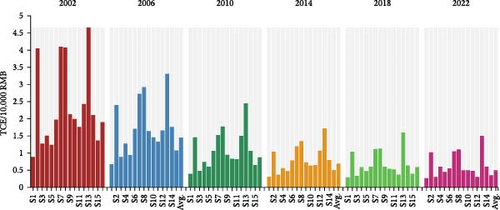
When analyzed by periods, the decline in energy intensity was 23.7% from 2002 to 2006, 40% from 2006 to 2010, 20.7% from 2010 to 2014, 14.5% from 2014 to 2018, and 15.3% from 2018 to 2022. Although energy intensity consistently decreased, the rate of decline gradually slowed. After 2014, the annual average reduction decelerated significantly from 20% to 15%. This suggests that while energy efficiency improvements continue [75], they have reached a relatively stable level, likely due to technological limitations [76], changes in the policy environment [77], or industrial restructuring [78].
From 2002 to 2022, China made significant progress in reducing export trade energy intensity, reflecting improvements in energy efficiency [74]. However, as energy intensity approaches a lower threshold, further reductions may become incremental, indicating that future cuts will likely depend on innovative technological breakthroughs and deeper industrial transformations [72].
4.1.2. Industry Heterogeneity Analysis
Analysis of China’s export trade energy intensity across sectors reveals distinct patterns of high-, medium-, and low-energy consumption. High-energy sectors, including mining (S2), petrochemicals (S7), and metal smelting (S8), are characterized by significant energy use. For instance, energy intensity in mining decreased from 4.05 tons of standard coal per 10,000 yuan in 2002 to 1.02 tons in 2022, though it remains high. Similarly, petrochemicals saw a reduction from 4.095 to 1.05 tons, reflecting substantial efficiency gains driven by technological advances and policy reforms. Despite these improvements, these sectors still rely heavily on energy, indicating the need for further optimization. Energy intensity in metal products (S8) fell from 4.08 to 1.1 tons, signaling the potential for continued efficiency gains.
Medium-energy sectors, such as food and tobacco (S3), textiles and leather (S4), paper and educational supplies (S6), and machinery manufacturing (S9), exhibit moderate energy consumption. For example, energy intensity in food and tobacco decreased from 1.28 tons in 2002 to 0.3 tons in 2022, signaling significant production improvements. The textile and leather sector also showed reductions, from 1.51 to 0.6 tons, yet still falls within medium consumption, suggesting additional potential for energy-saving technologies. Similarly, energy intensity in paper production declined from 1.97 to 0.55 tons and in machinery manufacturing from 2.13 to 0.5 tons, reflecting ongoing technological breakthroughs.
Low-energy sectors, such as electronics (S11), waste and miscellaneous manufacturing (S12), and construction (S14), are generally characterized by high-value, technology-intensive goods. For example, energy intensity in wood and furniture manufacturing decreased from 1.24 to 0.45 tons, while transportation equipment manufacturing fell from 1.99 to 0.5 tons, driven by technological upgrades. Electronics saw a reduction from 1.76 to 0.48 tons, and waste manufacturing dropped from 2.43 to 0.3 tons, demonstrating effective recycling and green manufacturing practices. The construction sector’s energy intensity decreased from 2.11 to 0.6 tons, likely due to the adoption of green building technologies.
Overall, China’s export trade sectors have seen significant reductions in energy intensity, driven by technological progress [79], industrial restructuring [80], and supportive energy policies [81]. However, high-energy sectors continue to consume substantial energy, necessitating ongoing innovation and policy measures to achieve deeper efficiency gains [82].
4.2. Energy Consumption in China’s Export Trade
4.2.1. Totality Analysis
Using Equations (5) and (6), the energy consumption of China’s export trade by sector and total export trade energy consumption over the years, as shown in Figure 4, was calculated. From 2002 to 2022, China’s total export trade energy consumption followed a clear trend.
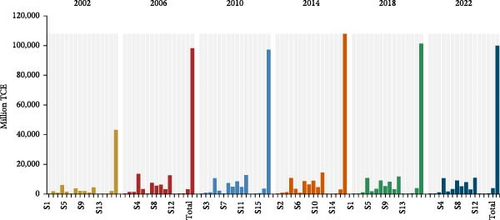
From 2002 to 2006, energy consumption surged by 127.3%, from 43,288.35 to 98,391.31 thousand tons of standard coal, reflecting rapid export expansion driven by energy-intensive industries. From 2006 to 2010, it decreased by 1%, reaching 97,384.2 thousand tons due to the global financial crisis and sectoral energy efficiency improvements. Between 2010 and 2014, consumption rose by 10.9%, driven by the continued dominance of high-energy sectors. From 2014 to 2018, it decreased by 6.1% to 101,374.72 thousand tons, reflecting energy efficiency improvements and policy-driven restructuring. From 2018 to 2022, it fell by 1.4% to 100,000 thousand tons, indicating further green transformation.
Despite a declining share in domestic energy consumption, export trade energy consumption remains above 20% [83], highlighting the ongoing importance of energy conservation in China’s export sector.
4.2.2. Industry Heterogeneity Analysis
Energy consumption in China’s export trade varies significantly across sectors. From 2002 to 2022, energy-intensive industries, such as textiles and leather (S4), petrochemicals (S7), and metal and mineral products (S8), continued to dominate export energy consumption, with substantial increases in their energy usage. For instance, the textile industry’s energy consumption rose from 61.03 million tons of standard coal in 2002 to 108 million tons in 2022, and the petrochemical sector’s consumption increased from 37.67 million tons to 92 million tons. This highlights the persistent energy dependence of these industries, which, despite efforts to enhance technological upgrades and energy efficiency, remain highly energy-intensive.
In contrast, sectors like agriculture (S1) and wood furniture (S5) have shown a consistent decline in energy consumption, reflecting improvements in energy efficiency and greener production practices. Additionally, some high-tech industries, such as electronics (S11) and machinery manufacturing (S9), have achieved notable energy efficiency gains. For example, energy consumption in the electronics sector grew from 45.35 million tons of standard coal in 2002 to 110 million tons in 2022, reflecting both industry growth and technological advancements that have enhanced energy efficiency.
Despite these improvements, the continued robust demand from energy-intensive sectors has driven significant growth in overall energy consumption [84]. This underscores the untapped potential for further energy efficiency improvements [85]. Moving forward, achieving sustainable development will require accelerated industrial restructuring [80], promotion of green technological innovation [86], and enhanced energy utilization efficiency [87].
4.3. Analysis of Decoupling and Influencing Factors
4.3.1. Totality Analysis
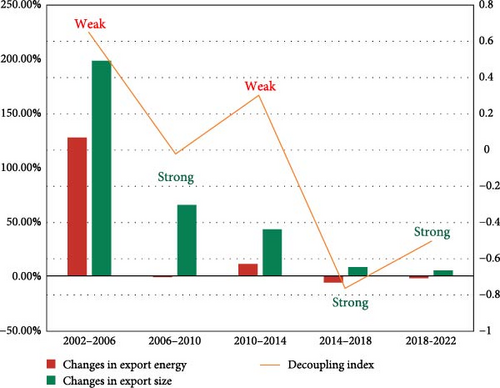
Using Equation (7), the decoupling indices of export growth and energy consumption for China’s export sectors across various stages are calculated and shown in Figure 5.
- 1.
2002–2006: Weak Decoupling
-
From 2002 to 2006, China’s export trade energy consumption increased by 127.29%, while export volume rose by 197.85%. Despite export growth outpacing energy consumption, resulting in a DI of 0.64, the trend remains weak. The substantial rise in energy consumption suggests that China did not fully achieve energy reduction during this period [88]. Despite the export trade expansion, energy efficiency did not significantly improve [89].
- 2.
2006–2010: Strong Decoupling
-
Between 2006 and 2010, export energy consumption decreased by 1.02%, while export volume grew by 65.21%. With a DI of −0.02, this period reflects strong decoupling. The reduction in energy consumption alongside export growth suggests that China successfully decoupled export growth from energy use through technological advancements and industrial restructuring [90]. Policy support, innovation, and efficient production methods likely contributed to this shift [91].
- 3.
2010–2014: Weak Decoupling
-
In this period, export energy consumption rose by 10.90%, while export volume grew by 42.86%. Despite the moderate energy consumption increase, the larger growth in export volume resulted in a DI of 0.3, indicating weak decoupling. Though technological progress and management improvements enhanced energy efficiency [92], energy consumption largely followed export volume growth, limiting the decoupling effect [93].
- 4.
2014–2018: Strong Decoupling
-
From 2014 to 2018, export energy consumption declined by 6.13%, while export volume increased by 8.05%. With a DI of −0.76, this period exhibited strong decoupling. The notable separation between export growth and energy consumption suggests that efficient technologies [94, 95], energy-saving policies [96], and industrial restructuring [97] drove this shift.
- 5.
2018–2022: Strong Decoupling
-
Between 2018 and 2022, export energy consumption decreased by 2.00%, while export volume grew by 5.00%. The DI of −0.5 indicates strong decoupling, continuing China’s efforts in energy conservation and demonstrating further decoupling of export growth from energy consumption [98].
- 6.
Discussion
-
From 2002 to 2022, China’s export trade transitioned from weak to strong decoupling. Strong decoupling occurred between 2006–2010 and 2014–2022, driven by technological advancements, industrial restructuring, and policy initiatives. While decoupling was weak in the earlier periods, technological and policy advances allowed for greater energy efficiency, reducing the energy dependence of export trade [99, 100].
Future trends are likely to continue strong decoupling, driven by high-efficiency technologies and green industrial policies [101]. As energy consumption continues to decline and export volume steadily increases, China may achieve a more sustainable and efficient export growth model [102, 103].
4.3.2. Industry Heterogeneity Analysis
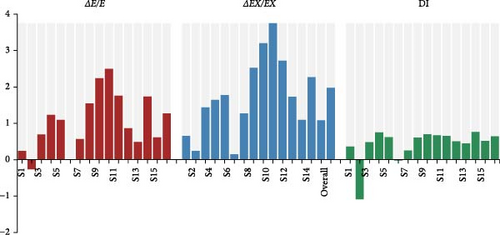
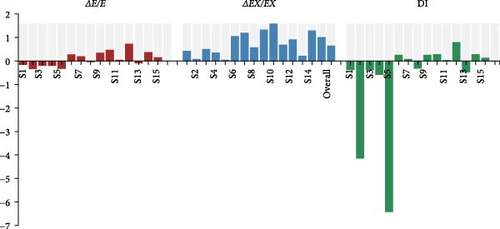
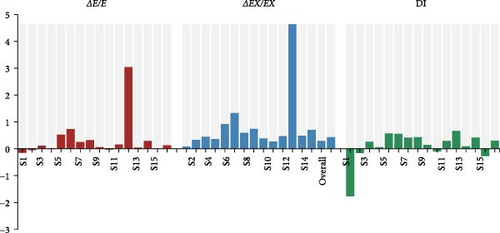
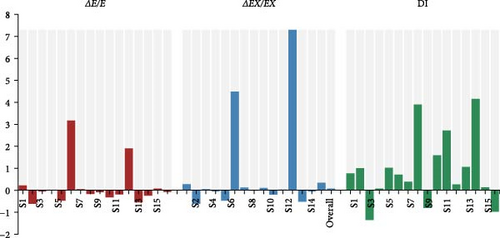
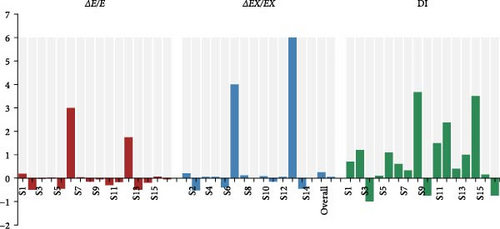
China export-energy decoupling by industry indicators is shown in Figure 6.
- 1.
2002–2006: Weak Decoupling
-
During this period, most sectors exhibited weak decoupling, with energy consumption still closely tied to export growth. Notably, sectors like S1 (basic and energy-intensive industries) showed a significant correlation between export growth (0.66) and energy consumption (0.24), resulting in a DI of 0.36. This indicates that despite some energy efficiency improvements, China remained highly dependent on energy consumption, even though the correlation with export growth weakened.
-
S8 (information transmission, software, and IT services) demonstrated weak decoupling, with low energy demand coupled with robust export growth. In contrast, S2 (manufacturing) and S5 (heavy or traditional industries) showed strong decoupling (DI = −1.09 and −0.62, respectively), indicating energy-saving measures and reduced energy consumption despite sectoral expansion. The overall growth in export energy consumption remained significant, but the expansion of export volumes was more pronounced, with most sectors showing weak decoupling.
- 2.
2006–2010: Strong Decoupling and Sector Differentiation
-
Between 2006 and 2010, decoupling improved across sectors, with energy consumption growing more slowly than export growth. Stricter energy consumption controls and optimized resource allocation were key drivers. Sectors like S2 (DI = −4.15) and S5 (DI = −6.43) exhibited strong decoupling, reflecting technological upgrades and structural optimization. S2 (manufacturing) continued to show strong decoupling, where export growth occurred without a proportional increase in energy consumption, reflecting a shift to more energy-efficient, lower-energy manufacturing. S5 (transportation) also demonstrated strong decoupling, with technological innovations reducing energy consumption despite sector expansion. S3 (electronics and light industries) showed weak decoupling, with rising export volumes but stable or declining energy consumption. S4 (construction) and S7 (services or consumer goods) also showed strong decoupling. S6 (electricity, heat, gas, and water production) moved to weak decoupling, with higher energy demand still partially linked to export growth.
- 3.
2010–2014: Predominantly Weak Decoupling, Some Industry Convergence
-
This period saw a slight strengthening of the connection between energy consumption and export growth amid slowing economic growth. China implemented more energy-saving policies and pushed for industrial restructuring. Key sectors like S2 and S9 exhibited weaker decoupling indices, with S2 (DI = −0.16) maintaining weak decoupling despite energy consumption growth, indicating a more complex relationship between manufacturing energy consumption and export growth.
-
S8 (high-tech or green industries) transitioned to strong decoupling (DI = 3.90), reflecting the effectiveness of green technologies and energy-saving measures. S3 (mining and metal smelting) showed weak decoupling, signaling a diminishing connection between energy consumption and export growth. S5 and S13 (raw materials or resource-dependent sectors) exhibited stagnation, with energy efficiency improvements insufficient to meet demand, leading to weaker decoupling.
- 4.
2014–2018: Acceleration of Strong Decoupling
-
During this period, decoupling accelerated, with energy consumption weakening in relation to export growth. Policy guidance and economic transformation played pivotal roles. Sectors like S8 (DI = 3.67) demonstrated strong decoupling, reflecting a successful transition to low-energy, high-value-added products.
-
S5 and S2 showed stagnation (DI = 1.02 and 1.20), continuing to rely on energy consumption despite sector expansion. S3 and S4 exhibited negative decoupling (DI = −0.81 and −1.35), indicating that energy consumption was increasingly constraining export growth.
- 5.
2018–2022: Continued Strong Decoupling
-
The trend of strong decoupling continued, especially in high-tech industries and services, where energy consumption stabilized. Sectors like S8 and S9 (emerging industries and services) demonstrated continued strong decoupling, with S8′s DI reaching 3.67, highlighting significant industry upgrades and improved energy efficiency. Green technologies and green economics became key drivers of export growth.
-
S2 and S5, traditional resource-based sectors, remained in stagnation (DI = 1.20 and 1.10), where export growth did not sufficiently control energy consumption growth, reflecting challenges in their green transformation. S9 (finance) exhibited strong decoupling, showing the separation between high-value-added service exports and low energy demand. Other sectors, such as S1, S3, and S10, demonstrated weak decoupling (DI below 0.7), suggesting limited energy efficiency improvements despite technological adjustments.
- 6.
Discussion: Summary and Future Trends
-
Strengthening Decoupling. China’s decoupling of energy consumption from export growth has become increasingly pronounced, especially in high-tech and service sectors [104]. With enhanced green economy policies and energy efficiency measures, this trend is expected to accelerate, driven by service industries, high-tech manufacturing, and clean energy sectors [99]. Resource-dependent and energy-intensive industries must adapt swiftly to avoid significant development pressures [100]. Sectoral heterogeneity will expand, with energy-saving and technological advancements defining future economic roles [105].
-
Decoupling Phases. The weak decoupling phase occurred mainly from 2002 to 2006 when many energy-intensive industries remained closely tied to export growth [106]. A shift to strong decoupling emerged between 2006–2010 and 2014–2018, particularly in low-energy-consuming sectors like information technology and finance [107]. However, sectors like manufacturing and transportation displayed convergence, where energy efficiency improvements lagged behind production and transportation demand expansion [108].
-
Green Transformation and Technological Innovation. The strong decoupling trends in high-tech and green industries underscore the crucial role of technological innovation and green policies in driving future growth [109]. These sectors, through enhanced energy efficiency and the adoption of energy-saving technologies, can reduce energy dependence and decouple export growth from energy consumption [110]. Conversely, resource-dependent sectors (e.g., S2 and S5) face stagnation or negative decoupling, indicating significant challenges in their green transformation [111]. Accelerating structural adjustments and fostering green transformation will be essential for sustainable development [112].
4.4. Decoupling Drivers Analysis
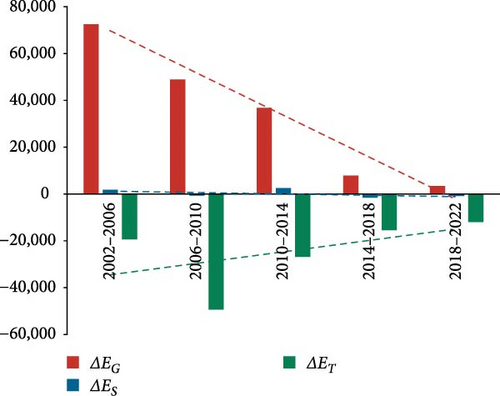
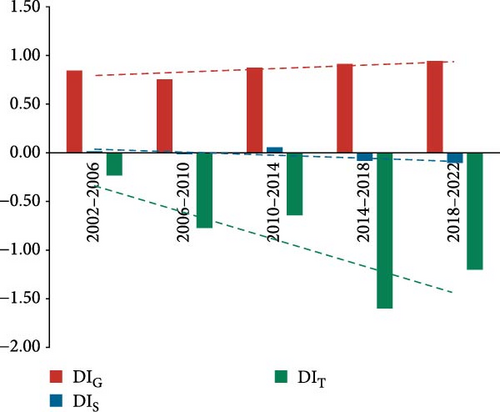
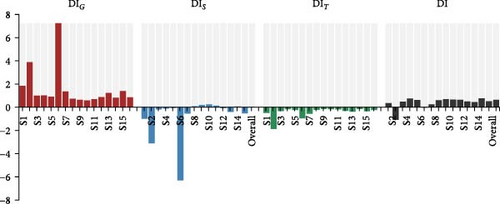
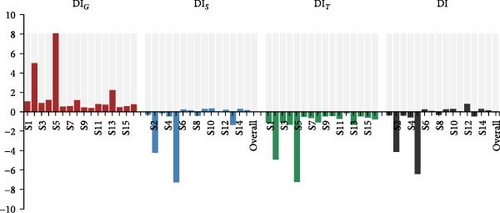
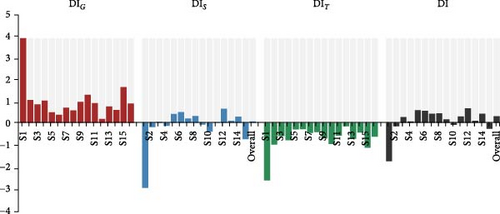
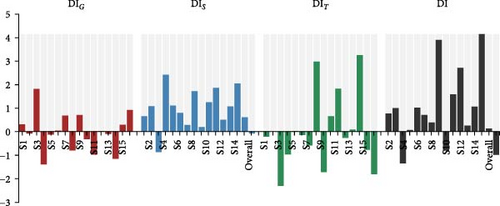
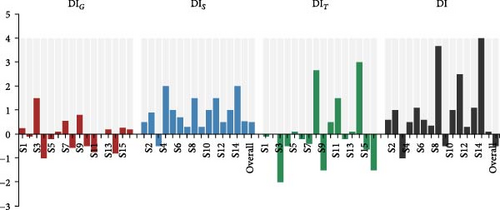
Using the LMDI model decomposition, the decoupling indices in Figures 7 (overall) and 8 (by industry) are derived, highlighting the impacts of export scale, structure, and energy intensity.
4.4.1. Totality Analysis
- 1.
Export Scale Effect
-
In all periods, the export scale effect consistently exerts a positive influence, indicating that the expansion of exports has continuously driven energy consumption. During the early phase (2002–2006), the export scale effect was the primary factor contributing to the rise in energy consumption. However, this effect gradually diminished after 2010, particularly after 2014, when the growth rate of energy consumption notably slowed. This reflects the impact of export structure optimization and improved energy efficiency.
- 2.
Export Structure Effect
-
The export structure effect varied significantly across periods. From 2002 to 2010, the export structure effect exerted a modest positive influence on energy consumption. However, between 2010 and 2022, with the rise of high-tech and low-energy industries, the export structure effect shifted to a negative impact on energy consumption.
- 3.
Energy Intensity Effect
-
The energy intensity effect is the key driver of decoupling across all periods. Especially after 2010, energy efficiency improved significantly, with technological innovations and industrial optimization effectively reducing energy demand. The substantial improvement in energy intensity has been the primary force driving the decoupling of energy consumption. The negative shift in energy intensity has greatly slowed down energy consumption, illustrating the pivotal role played by technological progress and green development policies. As energy efficiency has advanced, the decoupling between energy consumption and export growth has deepened.
- 4.
Summary and Discussion
-
Thus, it means that: (1) During 2002–2006, the export scale effect was the main driver, with energy consumption closely tied to export growth, as energy intensity was still negative. (2) In 2006–2010, the significant improvement in energy intensity demonstrated that technological progress considerably reduced energy consumption, while the export structure effect turned negative. (3) From 2010 to 2022, with the progress of economic transformation and green development policies, the energy intensity effect continued to play a dominant role, and the impact of both the export structure and export scale effects on energy consumption weakened, accelerating the decoupling of energy consumption.
China has made substantial progress in decoupling export trade from energy consumption. Looking ahead, technological innovation, industrial restructuring, and green development policies are expected to further accelerate this decoupling [113]. Technological advancements enable more efficient energy use and new energy-saving technologies [114]. Industrial optimization shifts the economy toward less energy-intensive sectors [115], while green policies promoting renewable energy and efficiency will sustain this trend and ensure environmental sustainability [116, 117].
4.4.2. Industry Heterogeneity Analysis
- 1.
2002–2006: Weak Decoupling
-
During this period, the export scale effect (DIG) positively influenced decoupling (0.85), while both the export structure effect (DIS) and energy intensity effect (DIT) acted as inhibiting factors (−0.23 and −0.02, respectively). This indicates that export scale expansion was the dominant driver of decoupling, leading to a significant separation between energy consumption and export growth.
-
Key Sectors: S2 (Energy and Resource Industries): DIG was 3.89, substantially higher than in other sectors, highlighting the strong decoupling effect driven by export scale expansion. However, both DIS (−3.12) and DIT (−1.87) indicated considerable resistance to decoupling due to the energy-intensive nature of these industries.
-
S6 (Chemical Products): DIG was 7.24, demonstrating a strong export scale effect, but DIS (−6.31) and DIT (−0.95) suggested that the energy intensity effect significantly hindered decoupling in this sector.
- 2.
2006–2010: Weak Decoupling
-
In this phase, the overall decoupling trend weakened (DI ≈ 0.02), primarily due to the negative impacts of the export structure effect (DIS = −0.77) and a more pronounced negative energy intensity effect (DIT = −0.64).
-
Key sectors: S5 (Machinery and Transport Equipment): DIG was 8.08, showing a strong positive effect from export scale expansion. However, both DIS (−7.27) and DIT (−7.23) were negative, indicating that the sector’s energy-intensive export structure and high energy consumption significantly impeded decoupling.
-
S8 (Electronics and Communications Equipment): DIG was 0.82, a moderate value compared to other sectors, with both DIS and DIT negative, indicating limited decoupling success due to structural adjustments and energy consumption inefficiencies.
- 3.
2010–2014: Slight Positive Decoupling With Resistance
-
During this period, decoupling (DI = 0.3) showed a slight positive trend, primarily driven by export structure adjustments (DIS = 0.06), though significant resistance remained due to the energy intensity effect (DIT = −0.64).
-
Key sectors: S6 (Chemical Products): DIG was 0.36, reflecting a slowdown in export scale expansion. Both DIS (−0.3) and DIT (−0.55) were negative, indicating that decoupling was still constrained by energy efficiency issues and the export structure.
-
S7 (Metal Products): DIG was 0.59, indicating positive performance in the export scale. However, with DIS (0.29) and DIT (−0.37), improvements were observed in both export scale and structural adjustments, though challenges remained.
- 4.
2014–2018: Acceleration of Negative Decoupling
-
In this period, the DI experienced a significant decline (DI = −0.98), primarily driven by the negative energy intensity effect (DIT = −1.81).
-
Key sectors: S9 (Chemical Industry): Both DIG and DIS were negative (−3.27 and −4.16, respectively), while DIT reached 10.12, indicating significant adverse impacts on decoupling due to the high energy intensity of the sector.
-
S15 (Electronics and Information Products): DIG was 0.78, DIS was 0.09, and DIT was −2.94, revealing that structural and energy intensity factors continued to play a significant role in hindering decoupling.
- 5.
2018–2022: Continued Strong Decoupling With Challenges
-
During this period, the overall DI was −0.5, indicating that the economy continued to face substantial decoupling pressures, particularly from the energy intensity effect (DIT = −1.5) and the export structure effect (DIS = 0.5).
-
Key sectors: S9 (Chemical Products): DIT was 9, and DIS was 3.5, reflecting continued deterioration in decoupling due to the energy intensity effect.
-
S14 (Public Services—Power, Gas, and Water Production): The export scale effect (DIG) was −2, indicating growing negative impacts from energy consumption on the decoupling process.
- 6.
Summary
-
In summary, between 2002 and 2022, the positive influence of the export scale effect (DIG) on decoupling gradually weakened, while the negative effects of both the export structure effect (DIS) and energy intensity effect (DIT) became more pronounced, leading to a decline in the overall decoupling effects in the later period (2014–2022). Energy-intensive industries, such as chemicals and metals, experienced considerable limitations in their decoupling progress due to inadequate structural adjustments and slow improvements in energy efficiency, despite rapid growth in export scale.
5. Conclusions and Policy Implications
5.1. Conclusions
- 1.
Despite a decreasing share of total domestic energy consumption, China’s export trade continues to exert substantial energy demand. Energy consumption within the export sector remains significant, accounting for a considerable portion of domestic energy use, underscoring the critical need for energy efficiency improvements to ensure the long-term sustainability of trade.
- 2.
From 2002 to 2022, China made significant strides in decoupling export growth from energy consumption. Notable reductions in energy intensity occurred between 2002 and 2014, with continued progress despite a slowdown post-2014. Technological advancements, industrial restructuring, and energy-saving policies were key drivers, though further improvements are needed, particularly in energy-intensive sectors.
- 3.
Energy intensity reductions were the primary driver of decoupling, followed by export scale shifts, while trade structure changes had a lesser impact. Technological innovation, industrial restructuring, and green policies were key factors in decoupling, enabling energy efficiency improvements, and fostering a shift to less energy-intensive sectors.
Despite progress, energy-intensive sectors like chemicals and metals struggled with slow structural adjustments and high energy intensity, limiting full decoupling. These insights guide policymakers in promoting sustainable trade and energy efficiency.
5.2. Policy Implications
5.2.1. Enhance Energy Efficiency in Export Sectors
The study demonstrates that, while China’s export trade has reduced its share of total domestic energy consumption, it continues to exert substantial energy demand. To address this, improving energy efficiency in export sectors should be a top priority. Moreover, it is essential for trade policies to be harmonized with environmental goals to effectively decouple export growth from energy consumption. Governments should implement policies such as green tariffs, carbon pricing mechanisms, and low-carbon export incentives to promote energy-efficient trade practices [118]. These measures will not only stimulate green trade but also ensure that export growth does not exacerbate energy consumption. For international relevance, similar policies should be adopted globally, taking into account the unique needs and capacities of different countries, especially in sectors with high energy intensity.
5.2.2. Promoting Technological Innovation and Structural Shifts
The findings underscore that reductions in energy intensity and shifts in export scale have been the primary drivers of decoupling. To sustain and accelerate this progress, governments worldwide must foster technological innovation that enhances energy efficiency and facilitate structural shifts toward low-carbon industries. This includes investing in green technologies, optimizing supply chains, and incentivizing sectors that prioritize sustainability. Policymakers should also support the transition to cleaner and more energy-efficient export production by introducing targeted incentives, such as tax breaks for sustainable technologies and subsidies for clean energy solutions [119]. Moreover, structural transformation should be supported with strategic policies that encourage industries to embrace energy-efficient practices, particularly in emerging economies where industrialization presents both opportunities and challenges for energy management.
5.2.3. Encourage Global Cooperation and Data Transparency
The decoupling process is driven by multiple interdependent factors, necessitating international collaboration to achieve sustainable trade and energy outcomes. Global trade agreements must incorporate rigorous standards for energy efficiency, facilitating cross-border cooperation on green technologies and sustainable practices. Additionally, to support effective decision-making, governments should promote data transparency by developing standardized reporting frameworks that track energy consumption and emissions across export sectors. Transparent data will empower businesses to enhance their energy performance and help policymakers evaluate the progress of sustainability targets [120]. Such international data-sharing initiatives would also foster a more cooperative global approach to achieving energy and environmental goals. Promoting data accessibility and transparency is critical for global sustainability, especially as trade and environmental policies increasingly intersect in a globalized economy.
5.2.4. Driving Green Transformation in Resource-Intensive Sectors
The study identifies the persistent challenges faced by energy-intensive sectors, such as chemicals and metals, in achieving decoupling. For these sectors, accelerating structural adjustments and driving green transformation are essential for aligning export growth with sustainability goals. Governments should develop sector-specific policies that focus on improving energy efficiency, reducing emissions, and encouraging low-carbon technological adoption. This may involve stricter environmental standards, financial incentives for adopting green technologies, and targeted investments in research and development (R&D) for energy-intensive industries. For global applicability, these policies should recognize the varying energy profiles of different countries and tailor approaches to the specific needs of each sector and region, particularly in developing countries where industrial capacity and green technology adoption may differ.
5.2.5. Integrate Green Supply Chain Management
To further decouple export growth from energy consumption, countries should foster the integration of green supply chain management (GSCM) practices in export sectors [121]. This includes adopting circular economy principles, optimizing resource use, and reducing waste throughout the production process. Governments can incentivize businesses to implement sustainable supply chain practices through regulatory frameworks, certification programs, and trade incentives. In turn, this will promote the development of sustainable trade ecosystems that prioritize environmental sustainability at all stages of production and trade. Global cooperation in establishing uniform standards for sustainable trade practices will be crucial in creating a level playing field that supports both economic growth and environmental protection.
In conclusion, building on China’s experience, these policy recommendations hold broad applicability in the global context. Key strategies for achieving long-term decoupling of export growth from energy consumption include fostering international cooperation, driving technological innovation, improving energy efficiency, and promoting structural shifts toward sustainable industries. By addressing sector-specific needs, periodically reassessing policy effectiveness, and aligning with overarching goals of energy efficiency, China and other countries can make significant strides toward sustainable economic growth and reduced environmental impact. These strategies offer valuable lessons for nations aiming to balance economic development with environmental sustainability globally.
5.3. Research Limitations and Future Outlook
This study offers valuable insights into the decoupling of China’s export trade growth from energy consumption, but several limitations merit consideration. First, the reliance on aggregate sectoral data may obscure intra-sectoral variations in energy efficiency. Future research should examine more granular data at the firm or product level to better understand energy consumption drivers within specific export sectors. Additionally, the focus on China limits the generalizability of findings; comparative studies across diverse economies with varying levels of industrialization and energy infrastructure would provide a broader perspective on global export energy decoupling.
Looking ahead, there is potential to expand this research by incorporating other dimensions of sustainability, such as the social and environmental impacts of trade. Future studies could explore how China’s export trade aligns with broader sustainability goals, including social equity and environmental justice. Moreover, research should examine the dynamic interplay between trade policies, energy consumption, and environmental regulations, particularly in relation to emerging green trade policies like carbon border adjustments (CBAMs) [122].
Conflicts of Interest
The authors declare no conflicts of interest.
Funding
This article is a phased result of the following research projects: the Xinjiang Uygur Autonomous Region Social Science Fund project “Research on Labor Employment and the Matching of Labor-Intensive Industries in the Four Prefectures of Southern Xinjiang” (22BJY022); the bidding project of the Research Center for High-Quality Industrial Development in the Core Area of the Silk Road Economic Belt at Xinjiang Normal University, titled “Evaluation of the Multi-Party Cooperative Network Structure, Influencing Factors, and Effects of Xinjiang’s Cotton and Textile Industry Clusters” (ZK202324C); the Shanghai Philosophy and Social Sciences Planning Youth Project “A Study on Mechanisms and Pathways for Enhancing the Resilience of Shanghai’s Manufacturing Industry Chain through the Integration of Digital and Real Economies” (2024EJB013); the Fujian Social Science Foundation project “Opportunities and Challenges of the Elderly Population Dividend under the Dual Background of Digital Economy Development and Delayed Retirement” (FJ2023C040); and the Fujian Natural Science Foundation project “A Multi-Path Impact and Countermeasure Study on Labor Supply under the Background of Delayed Retirement from the Perspective of Two-Way Intergenerational Time Transfer” (2023J05167).
Endnotes
Open Research
Data Availability Statement
The data will be made available by the corresponding authors upon reasonable request.
- 1Available at National Bureau of Statistics of China, https://data.stats.gov.cn/ifnormal.htm?u=/files/html/quickSearch/trcc/trcc01.html&h=740.
- 2The WIOD is available at https://www.rug.nl/ggdc/valuechain/wiod/wiod-2016-release.
- 3The exchange rates used for converting WIOD data to RMB are: 2002, 2006, 2010, and 2014 at 1 USD = 8.2770, 7.9718, 6.7695, and 6.1428 RMB, respectively, sourced from the People’s Bank of China (2002, 2006) and exchange-rates.org (2010, 2014).
- 4Available at https://data.stats.gov.cn/.


