Two-Stage Optimal Operation of Integrated Energy System Considering Electricity–Heat Demand Response and Time-of-Use Energy Price
Abstract
Integrated energy systems (IESs) can realize the conversion and complementarity of various energy sources, which provides opportunities and challenges for the energy market. Considering that the user’s energy consumption is affected by the energy price difference, there is a problem that the new energy output in the comprehensive energy system does not fully match the user’s energy demand period. In order to solve the above problems, this paper proposes a two-stage optimization model of “open source and reducing expenditure” to give full play to the potential of multiple energy sources on the load side to participate in demand response (DR) and combine low-carbon technology and market mechanisms to realize the low-carbon economic operation of the comprehensive energy system. In the first stage, a collaborative optimization strategy for electric and thermal DR is constructed from the aspect of “reducing expenditure,” a comprehensive load fuzzy DR mechanism based on the logistic function is constructed for electric load, and the load curve and time-of-use (TOU) energy price are optimized considering the coupling characteristics of user energy consumption, and nondominated sorting genetic algorithm (NSGA-II) solution to achieve peak shaving and valley filling. In the second stage, a joint operation model of carbon capture power plant (CCPP) and power-to-gas (P2G) equipment is built from the aspect of “open source,” and the ladder-type carbon trading mechanism is considered to rationalize the unit output and achieve low-carbon emission reduction. The calculation results obtained through examples show that the total cost of the model is slightly reduced by 5.44%, but the actual total carbon emission of the system is greatly increased by 50.73%. It proves that the high-carbon power plant transformation and TOU energy price optimization strategy are effective for the low-carbon economic operation of the system and realize both economic benefits and benefits of the system.
1. Introduction
The intensification of global pollution and the rapid development of renewable energy technology have brought about changes in the world’s energy structure. As one of the industries with a large proportion of greenhouse gas emissions in the energy industry, the power industry not only undertakes the important task of maintaining the stable operation of the power grid, but also shoulders the great mission of realizing the national “double carbon” goal [1]. As a new type of energy service form, an integrated energy system (IES) takes electricity as the main body, combines energy conversion equipment to couple multiple energy sources, gives full play to the complementary advantages of multiple energy sources, and realizes the goals of energy cascade utilization, optimal allocation of resources, and improvement of renewable energy consumption. It is one of the keys to transforming energy into a more diversified and clean direction [2].
The emergence of the energy crisis has accelerated the research and application of IES. At present, scholars from all over the world have carried out research on how to effectively solve the problems of low energy utilization rates and severe pollution faced by the world. The specific solutions mainly start from two aspects: “open source” and “reducing expenditure” [3]. “Open source” refers to replacing nonrenewable fossil energy with renewable energy, represented by wind power (WT), thermal power, and hydropower, to protect the national society and economy. Wang et al. [4] proposed a regional IES economic optimal scheduling model with the system’s total cost as the objective function, which realizes the economic operation of the system. Mohamed et al. [5] proposed a high-efficiency hydropower scheduling strategy and proved its effectiveness in low-carbon economic operations. Dai et al. [6] proposed the IES economic dispatch model considering heat transfer constraints combined with thermal energy storage to improve the WT consumption of the system. Zlotnik et al. [7] proved that the application of combined electric and thermal systems can improve the flexibility of power system operation control. On this basis, Li et al. [8] established an IES optimal dispatching model, including the combined operation of WT and cogeneration units, which improved the renewable energy consumption rate. The above research has the advantages of energy complementarity, but it does not fundamentally solve the problem of system carbon emission reduction. Carbon capture system (CCS) technology can further improve the effect of carbon emission reduction, providing a new opportunity for the low-carbon operation of IES. Ma et al. [9] proposed a combined heat and power (CHP)–CCS–power-to-gas (P2G) joint operation model, which can enhance the consumption capacity of renewable energy, the carbon emissions of IES, and the operating cost. In this paper, the high-carbon unit transformation is carried out on the source side, and the energy flow between carbon capture power plant (CCPP)–P2G units is studied, as well as the coordinated and optimized operation model between CCPP–P2G and the IES.
New energy power generation represented by WT and photovoltaics is intermittent and cannot quickly respond to the changing demand on the load side [10]. The output of new energy sources such as WT cannot fully match the energy demand time of the load side users, which makes the system have high wind and light curtailment rate, poor environmental and economic benefits, and low user satisfaction [11], thus, hindering the smooth implementation of the national carbon peak and carbon neutrality strategy. In this context, demand response (DR) technology came into being, and the energy on the load side has certain flexibility and controllability. In order to formulate a complete day-ahead dispatching plan, rationally arrange the output of each unit on the IES source side and realize the “source–load” double-side win–win solution provided [12]. “Reducing expenditure” refers to energy consumption through appropriate user energy needs. Zhang et al. [13] considers the DR mechanism from the perspective of electric energy, which can improve the energy demand of users and improve the low-carbon economy of IES. In [14], price-based DR is applied to IES to meet the energy demand of users, achieving the purpose of peak shaving and valley adjustment and improving the WT consumption capacity of the system. In [15], the peak and valley time-of-use (TOU) electricity price is proposed as the DR mechanism based on electricity price to realize the peak load shifting of the power system. Zhang et al. [16] constructed a coordinated heating dispatching model considering TOU, which can effectively consume coal in the system and improve the level of WT consumption in the system. Zheng et al. [17] confirms that the application of the coupling effect model of consumer behavior can system the total cost and abandon wind and light. However, none of the abovementioned literature has considered the psychological response factors of users to the energy price difference.
To sum up, in order to achieve low-carbon emission reduction in the power system, give full play to the potential of various energy needs on the load side. In this paper, a two-stage optimization model is constructed, starting from the two aspects of “open source and reducing expenditure.” In the first stage, for the load side, the TOU is optimized based on the Logistic function to guide the user in changing the energy demand. At the same time, considering the coupling relationship between user energy consumption behavior, the heat load curve is optimized according to the heat load characteristics, and the load optimization strategy is formulated and solved by nondominated sorting genetic algorithm (NSGA-II) to realize load transfer. In the second stage, an IES with CCPP–P2G coupling is established for the source side, and a ladder-type carbon trading mechanism is added to constrain the source side to reduce carbon emissions. On the basis of satisfying the user’s load demand, the output of the unit in each period is optimized, and CPLEX is used to solve the problem and achieve both economic and environmental benefits.
2. Phase I: Electricity and Heat DR Collaborative Optimization
2.1. User DR Model Under TOU
The energy consumption behavior of users will be affected by many factors. According to the electricity consumption of users, a scheduling cycle is divided into three sections: peak, flat, and valley. By introducing TOU, users are guided to transfer their electricity demand from the peak period to the off-peak period. Based on consumer psychology, it is known that energy prices and users’ energy demand will influence each other. Under the current electricity market operation mode, the user’s electricity price is used as a signal to encourage users to adjust their energy consumption behavior, and differentiated electricity prices are formulated according to the characteristics of different electricity consumption periods. By changing the TOU difference, users are guided to adjust their energy demands, the overall smoothness of the load curve is improved, and peak shaving and valley filling are achieved, thereby, reducing the peak-shaving pressure of the system and improving the stability and economy of the system operation.
In Figure 1, the curve part represents the actual load transfer rate under different energy price differences. In the response area, as the energy price difference gradually increases, the user’s response enthusiasm is mobilized, the load transfer rate gradually increases, and it is more inclined to the optimistic response curve. The trapezoidal part of the bar graph adopts a large-scale semistep membership function, which reflects the optimistic response membership corresponding to different electricity price differences, indicating the probability that the user meets the optimistic response estimate and uses it as a probability constraint for the DR mechanism. Taking the load transfer during the peak and valley periods as an example, the comprehensive load transfer rate function model is shown in Formulas (2)–(4).
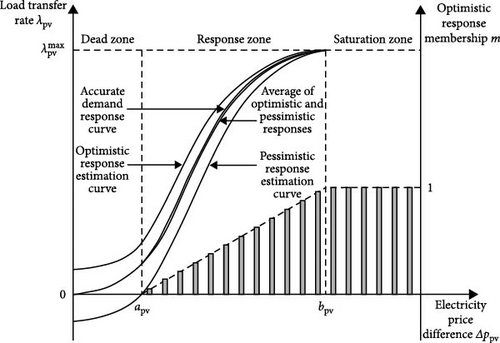
represents the actual load transfer rate from peak to valley after DR; and denote the transfer rates predicted by the pessimistic and optimistic response curves, respectively; Δppv is the peak-valley energy price difference; apv and bpv represents the price division area demarcation points, which are 0.1 and 0.7 ¥/(kW·h) respectively; Δλpv represents the load fluctuation span corresponding to the peak-valley price difference.
2.2. User DR Model Considering Heat Load Characteristics
In IES energy transmission, electric energy transmission has a fast speed and small inertia. Different from the response characteristics of electric energy transmission, the heating system is mainly composed of heat sources, heat networks, and buildings. The heat energy is transmitted from the heat source to the user side through pipelines with a certain delay. When the heating amount changes, it does not immediately affect the user’s perception of the indoor temperature, so the user’s perception of the temperature is vague and delayed [19, 20]. Drawing on the peak-valley TOU theory, the method of formulating peak-valley TOU using the price elasticity matrix is introduced into the thermal market to form a heat price elasticity matrix [21]. Since different types of loads have different sensitivities to the same price signal, the thermal load participating in DR is divided into curtailable load (CL), transferable load (TL), and replaceable load (RL).
2.2.1. CL Model
2.2.2. TL Model
2.2.3. RL Model
2.3. Electricity and Heat DR Collaborative Optimization
TOU energy prices include TOUs and TOU heat prices. Using energy prices as signals to guide users to change their energy consumption behavior will have an important impact on the peak-to-valley difference of load. Therefore, it is necessary to comprehensively consider various factors and indicators to obtain the optimal solution for formulating DR strategies. In the first stage, we first establish an objective function for the electricity load with the minimum fluctuation amplitude and the maximum user satisfaction as multiple objectives, take the TOU and electricity load as decision variables, and solve the model through the NSGA-II to achieve multiobjective optimization. The NSGA-II algorithm introduces the sorting of nondominated solutions, the calculation of crowding distance, and the elite retention strategy based on the traditional genetic algorithm, which is very suitable for solving multiobjective optimization problems and has good robustness.
- 1.
Compared with before and after implementing TOU, the total energy sales of energy sales departments and the total energy consumption of users should be ensured to fluctuate within a certain range.
- 2.
In order to avoid peak-valley reversal of electricity prices, the energy price ratio between peak and valley periods needs to be constrained within a certain range.
3. Phase II: IES Low-Carbon Economy Optimized Operation
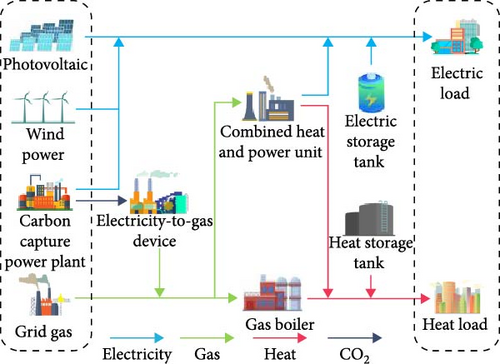
The IES structure constructed in this paper is shown in Figure 2. The source side includes CCPP and new energy power generation units. The energy coupling equipment includes a gas boiler (GB), CHP, and P2G device. The P2G device consists of an electrolyzer and a methane reactor. The energy storage equipment includes batteries (EST) and heat storage tanks (HSTs). The constructed IES includes electricity and heat loads. The electricity load is supplied by thermal power plants equipped with carbon capture devices, WT, PV, and CHP units, and the heat demand of users is supplied by CHP units and GB. The energy storage equipment can interact with the power grid and heat network, respectively, to balance the load power.
3.1. Energy Flow Model of CCPP–P2G System
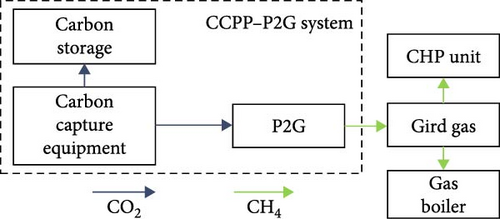
CCPP has good low-carbon characteristics and peak-shaving flexibility. Its capture process mainly includes three parts: carbon capture, regeneration, and storage. Part of the captured CO2 is stored through a compressor, and the other part can be used as high-quality raw materials to supply P2G, which solves the carbon source problem of P2G while absorbing the abandoned wind and solar power [9]. The P2G device converts electricity into natural gas through water electrolysis and methanation technology and provides it to the gas grid, thereby, achieving the recycling of CO2 [22]. Considering the use of carbon capture equipment to capture the CO2 produced by CHP, it can not only avoid the long-distance transmission and storage of CO2 but also develop a feasible range of CHP, reduce unit output, and reduce carbon emissions.
The energy consumption of the CCPP–P2G joint operation system is provided by the units involved in the dispatch, among which the carbon capture energy consumption includes the system operation energy consumption and fixed energy consumption. Fixed energy consumption is the result of changes in the structure and operating conditions of conventional coal-fired units due to the transformation of thermal power plants, which leads to loss of unit power generation efficiency, and thus, system energy consumption. It is unrelated to the operating status of the system and is regarded as a constant. The energy flow in the CCPP–P2G joint operation system is shown in Figure 3, and the model and output expressions are shown in Formulas (21)–(23).
3.2. Ladder-Type Carbon Trading Mechanism
3.3. IES Low-Carbon Economic Optimization Operation Considering CCPP–P2G and Electricity–Heat Coordinated DR
3.3.1. Objective Function
- 1.
Energy purchase costs include electricity and gas purchase costs.
- 2.
Carbon trading costs include ladder-type carbon trading costs and carbon storage costs . The formula is as follows:
- 3.
Operation and maintenance costs of wind and solar turbines [24].
- 4.
Energy sales revenue includes heat sales price and electricity sales price.
3.3.2. Constraints
- 1.
CCPP–P2G system operation constraints.
- 2.
CHP and GB operation constraints.
- 3.
Energy storage equipment constraints.
- 4.
Power balance constraints.
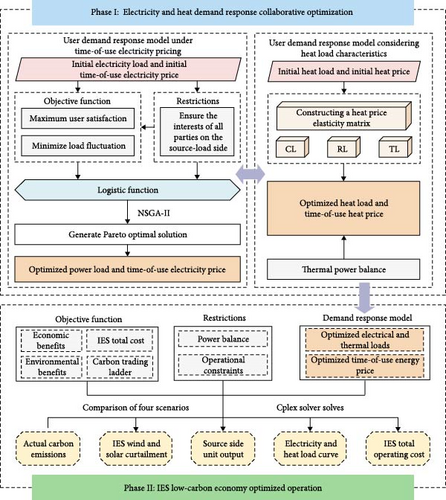
The two-stage system optimization operation process is shown in Figure 4.
4. Case Analysis
4.1. Basic Data
The parameter settings of the DR model are shown in Table 1.
| Curve name | a | b | c | μ |
|---|---|---|---|---|
| Optimistic DR forecast curve | 0.1 | 0 | 0.4 | 0.1 |
| Pessimistic DR forecast curve | 0.104 | −0.0036 | 0.4 | 0.1 |
- Abbreviation: DR, demand response.
In the IES constructed in this paper, the parameters such as the installed capacity of each unit and energy storage equipment are shown in Table 2 [25].
| Device | Parameter | Value |
|---|---|---|
| CCPP | ECCS,s,t (kW·h) | 50 |
| 26.9% | ||
| ΔEGN (kW·h) | 500 | |
| P2G | Hg (MJ/m3) | 39 |
| ηP2G | 85% | |
| ΔEP2G (kW·h) | 1000 | |
| CHP | ECHP,max/ECHP,min (kW·h) | 0/2000 |
| HCHP,max/HCHP,min (kW·h) | 0/1500 | |
| ηCHP,e/ηCHP,h | 35%/40% | |
| ΔECHP/ΔHCHP (kW·h) | 1000 | |
| GB | HGB,max/HGB,min (kW·h) | 0/1600 |
| ηGB | 80% | |
| ΔHGB (kW·h) | 500 | |
| EST | SES,max/SES,min (kW·h) | 0/100 |
| μESC,t/μESD,t | 95% | |
| HST | STS,max/STS,min (kW·h) | 0/80 |
| μTSC,t/μTSD,t | 88% | |
- Abbreviations: CCPP, carbon capture power plant; CCS, carbon capture system; CHP, combined heat and power; EST, batteries; GB, gas boiler; HST, heat storage tank; IES, integrated energy system; P2G, power-to-gas.
The system is optimized and dispatched with a complete cycle of 24 h a day. The electricity purchase price and gas purchase price are, respectively, from the literature [26, 27], the user energy consumption period division and initial energy price are shown in Table 3.
| Nature | Time division | Price (¥/(kW·h)) |
|---|---|---|
| Electricity | ||
| Peak | 8–12 h, 19–22 h | 0.8118 |
| Flat | 13–18 h, 23–24 h | 0.5713 |
| Valley | 1–7 h | 0.4438 |
| Heat | ||
| Peak | 1–8 h, 17–24 h | 0.5 |
| Flat | 9–16 h | |
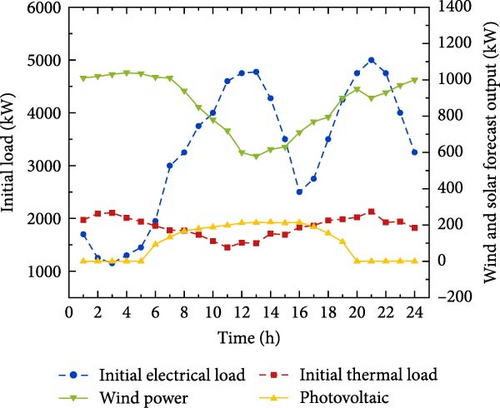
The WT and PV data are shown in Figure 5. The target energy sales department is randomly selected on a certain day to predict the user’s electricity and heat load data based on historical data, and the initial load data is shown in Figure 5.
4.2. Scenario Design
-
Scenario 1: DR optimization is not considered.
-
Scenario 2: Considering electricity DR and TOU optimization.
-
Scenario 3: Considering heat DR and TOU heat price optimization.
-
Scenario 4: Considering the DR optimization of electricity–heat coordination and TOU energy price optimization.
4.3. Example Analysis
The running results of the four scenarios are shown in Table 4.
| Scenario | Actual total carbon emissions (t) | Carbon trading costs (¥) | Wind power (WT) consumption rate (%) | Energy sales revenue (¥) | IES total cost (¥) |
|---|---|---|---|---|---|
| 1 | 72,771 | 385,149 | 91.28 | 75,374 | 20,115,166 |
| 2 | 40,427 | 338,767 | 85.55 | 75,340 | 23,294,154 |
| 3 | 43,581 | 316,122 | 87.68 | 76,914 | 22,464,276 |
| 4 | 35,854 | 276,151 | 90.89 | 76,421 | 21,208,953 |
- Abbreviation: IES, integrated energy system.
The results show that Scenario 1, without considering DR, has the highest actual carbon emissions. Scenarios 2 and 3 consider single electricity and heat DRs, respectively, compared with Scenario 1, and the total operating costs increase by 13.65% and 10.46%, respectively, and the actual carbon emissions decrease by 44.45% and 40.11%, respectively. This is because the addition of DR has tapped the flexible adjustment potential of load-side resources, and the adjustment of TOU energy prices has also increased the profits of energy sales departments. The addition of a ladder-type carbon trading mechanism can effectively constrain the system source side to reduce the output of units with higher carbon emissions and choose to use cleaner energy to meet load-side demand, taking into account both the system’s economic and environmental benefits.
Scenario 4 takes into account the coordinated optimization of electricity and heat DR. Compared with Scenarios 2 and 3, the total system operating cost is reduced by 8.95% and 5.59%, respectively, and the actual carbon emissions are reduced by 11.31% and 17.73%, respectively. The energy sales revenue increased by 1.44% compared with Scenario 2. The results show that the effective coordinated optimization of electricity and heat DR can greatly release the system’s flexible adjustment capabilities, strengthen the coupling relationship between the electricity and heat systems, coordinate the output of source-side units with the balance of electricity and heat power as a constraint, reduce system operating costs, and recycle carbon, thereby, achieving system energy conservation and emission reduction.
The comparison curve of electrical load before and after optimization is shown in Figure 6. As shown in the figure, 8:00–12:00 and 19:00–22:00 are peak hours for electricity consumption. At this time, the TOU is raised to 1.3 ¥/(kW·h), the electricity price difference increases, the user’s electricity demand decreases, and the energy demand is met by consuming other forms of energy. The load difference is the largest at 21:00. The 1:00–7:00 period is the valley period, and the TOU is reduced to 0.35 ¥/(kW·h). At this time, it is early in the morning. In order to reduce electricity costs, users can choose to avoid the peak period and charge their electric vehicles during the valley period. The average electricity demand increases by 110 kW/h, and the electricity cost is reduced by 696 yuan. As can be seen from the figure, the electric load curve after the dual-objective optimization, taking into account load fluctuations and user energy satisfaction, is smoother than the initial load curve, and the peak-shaving and valley-filling effects are obvious.
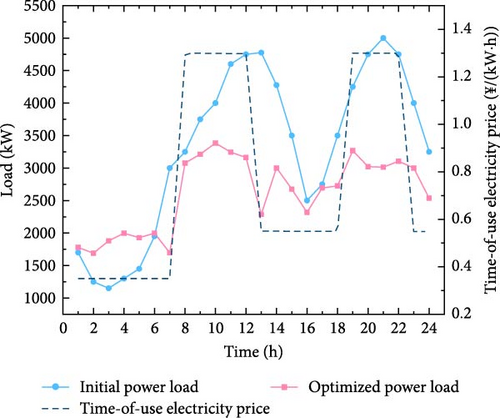
Figure 7 is a load variation curve before and after the heat load DR. As the outdoor temperature rises during the day, the demand for heat load decreases, while at night, the outdoor temperature drops compared to the daytime, and the user’s demand for heat load gradually increases. The period from 9:00 to 16:00 is divided into the nonpeak period for heat consumption, and the periods from 1:00 to 8:00 and 17:00–24:00 are the peak periods for heat consumption. The fixed heat price before optimization is 0.5 ¥/(kW·h).
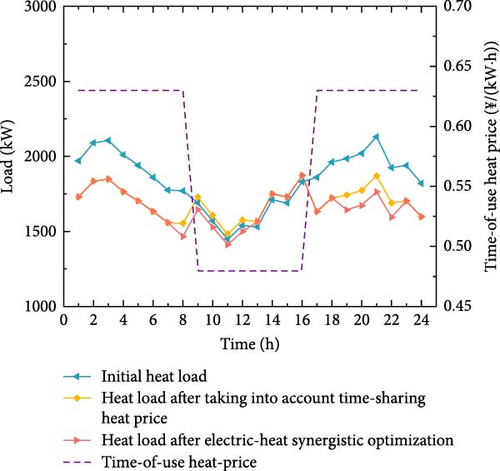
Given that the coordinated response of electricity and heat demand will change users’ energy consumption behavior, as electricity prices increase, users’ electricity demand will decrease, and part of it will be transferred to heat demand. Comparing the initial heat load with the heat load curve after taking into account the time-of-use heat price, the TOU is the price before optimization. For the peak heat consumption period, the time-of-use heat price is raised to 0.63 ¥/(kW·h), which is higher than the electricity price in normal and off-peak periods. On the premise of ensuring stable indoor temperature, users can choose to reduce heat consumption appropriately to reduce costs, reducing heat consumption by an average of 237.7 kW per period. The 13:00–16:00 period is an overlapping period when both electricity and heat loads are in nonpeak periods. The TOU heat price is reduced to 0.48 ¥/(kW·h) and is lower than the flat-term electricity price. At this time, users transfer part of their electricity demand to heat demand, so the heat load increases by 1729 kW per period on average. Comparing the heat load curves of Scenarios 3 and 4, the TOU energy price has been optimized. During the period of 7:00–13:00, the electricity load is at its peak, while the heat load is at its off-peak period. During this period, the difference between the TOU heat price and the TOU is large, so users increase their demand for heat while reducing their electricity consumption, with an average increase of 1552 kW per period. Similarly, during the period of 18:00–23:00, the heat load is at its peak and the time-of-use energy price increases, so the energy demand of users decreases.
The electrical output power balance diagrams of the four different scenarios are shown in Figure 8. Each power supply device generates electricity reasonably in each time period, which can meet the energy demand of users and the operation constraint requirements. In general, the EST is continuously charged during the low electricity price period, discharged during the peak electricity consumption period, and charged during the off-peak period, which can better meet the electricity demand during the peak period. During off-peak periods, renewable energy sources such as WT and PV are not fully absorbed. The abandoned wind and solar power are consumed by P2G devices, which increases the wind and solar power absorption rate of IES.
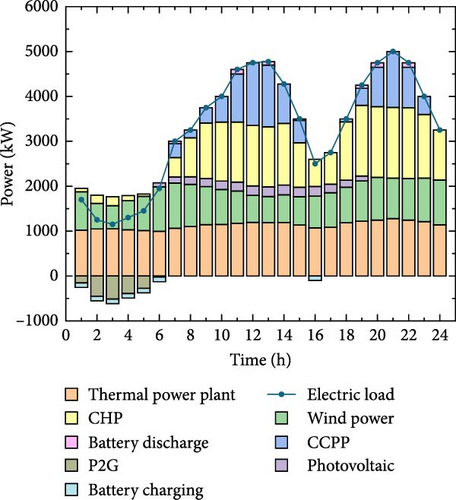
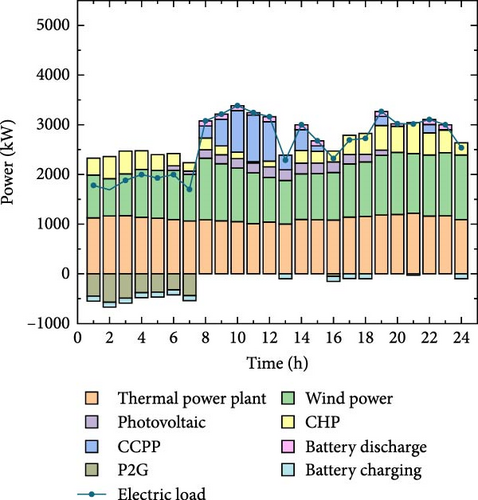
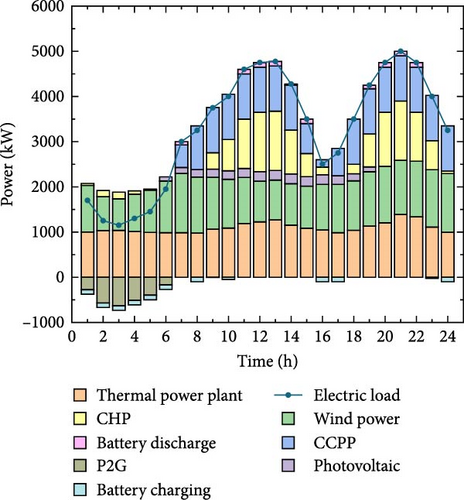
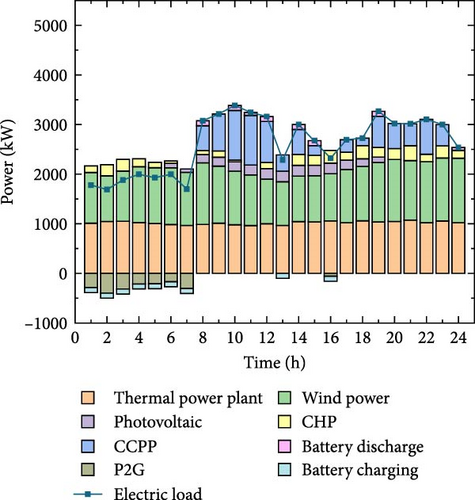
Compared with Scenario 1, Scenario 2 increased costs by 3,178,988 yuan, user electricity consumption decreased, the output of CCPP and CHP units on the source side decreased significantly, and the system emission reduction effect was obvious. Compared with Scenario 1, in Scenario 3, the electricity load remains unchanged, but the changes in thermal load and TOU heat price under the constraints of the carbon trading mechanism reduce the CHP output on the source side and increase the energy sales revenue by 1540 yuan. After taking into account the coordinated optimization of electricity and heat DR in Scenario 4, compared with Scenarios 2 and 3, the total IES cost is reduced by 2,085,201 yuan and 1,255,323 yuan, respectively, and the actual carbon emissions are reduced by 4573 and 7727 tons. The data show that considering the coordinated optimization of electricity and heat, DR can achieve both system economic and environmental benefits.
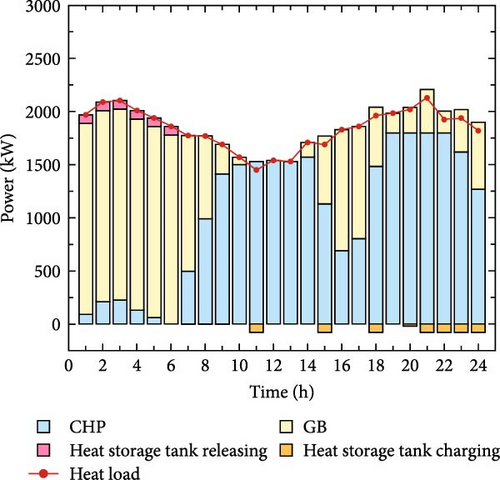
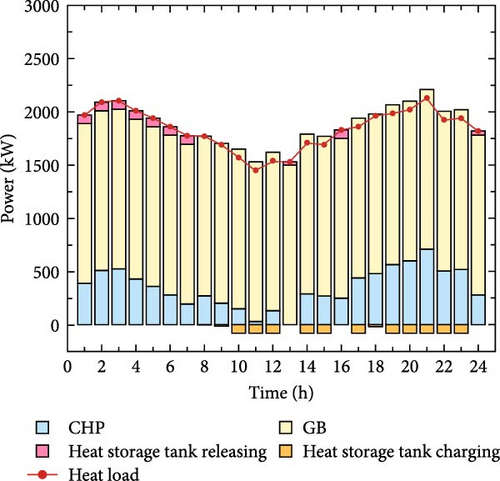
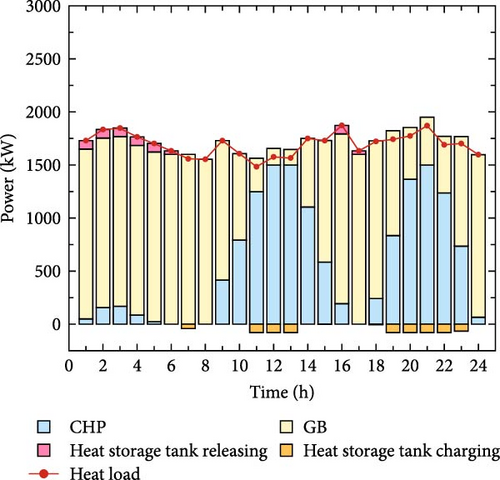
The thermal output power balance diagram for different scenarios is shown in Figure 9. As can be seen from the figure, in Scenario 4, the output of the CHP unit is significantly reduced compared to the other three scenarios and most of the heat load is supplied by GB. This is because the carbon emissions generated by the operation of the CHP unit are higher than those of the GB units. To achieve the best economic and environmental benefits of system operation, it is more inclined to give priority to the use of GB with less carbon emissions for heating and avoid calling high-carbon equipment to generate a large amount of carbon emissions. During the low load period, the HST is continuously charged and released during the peak period to meet the heat load demand, reducing the total cost of system operation.

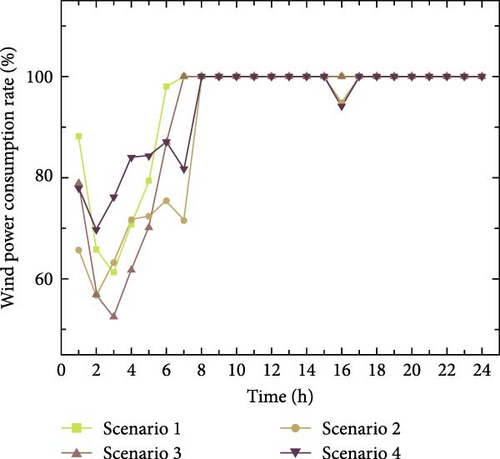
As can be seen from Figure 10, during the period 8:00–24:00, the WT consumption rates of the four scenarios all reached their values. The load curve and TOU energy price in Scenario 4 have been optimized to guide the transfer of user energy demand, effectively improving the consumption space of WT during the low load period. During the period from 1:00 to 7:00, the price of electricity consumption by users is lower than the price of heat consumption and the demand for heat consumption by users decreases, which makes CHP heat output further increases the space for WT consumption and improves the low-carbon economy of IES. Compared with Scenarios 2 and 3, Scenario 1 does not consider DR and users have a large demand for energy, so the WT consumption rate is higher. Scenario 3 considers the optimization of a single thermal load DR in order to meet the user’s electricity demand, CHP power output, and WT consumption rate.
The comparison of actual total carbon emissions and carbon trading amounts in four scenarios is shown in Figure 11. Under the constraints of the ladder-type carbon trading mechanism, the output of high-carbon emission units on the source side is reduced. The total system carbon emissions in Scenario 4 are reduced by 50.73%, 11.31%, and 17.73%, respectively, compared with the other scenarios. The addition of carbon capture equipment can capture 50%–60% of the CO2 emitted by the unit through the flue gas duct, which greatly reduces the actual total carbon emissions and carbon trading amount of IES. The results show that the addition of a ladder-type carbon trading mechanism can not only greatly promote the increase in carbon trading volume, but also guide the source side in reducing carbon emissions, confirming the effectiveness of considering DR for environmental benefits.

5. Conclusion
- 1.
The use of a comprehensive DR model mechanism based on the logistic function to optimize the user-side electric load can effectively improve the problem of large peak-to-valley differences in system load, reduce load fluctuations and achieve peak shaving and valley filling.
- 2.
Compared with not considering DR, the proposed strategy of coordinated participation of electric and thermal loads in DR optimization can effectively coordinate the economic and environmental protection of IES operation, enhance the electric and thermal coupling relationship between systems, and improve system flexibility. Compared with considering the DR of electric load and heat load separately, the total operating cost can be saved by 8.95% and 5.59%, the carbon trading cost can be reduced by 18.48% and 12.64%, and the wind curtailment can be reduced by 36.95% and 25.97%, respectively.
- 3.
The CCPP–P2G joint operation system solves the problem of unstable carbon sources in P2G technology, which can reduce CO2 emissions from thermal power plant units and CHP. On the premise of meeting the load DR, a reasonable tiered carbon trading price is used to guide the source side to adjust the unit output to achieve the purpose of low-carbon operation, with the optimal economical operation of the system as the goal to achieve a win–win “source-load” situation.
In future research, the impact of the implementation of the electricity–carbon coupling trading mechanism on the optimal operation of the IES will be considered. Based on this paper, we can consider the degree of variation of the system to different parameters. The impact of other forms of energy on the system operation on the load side will also be further studied.
Nomenclature
Abbreviations
-
- IES:
-
- integrated energy system
-
- P2G:
-
- power-to-gas
-
- DR:
-
- demand response
-
- TOU:
-
- time-of-use
-
- CCPP:
-
- carbon capture power plant
-
- CHP:
-
- combined heat and power
-
- GB:
-
- gas boiler
-
- CL:
-
- curtailable load
-
- TL:
-
- transferable load
-
- RL:
-
- replaceable load
-
- EST:
-
- batteries
-
- HST:
-
- heat storage tank
-
- WT:
-
- wind power
Indices
-
- e/h/g:
-
- index of electric/heat/gas energy
-
- f/p/v:
-
- index of peak/flat/valley load period
-
- t/i:
-
- index of time
-
- Δt:
-
- index of unit time interval
-
- F:
-
- index of objective function
Variables
-
- :
-
- the actual load transfer after DR
-
- Δppv:
-
- peak-valley energy price difference
-
- Δλpv:
-
- load fluctuation span corresponding to the peak-valley price difference
-
- m:
-
- optimistic corresponding membership degree
-
- :
-
- the average load before the implementation of TOU
-
- ΔPL,t:
-
- load transfer amount after taking DR
-
- :
-
- electrical loads before/after optimization
-
- ΔHL,t:
-
- change of user heat load
-
- Δqt/Δqi:
-
- heat price change
-
- λee/λhh/λeh/λhe:
-
- conversion coefficient of heat energy and electric energy
-
- :
-
- replaceable electrical/heat load
-
- Ucom/Ueco:
-
- comfort and economy of user energy use
-
- /ct:
-
- TOU before/after optimization
-
- EGN,t/EG,t:
-
- net output/equivalent output of the CCPP
-
- ECCS,t/ECCS,r,t/ECCS,s,t:
-
- total/operating/fixed energy consumption of the CCPP
-
- EP2G,t:
-
- energy consumption of the P2G
-
- QWT,t/QPV,t:
-
- abandoned wind and solar power
-
- QCCS,t:
-
- total amount of CO2 captured
-
- GP2G,t:
-
- volume of CH4 produced by the P2G
-
- QP2G,t:
-
- total amount of CO2 consumed by P2G
-
- ECHP,t/HCHP,t:
-
- electric power/thermal power output of the CHP unit
-
- HGB,t:
-
- thermal power output by GB
-
- GCHP,t/GGB,t:
-
- volumes of CH4 consumed by the CHP unit
-
- SES,t/STS,t:
-
- energy storage at the end of EST/HST
-
- EESC,t/EESD,t:
-
- charging/discharging power of the EST
-
- HTSC,t/HTSD,t:
-
- charging/discharging power of the HST
-
- :
-
- ladder-type carbon trading cost
-
- :
-
- carbon trading market purchases
-
- GBUY,t/EBUY,t:
-
- purchasing gas/electricity
-
- EWT,t/EPV,t:
-
- WT/PV units consumption
-
- sh,t/se,t:
-
- TOU energy prices after optimization
-
- fBUY:
-
- energy purchase cost
-
- :
-
- carbon trading cost
-
- fOP:
-
- unit operation and maintenance cost
-
- fsell:
-
- energy sales income
Parameters
-
- :
-
- pessimistic/optimistic response curve predicts transfer rate
-
- Tf/Tp/Tv:
-
- peak, flat, and valley time periods
-
- T:
-
- scheduling period
-
- δ:
-
- load fluctuation range
-
- cmax/cmin:
-
- the upper/lower limits of the energy price ratio
-
- α1/α2/α3:
-
- participating DR accounts for the total coincidence ratio
-
- :
-
- energy consumption per unit CO2 capture
-
- ηP2G:
-
- P2G conversion efficiency
-
- Hg:
-
- calorific value of natural gas
-
- Ρ:
-
- CO2 density
-
- ηCHP,e/ηCHP,h:
-
- electrical/thermal conversion efficiency of CHP
-
- ηGB:
-
- thermal efficiency of GB
-
- δES/δTS:
-
- electrical/thermal energy Loss rates of the energy storage equipment
-
- ηESC/ηESD:
-
- charging/discharging efficiency of the EST
-
- ηTSC/ηTSD:
-
- charging/discharging efficiency of the HST
-
- λ:
-
- carbon trading base price
-
- α:
-
- price growth rate
-
- l:
-
- length of the carbon emission interval
-
- cg:
-
- fixed price of natural gas
-
- ce:
-
- electricity purchase price
-
- ccs:
-
- fixed price of CO2 storage unit
-
- λ1/λ2:
-
- maintenance cost coefficient of WT/PV units
-
- EGN,max/EGN,min:
-
- the upper/lower limits of the net output of CCPP
-
- EP2G,max/EP2G,min:
-
- the upper/lower limits of P2G operation energy consumption
-
- ECHP,max/ECHP,min:
-
- the upper/lower limits of the electricity power generated by the CHP
-
- HCHP,max/HCHP,min:
-
- the upper/lower limits of the heat power generated by the CHP
-
- HGB,max/HGB,min:
-
- the upper and lower limits of GB heat generation power
-
- EESC,max/EESD,max:
-
- the maximum values of EST charging/discharging power
-
- EESC,max/EESD,max:
-
- the maximum values of EST charging/discharging power
-
- μESC,t/μESD,t:
-
- the charging/discharging status of the EST
-
- SES,max/SES,min:
-
- the maximum/minimum values of EST storage
-
- SES,1/SES,24:
-
- initial and final values of the EST capacity
-
- ΔEGN:
-
- the ramp rate con straints of the CCPP
-
- ΔECHP/ΔHCHP:
-
- electrical/thermal climbing constraint of CHP unit
-
- ΔEP2G:
-
- the ramp rate con straints of the P2G
-
- ΔHGB:
-
- GB heat generation power ramp constraint
-
- q0t/q0i:
-
- initial heat prices
Matrices
-
- ε (t,i):
-
- price elasticity matrix.
Conflicts of Interest
The authors declare no conflicts of interest.
Author Contributions
Xiuyun Wang: conceptualization, methodology, writing–review and editing, funding acquisition. Yang Jiao: methodology, software, formal analysis, writing–original draft. Benwang Cui: writing–review and editing, software, data curation. Hongbin Zhu: formal analysis, validation. Rutian Wang: writing–review and editing, supervision.
Funding
This work is supported by the Project of Jilin Province Education Department of China under Grant JJKH20230118KJ.
Open Research
Data Availability Statement
The data used to support the findings of this study are available from the corresponding author upon request.


