Eco-Friendly Additives: Performance and Emissions Analysis of a Diesel Engine With Jojoba Methyl Ester and CNT Blends
Abstract
Diesel engines have extensive use in vehicles, power plants, and agriculture, but they pose significant challenges due to both regulated and unregulated emissions. As fossil fuel supplies diminish and pollution levels increase, it has become crucial to shift from conventional fuels to biodiesel and alternative additives. This experimental study investigates the emission and performance characteristics of a water-cooled, three-cylinder, four-stroke compression ignition engine operating on blends of Jojoba methyl ester (JME) combined with additives such as carbon nanotube (CNT). JME was mixed with pure diesel in concentrations of 5% and 15% by volume, creating blends referred to as J5 and J15. CNT was added to these blends at a concentration of 20, 40, and 60 ppm. Emission and performance metrics were evaluated across engine speeds varying from 1200 to 2200 rpm. The findings revealed significant improvements, with brake thermal efficiency (BTE), brake power (BP), and torque increasing by 6.7%, 3.8%, and 3.8% respectively. A 2.6% reduction in brake-specific fuel consumption (bsfc) was observed at 1600 rpm with the J5CNT60 blend. The introduction of Jojoba biodiesel into neat diesel resulted in reductions of 12.8%, 14.56%, 15.25%, and 7.27% in nitrogen oxide (NOx), carbon monoxide (CO), carbon dioxide (CO2), and unburned hydrocarbon (UHC) emissions, respectively. Although Jojoba biodiesel resulted in a slight increase in smoke opacity (SO) emissions by less than 1%, the addition of CNT led to a 2% decrease in SO emissions at 2000 rpm.
Summary
- •
Biodiesel and carbon nanotube (CNT) were fueled to study the emission and performance of the diesel engine.
- •
The compression ignition (CI) engine fueled with CNT improved the performance parameters.
- •
Biodiesel reduced carbon dioxide (CO2), carbon monoxide (CO), and unburned hydrocarbon (UHC) emissions by 15.25%, 14.56%, and 7.27%, respectively.
- •
CNT increased nitrogen oxide (NOx), CO2, and CO emissions by 19.50%, 8.13%, and 7.80%, respectively.
1. Introduction
Diesel engines are highly effective for power generation, agricultural applications, and transportation due to their durability, simplicity, and availability in a wide range of sizes. They also offer superior brake thermal efficiency (BTE) compared to petrol engines in automotive applications [1, 2]. Burning fossil fuels releases a significant amount of hazardous gases into the environment, contributing to pollution, including acid rain, global warming, smog, and the greenhouse effect [3]. Cardiovascular and respiratory diseases are linked to compression ignition (CI) engine emissions, which include carbon monoxide (CO), nitrogen oxide (NOx), unburned hydrocarbon (UHC), particulate matter (PM), soot, and various toxic ketones and aldehydes [4, 5]. Given the depletion of petroleum reserves and the ongoing rise in environmental hazards, there is an urgent need to explore renewable and eco-friendly fuel alternatives.
A comprehensive literature review presents three established techniques for enhancing CI engine performance and reducing harmful emissions: (i) improvement in engine design [6], (ii) fuel adjustment or preprocessing [7], and (iii) engine exhaust after-treatment or postprocessing [8]. Table 1 presents earlier studies demonstrating the use of these techniques. The combustion characteristics of traditional petroleum-based fuels can be enhanced by incorporating small amounts of nonmetallic or metallic additives or by mixing in minor quantities of biodiesel during the fuel preparation or modification process [25]. Biodiesel can be produced through the transesterification process using various common oils, including those derived from fish, cardoon, Salvia macrosiphon, rapeseed, brassica, Calophyllum inophyllum, castor, cottonseed, rice bran, neem, sunflower, corn, soybean, hazelnut, karanja, moringa, turpentine, palm, canola, and jatropha. The additional oxygen in biodiesel promotes smoother combustion, enhancing performance and reducing emissions [26]. The oxygen in biodiesel enhances combustion by promoting the oxidation of carbon and hydrogen molecules, resulting in more complete fuel burning. This reduces emissions like CO and UHC, improves energy release, and ensures smoother combustion, even in suboptimal air–fuel mixing conditions. One advantage of using biodiesel is its physicochemical properties, which closely resemble those of pure diesel, enabling its use in CI engines without requiring modifications. Adding metallic nano additives to fuel provides a practical and cost-effective approach to reducing emissions, improving engine performance, and increasing combustion efficiency. These additives are mixed with diesel in small amounts and have minimal impact on the fuel’s physical and chemical properties [27]. Nanomaterials regulate emissions by improving combustion efficiency through their high surface area and catalytic properties, which promote complete fuel oxidation. They enhance engine performance by increasing energy release, reducing friction, and improving thermal and combustion characteristics.
| Methodology | Reference | Adjustment type | Engine performance | Emission parameters | |||||||
|---|---|---|---|---|---|---|---|---|---|---|---|
| BMEP | BTE | bsfc | EGT | NOx | Smoke | PM | HC | CO | |||
| Engine design improvement | [9] | Retreated SOI | — | ↓ | ↑ | — | — | — | — | — | — |
| — | Advanced SOI | — | ↑ | ↓ | — | ↑ | — | ↓ | ↓ | — | |
| — | FIP 1000 bars | ↑ | ↓ | ↑ | ↑ | ↑ | — | ↓ | ↑ | ↑ | |
| — | FIP 500 bars | ↓ | ↑ | ↓ | ↓ | ↓ | — | — | ↓ | ↓ | |
| [10] | TIP | — | ↑ | ↓ | ↑ | ↑ | ↓ | — | ↓ | ↓ | |
| Fuel adjustment or preprocessing | [11] | D + GO | — | — | ↓ | ↓ | ↓ | — | — | — | — |
| [12] | D + Ag + CNT (120 mg)a | ↑ | ↑ | ↓ | ↑ | ↑ | — | — | ↓ | ↓ | |
| [13] | D + water emulsions | — | — | — | ↓ | ↓ | — | ↓ | — | — | |
| [14] | D + carbon black | — | — | — | ↓ | ↓ | ↑ | — | ↑ | ↑ | |
| [15] | D + Ce2O3 + lemongrass oil | — | ↑ | ↑ | ↑ | ↑ | ↓ | — | ↑ | ↑ | |
| [16] | D + Ti2O3 (80 ppm/l)a | — | ↑ | ↑ | ↑ | ↑ | — | — | ↓ | ↓ | |
| [17] | D + CuO (50 mg)a | ↑ | ↑ | ↑ | ↓ | ↓ | — | — | ↓ | ↓ | |
| — | D + Al2O3 (50 mg)a | ↑ | ↑ | ↑ | ↓ | ↓ | — | — | ↓ | ↓ | |
| [18] | D90B10 + Al2O3 (90 mg)a | ↑ | ↑ | ↓ | ↑ | ↑ | — | — | ↓ | ↓ | |
| [19] | D + FPC | — | ↑ | ↓ | — | — | ↓ | — | — | — | |
| [20] | D90TO10 | — | ↑ | ↑ | ↑ | ↑ | — | — | ↓ | ↑ | |
| — | D80TO20 | — | ↓ | ↓ | ↑ | ↑ | — | — | ↓ | ↑ | |
| — | D70TO30a | — | ↑ | ↑ | ↑ | ↑ | — | — | ↑ | ↓ | |
| — | D60TO40 | — | ↓ | ↑ | ↑ | ↑ | — | — | ↑ | ↑ | |
| — | D50TO50 | — | ↓ | ↓ | ↑ | ↑ | — | — | ↑ | ↑ | |
| [21] | DWSA20 | — | ↑ | ↓ | — | — | ↓ | — | ↓ | ↓ | |
| — | DWSA15 | — | ↑ | ↓ | — | — | ↓ | — | ↓ | ↓ | |
| — | DWSA10a | — | ↑ | ↓ | — | — | ↓ | — | ↓ | ↓ | |
| — | DWSA5 | — | ↑ | ↓ | — | — | ↓ | — | ↓ | ↓ | |
| [22] | Mn + D100 (16 mg) | — | — | ↓ | ↓ | ↓ | — | ↓ | — | ↓ | |
| — | Mn + D100 (12 mg)a | — | — | ↓ | ↓ | ↓ | — | ↓ | — | ↓ | |
| — | Mn + D100 (8 mg) | — | — | ↓ | ↓ | ↓ | — | ↓ | — | ↓ | |
| — | Mn + D100 (4 mg) | — | — | ↓ | ↓ | ↓ | — | ↓ | — | ↓ | |
| [1] | Graphite | — | ↑ | ↓ | — | ↑ | — | — | — | ↑ | |
| Exhaust after-treatment or postprocessing | [23] | EGR and EEVO | — | — | ↑ | ↓ | ↓ | — | ↑ | — | — |
| [24] | Combination of DPF, SCR, EGR | — | — | — | — | ↓ | ↓ | — | ↓ | ↓ | |
- Note: Upward arrows indicate an increase, while downward arrows indicate a decrease in efficiency and emission parameters.
- Abbreviations: BMEP, brake mean effective pressure; bsfc, brake-specific fuel consumption; BTE, brake thermal efficiency; CNT, carbon nanotube; CO, carbon monoxide; EEVO, early exhaust valve opening; EGT, exhaust gas temperature; HC, hydrocarbon; NOx, nitrogen oxide; PM, particulate matter; SOI, start of injection timing.
- aIndicates optimum concentration of fuel additives.
The addition of nanoparticles to biodiesel–diesel blends has emerged as a promising strategy to enhance engine performance and reduce emissions. Jojoba methyl ester (JME) has been investigated as a biodiesel feedstock due to its low chemical reactivity, availability, and sustainable cultivation in nonarable lands. However, its high viscosity and lower calorific value often lead to reduced engine performance and increased emissions. To overcome these limitations, researchers have explored multiwalled carbon nanotubes (MWCNTs) as fuel additives. Studies have demonstrated that MWCNTs improve fuel properties by increasing thermal conductivity, promoting complete combustion, and reducing ignition delay, leading to enhanced engine efficiency and lower emissions of NOx, CO, and UHCs. The catalytic effects of MWCNTs, coupled with their high surface area-to-volume ratio, make them effective in improving combustion and minimizing PM emissions [28].
The integration of nanomaterials into biodiesel blends has gained significant attention for improving engine performance and reducing harmful emissions. Recent investigations by Venkatesan et al. [29] have explored the use of jojoba biodiesel, derived through a base-catalyzed transesterification process, in combination with diesel, n-butanol, and MWCNTs. MWCNTs, prepared as a stable aqueous nanosolution with the Tween 80 surfactant, demonstrated significant potential in enhancing combustion efficiency and emissions reduction. Experimental studies utilizing a 5.2 kW diesel engine showed that optimized blends improved BTE by 8.87%, rate of heat release (ROHR) by 32.21%, and in-cylinder pressure by 11.27%. Concurrently, key emissions like UHCs, CO, carbon dioxide (CO2), and smoke were reduced by 10.23%, 26.25%, 14.17%, and 17.52%, respectively. These findings highlight the catalytic role of MWCNTs in promoting complete combustion, shortening ignition delays, and improving the overall thermal and environmental performance of diesel engines.
Particles containing nuclei modes emitted from CI engines during combustion are harmful to the human body. These particles can adversely affect the lungs, bronchi, stomach, and vascular tissues [30, 31]. Various methods have been utilized to reduce soot and NOx emissions simultaneously to comply with diesel engine emission standards. Recent studies suggest that biodiesel can significantly decrease emissions of CO2, CO, smoke opacity (SO), and UHCs from diesel engines. While biodiesel may cause a slight increase in NOx emissions, this can be managed by modifying the fuel injection timing [32]. Jojoba oil is a relatively lesser-known renewable resource that shows promise for cultivation in hot climates compared to other alternatives. Numerous studies suggest that nonedible jojoba oil has potential as a fuel for CI engines [33]. Jojoba was first cultivated in the Sonoran Desert in the Southern United States and Africa.
Jagtap, Pawar, and Lahane [34] suggested employing the EGR framework to lower NOx and CO2 emissions from the CI engine, finding a reduction of 9.8% in NOx and 7.2% in CO2 emissions. Malmgren et al. [35] analyzed diesel engine emissions and recommended the use of a diesel particulate filter combined with a diesel oxidation catalyst to lower PM and NOx emissions from diesel exhaust. These changes resulted in reductions of 5.6% in NOx emissions and 2.3% in PM emissions. Senthil, Paramasivam, and Rajendran [36] proposed a technique to increase the NOx/NO2 ratio in diesel engines by using H2 and optimizing ignition for improved after-treatment performance. The researchers observed a notable decrease in several emission parameters.
Tayari, Abedi, and Rahi [37] explored the use of fuel additives and fuel processing technology to reduce particulate emissions from medium-speed, large-scale CI engines. They tested various concentrations of isopropanol as fuel additives. There was a significant reduction in NOx emissions when they added isopropanol to the pure diesel with 20% EGR. A detailed examination of diesel engine emissions, including NOx, UHC, and particulate size distributions, was conducted by Clenci et al. [38]. The study reported a 3.1% decrease in UHC emissions and a 4.4% decrease in NOx. Tosun and Özcanlı [39] examined the performance, combustion, and emissions of a CI engine using two modified fuels: soybean biodiesel blends and alumina (Al2O3) biodiesel blends with nano additives. Their findings showed an increase in cylinder pressure alongside a higher heat release rate, with combustion being more complete compared to pure diesel fuel. They observed significant emission reductions, including a 35% decrease in sulfur dioxide (SO2), a 60% reduction in UHC, an 80% drop in CO, and a 70% reduction in NOx. The grooves on pistons in hydraulic pumps can stabilize pistons and influence efficiency. Earlier studies investigated leakage and friction dynamics, groove designs, and effects on pressure and flow [40].
Bi et al. [41] examined how carbon nanotube (CNT) and Schleicher oleosa biodiesel affect diesel engine performance. Their experiments involved various concentrations of CNT (40, 80, and 1200 ppm) mixed with B10 and B20 biodiesel. The findings revealed an 8.21% improvement in BTE and reductions of 27.49% in NOx, 29.41% in SO, 65.7% in CO, and 44.98% in hydrocarbon (HC) levels. Additionally, there was a notable increase in brake power (BP) and torque, along with a 7.12% decrease in brake-specific fuel consumption (bsfc) when blending biodiesel and CNT with pure diesel. Gad, Abdel Aziz, and Kayed [42] explored the effects of graphene quantum dot nanoparticles and ethanol biodiesel on a CI engine’s performance and emissions. Their study used an ethanol blend with 30 ppm graphene quantum dot nanoparticles, tested at various engine speeds under constant load. Results showed increases of 12.42% in torque and 28.18% in power, along with reductions of 29.54% in CO, 31.12% in HC, and 14.35% in bsfc, compared to pure diesel. The impact of blending biodiesel with pure diesel on engine performance and emissions has been thoroughly investigated by Hojati and Shirneshan [43]. Their works examined the impact of compression ratio and biodiesel blends on combustion characteristics, thermal efficiency, and emissions. Their study further builds upon these findings by utilizing a thermodynamic zero-dimensional model to predict engine parameters for various biodiesel–diesel blends and compression ratios. Barsari and Shirneshan [44] explored the tribological behavior of biodiesel blends derived from sunflower and soybean oils using a four-ball wear testing machine. It highlighted how increased biodiesel concentration improves lubrication and reduces wear at lower rotational speeds, while higher speeds lead to degradation due to oxidation and reduced viscosity.
The use of CNT in internal combustion (IC) engines, as fuel additives or in structural components, raises concerns about nanometer-sized particle emissions. These emissions stem from incomplete combustion of CNT-containing fuels and thermal degradation at high temperatures. Ultrafine particles (<100 nm) formed during combustion are especially harmful due to their ability to penetrate the respiratory system, posing health, and environmental risks. Sridhara and Satapathy [45] reported increased ultrafine particulate emissions from CNT-based fuels in diesel engines, while Rodoshi Khan and Bin Rashid [46] found that high temperatures cause CNT fragmentation, releasing nanoscale particles. Mitigation strategies include optimized diesel and gasoline particulate filters with improved pore structures. CNT-specific catalysts, such as cerium oxide (CeO2) and platinum-based systems, enhance the oxidation of CNT and byproducts. Emerging methods like plasma-assisted oxidation and electrostatic precipitators also show potential for managing CNT-derived nanoparticle emissions effectively, though they require further development.
Polycyclic aromatic hydrocarbons (PAHs) are hazardous organic compounds formed during incomplete fuel combustion. Known for their carcinogenic, mutagenic, and teratogenic effects, PAHs pose significant environmental and health risks due to their persistence and bioaccumulation. Reducing PAH emissions from engines is essential for meeting environmental regulations and safeguarding health. Biodiesel, a renewable fuel, shows promise in reducing PAH emissions compared to conventional diesel. Its higher oxygen content improves combustion efficiency and limits incomplete combustion products. Studies reveal biodiesel’s advantages: Arias et al. [47] reported lower PAH emissions with biodiesel blends, attributing this to their lower aromatic content. Arias, Molina, and Agudelo [48] observed significant PAH reductions with waste cooking oil biodiesel. Nanoparticle fuel additives, such as CeO2, aluminum oxide (Al2O3), and CNT, further enhance combustion and minimize PAH formation. Yusuf, Inambao, and Ampah [49] showed CeO2 nanoparticles in biodiesel reduce gaseous and particulate PAHs via improved oxidation.
Recent studies have highlighted the potential of MWCNTs as additives in biodiesel blends to enhance engine performance and reduce emissions. Pullagura et al. [50] investigated the combination of jojoba biodiesel, diesel, and n-butanol with MWCNTs as fuel additives, demonstrating significant improvements in BTE and reductions in UHCs and CO emissions. Similarly, Sulochana et al. [51] examined biodiesel–diesel blends with MWCNTs, reporting enhanced combustion characteristics, increased thermal efficiency, and lower PM emissions. Çılğın [52] explored the effects of CNT and biodiesel blends on diesel engine performance, observing notable reductions in NOx, SO, and fuel consumption while improving BP and torque. Despite these advancements, gaps remain in optimizing the blending ratios of JME and MWCNTs for maximizing performance and minimizing emissions.
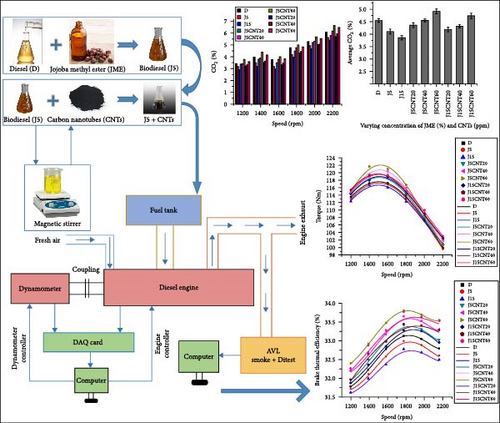
The reviewed literature demonstrates that while numerous studies have explored the impact of biodiesel and nanoparticle additives, critical gaps remain in the detailed characterization of optimal blending ratios and the combined effects of JME and MWCNTs on diesel engine performance and emissions. This study fills these gaps by determining optimal concentrations. Through systematic experimentation, we established optimal concentrations of JME (5% and 15% by volume) and MWCNTs (20, 40, and 60 ppm), providing a clearer understanding of blending ratios for maximizing performance and minimizing emissions. Also, this study evaluates the combined use of JME biodiesel and MWCNTs, showing synergistic effects in improving BTE (up to 6.72%) and reducing bsfc (by 2.65%) compared to pure diesel. The flowchart of the current experimental study is shown in Figure 1. The findings of this study provide new insights into the operational behavior of CI engines, including variations in torque, BP, and specific emission parameters such as CO, CO2, UHC, and NOx, across engine speeds ranging from 1200 to 2200 rpm. For example, the J5CNT60 blend showed the greatest overall performance improvements, while the J15 blend resulted in the most significant reductions in emissions. These advancements set the foundation for future research and policy development in the use of biodiesel and nanoparticle blends as sustainable fuel alternatives.
2. Materials and Methods
2.1. JME and CNT Nanoparticles
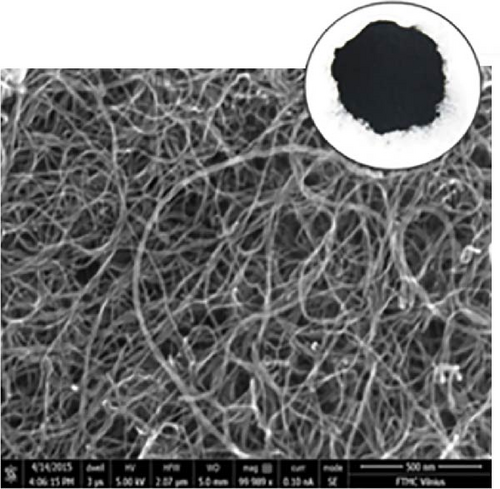
The MWCNT, with a purity of 90%–95%, an inner diameter of 2–4 nm, and an outer diameter of 8 nm, was sourced from Soochow Hengqiu Graphene Technology Co., Ltd., China. The JME was supplied by Pakistan State Oil (PSO). Figure 2 displays images of JME and CNT, including scanning electron microscope (SEM) images of the nanoparticles.

2.2. Experimental Setup
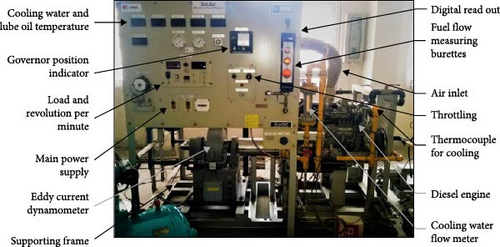
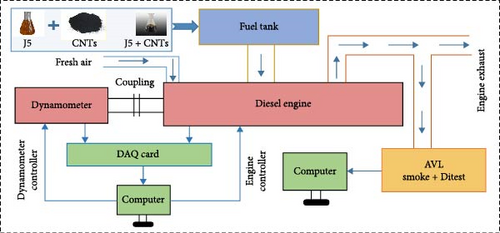
The experimental study was carried out on a test bench, as shown in Figure 3, with the schematic diagram provided in Figure 4. Details of the experimental setup are presented in Table 2. During the diesel engine tests, atmospheric pressure was kept at 101.325 kPa and ambient temperature at 22°C. To analyze the regulated gaseous emissions of the CI engine, an AVL smoke meter and Ditest were utilized. Specifications of the equipment used in this study are listed in Table 3.
| Parameter | Specifications |
|---|---|
| Type | Diesel T 3.1524 |
| Maximum torque | 212 Nm |
| Maximum engine speed | 2250 rpm |
| Maximum brake power | 60 hp |
| Number of cylinders | 3 |
| Injection | Direct |
| Capacity | 2.5 l |
| Bore | 91.4 mm |
| Stroke | 127 mm |
| Compression ratio | 15.5 : 1 |
| Aspiration | Turbo |
| Cooling | Water |
| Air cleaner type | Oil bath |
| Fuel filter | Dual, high capacity |
| Exhaust | Horizontal |
| Certified by | BS AU 141a (1971) |
| Testbed | Single phase 220 V AC supply, Tokyo Meter Co. Limited |
|---|---|
| Dynamometer | An electrobraking (eddy current), water-cooled dynamometer having a 500 Nm load capacity |
| Emission analyzer |
|
2.3. Nanoadditives and Fuel Preparation
JME at concentrations of 5% and 15% was mixed with pure diesel. The chemical prospects of pure diesel are detailed in Table 4. The experimental design, which includes various concentrations of JME and MWCNT, is outlined in Table 5.
| Parameters | Pure diesel | Investigative standard |
|---|---|---|
| Viscosity, cSt (@ 40°C) | 3.775 | ASTM D445 |
| Flashpoint (°C) | 76 | ASTM D93 |
| Pour point (°C) | −18 | ASTM D97 |
| Density, g/ml (25°C) | 849.2 | ASTM D1298 |
| Cetane index | 51 | ASTM D613 |
| Number of experiment | Diesel (%) | JME concentration (percentage by volume) | MWCNT concentrations (mg/l) | Fuel nomenclature |
|---|---|---|---|---|
| 1 | 100 | — | — | D |
| 2 | 95 | 5 | — | J5 |
| 3 | 85 | 15 | — | J15 |
| 4 | 95 | 5 | 20 | J5CNT20 |
| 5 | 95 | 5 | 40 | J5CNT40 |
| 6 | 95 | 5 | 60 | J5CNT60 |
| 7 | 85 | 15 | 20 | J15CNT20 |
| 8 | 85 | 15 | 40 | J15CNT40 |
| 9 | 85 | 15 | 60 | J15CNT60 |
2.4. Experimental Methodology
The current experimental study was conducted at various engine speeds, ranging from 1200 to 2200 rpm in increments of 200 rpm. The engine operated under full load conditions. Each experiment investigated emissions, fuel consumption, load, and speed. To clear any leftover fuel blends from previous tests, the engine was operated for 10 min before each new test.
2.5. Uncertainty Analysis
| Parameter | Measuring ranges | Accuracies | Uncertainty (%) |
|---|---|---|---|
| Speed | 0–7000 rpm | ±2 rpm | ±0.5 |
| Torque | 0–200 Nm | ±0.2 Nm | ±1 |
| Power | 0–110 kW | ±0.5 kW | ±1 |
| BTE | — | — | ±1 |
| SFC | — | — | ±2 |
| Temperatures | 0–1000°C | ±1°C | ±0.1 |
| NOx | 0–2500 ppm | ±5 ppm | ±1 |
| CO | 0–8000 ppm | ±8 ppm | ±1 |
| CO2 | 0–21 vol. % | ±0.2 vol. % | ±1 |
| O2 | 0–21 vol. % | ±0.1 vol. % | ±1 |
3. Results and Discussions
An in-depth analysis of the experimental findings is provided. The subsections address key performance metrics such as torque, BP, BTE, and specific fuel consumption. Additionally, it evaluates emission characteristics, including CO, CO2, UHCs, NOx, and SO.
3.1. Analysis of Torque Variation and Enhancement
Figure 5a shows how JME biodiesel and CNT affect engine torque at different speeds. The peak torque was achieved with the J5CNT60 fuel blend at 1400 rpm. At higher speeds, the engine cylinder does not fill during the intake stroke, leading to reduced torque despite the inlet valve being fully open [54]. This is due to the short duration of air intake and increased cylinder pressure, which diminishes combustion pressure. Consequently, the engine torque was lower than expected due to the higher momentum of the moving engine components.
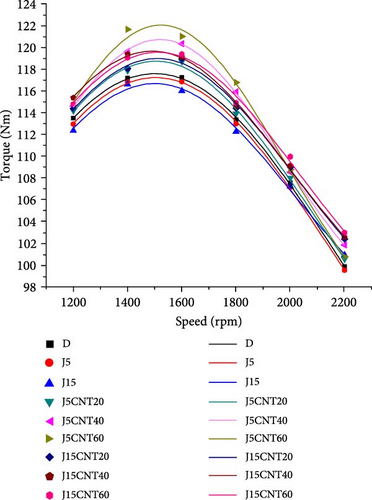
The maximum increase in torque was observed to be 3.84% with the J5CNT60 fuel blend at 1400 rpm, whereas the J5 and J15 fuel blends exhibited the lowest torque values. The decrease in engine power for the J5 and J15 blends is due to the lower energy content of JME. Typically, biodiesel produces less torque compared to pure diesel at all tested speeds. These findings are consistent with previous studies; for example, Ghodke and Suryawanshi [55] demonstrated a maximum torque increase of 16.16% at 2500 rpm in their experimental study. Another study reported a 5% increase in torque when using the B100 fuel blend at an engine speed of 1600 rpm [54]. Additionally, Heidari-Maleni et al. [56] found a 0.34% increase in torque.
As the percentage of biodiesel increases, the fuel’s density and viscosity also rise, leading to a decline in spray characteristics. In the engine cylinder, the larger droplet diameter and higher viscosity of the injected fuel hinder the compressed air’s ability to penetrate effectively, leading to inadequate atomization. Compared to pure diesel, engine torque significantly improves when CNTs are added to the pure diesel. As the concentration of CNT increases, torque continues to rise. This improvement is attributed to the engine cylinder combusting more fuel and achieving better combustion quality. As a result, torque and piston force rise due to the increased average pressure.
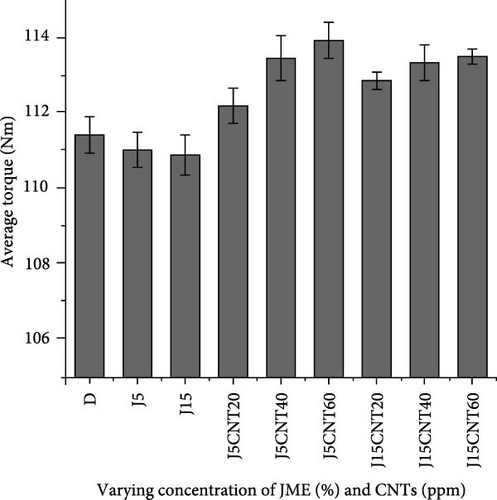
Figure 5b demonstrates the typical changes in torque for various fuel blends. For the blends J5CNT20, J5CNT40, J5CNT60, J15CNT20, J15CNT40, and J15CNT60, the average torque increases by 0.69%, 1.83%, 2.25%, 1.29%, 1.72%, and 1.86%, respectively. In contrast, the average torque with the J5 and J15 fuel blends decreases by 0.36% and 0.48%, respectively.
3.2. BP
Figure 6a illustrates the impact of JME biodiesel and CNT on the BP of an engine running on neat diesel. There is a notable increase in BP across various engine speeds, ranging from 1200 to 2200 rpm. However, previous studies have shown that power tends to stabilize or decrease slightly at engine speeds between 2300 and 2900 rpm. Estimating fuel quality at higher engine speeds is challenging due to incomplete combustion [57]. For optimal performance, the best speed range is between 1700 and 2200 rpm. The behavior of engine power with fuel blends mirrors that of the torque.

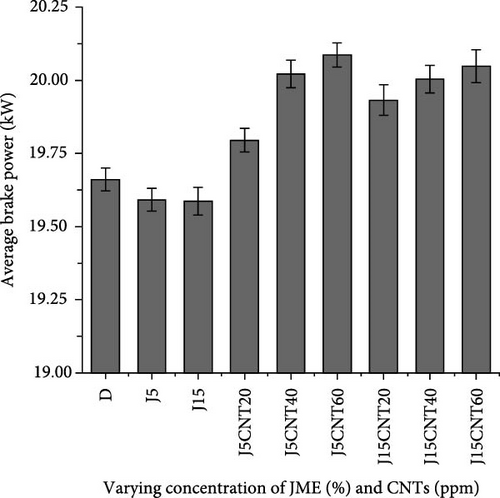
The highest BP was noted with the J5CNT60, J5CNT40, and J15CNT60 fuel blends. In contrast, the J5 and J15 blends, along with neat diesel fuel, exhibited the lowest BP. The greatest increase in BP, 3.84%, was achieved with the J5CNT60 fuel blend at 1400 rpm. An increase in BP was observed with higher concentrations of CNT in the fuel blends, suggesting better fuel ignition in the engine’s combustion chamber and more efficient energy conversion. Aliana-Nasharuddin et al. [58] also reported a 4.91% improvement in BP with the inclusion of CNT.
Figure 6b illustrates the changes in the engine’s average BP across various fuel blends. The average BP for the fuel blends J5CNT20, J5CNT40, J5CNT60, J15CNT20, J15CNT40, and J15CNT60 showed increases of 0.69%, 1.84%, 2.17%, 1.38%, 1.75%, and 1.97%, respectively. In contrast, the average BP for the J5 and J15 fuel blends decreased by 0.36% and 0.38%, respectively.
3.3. BTE
Figure 7a shows how BTE varies with different fuel blends at various engine speeds. At an engine speed of 1400 rpm, the J5CNT20 fuel blend improved BTE by 6.72% compared to neat diesel. Fuel blends with lower concentrations of biodiesel and higher concentrations of CNT exhibit improved BTE due to enhanced combustion properties. CNTs contain a higher amount of oxygen in their chemical structure, which facilitates more complete combustion within the engine cylinder. This enhanced burning of the fuel can result in improved BTE. Previous research has highlighted that key parameters, such as the viscosity and exhaust gas temperature (EGT) of biodiesel, negatively impact combustion efficiency inside the engine cylinder [59].
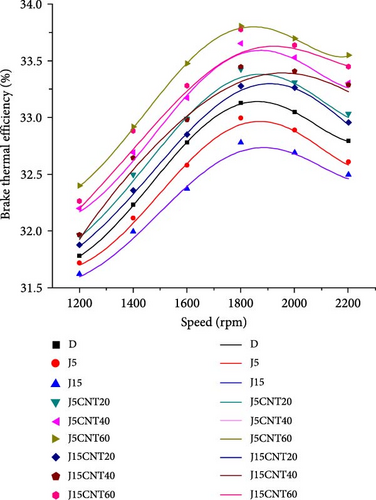
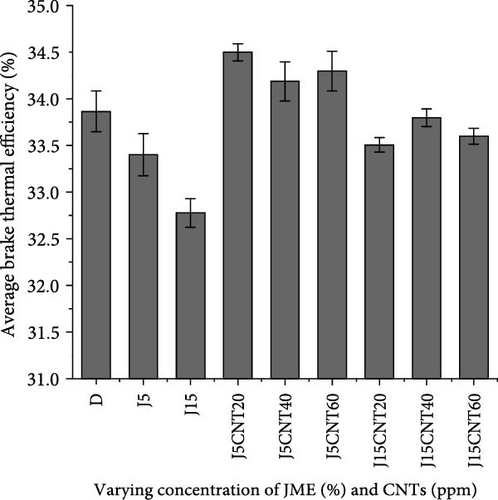
The results show that incorporating biodiesel into pure diesel fuel resulted in a reduction in BTE, aligning with the findings of a previous study by Shirneshan et al. [60]. Previous studies have shown a reduction in maximum BTE by 1.38%–1.54% when 20% biodiesel was added to B50 fuel blends [61]. Additionally, it was noted that the percentage continued to rise with the increased addition of biodiesel. CNTs possess higher calorific values than pure diesel. Nevertheless, the heating values of biodiesel are lower compared to those of pure diesel fuels.
Figure 7b shows the variations in the average BTE for each fuel blend. The average BTE increased by 1.88%, 0.96%, and 1.28% with the J5CNT20, J5CNT40, and J5CNT60 blends, respectively. In contrast, the average BTE decreased by 1.37%, 3.22%, 1.06%, 0.19%, and 0.79% with the J5, J15, J15CNT20, J15CNT40, and J15CNT60 blends, respectively.
3.4. bsfc
Figure 8a illustrates the variation in bsfc with engine speed. Generally, as engine speed increases, bsfc tends to rise because the engine needs more power strokes to complete within a given time at higher RPMs. For all the blends investigated, the lowest bsfc values were observed at engine speeds of 1200 and 1400 rpm. For neat diesel, the minimum bsfc recorded was 241.378 g/kWh, whereas, with the biodiesel and CNT fuel blends, the lowest bsfc observed was 238.785 g/kWh with the J5CNT60 fuel blend. The J5CNT60 blend achieved a maximum reduction in bsfc of 2.65% compared to neat diesel at an engine speed of 1600 rpm.
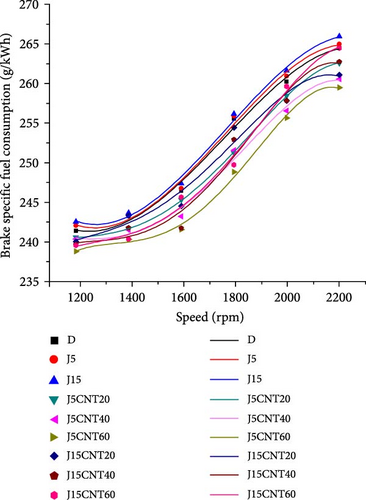
The data indicate that an increase in the biodiesel proportion in fuel blends leads to a rise in bsfc. This is due to biodiesel’s lower heating value, which necessitates burning more fuel in the engine. Furthermore, the density and viscosity of the fuel have a significant impact on BSFC. Biodiesel blends often experience poorer spray and atomization characteristics in the combustion zones, which diminishes combustion quality and efficiency compared to pure diesel. As a result, bsfc values are higher for biodiesel blends than for neat diesel. However, incorporating CNT results in a reduction in BSFC, as CNTs have higher heating values that lower the required fuel quantity. Mansoury, Jafarmadar, and Kousheshi [62] observed similar results in their research, noting a 2.39% reduction in bsfc for DA50 fuel blends.
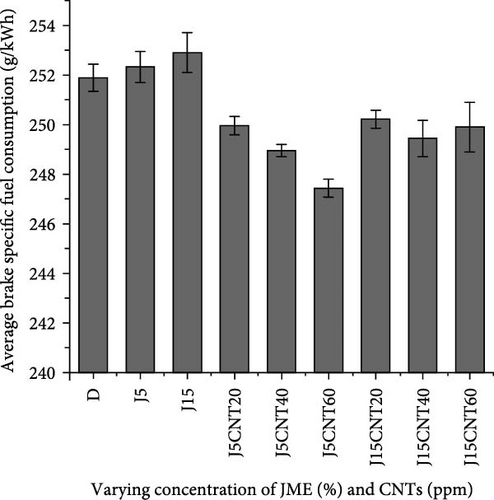
Figure 8b demonstrates how the average bsfc of the engine varies with different fuel blends. The average bsfc decreased by 0.77%, 1.17%, 1.77%, 0.67%, 0.98%, and 0.79% for the fuel blends J5CNT20, J5CNT40, J5CNT60, J15CNT20, J15CNT40, and J15CNT60, respectively. Conversely, with the J5 and J15 fuel blends, the average bsfc increased by 0.17% and 0.40%, respectively.
3.5. CO Emissions
Figure 9a shows how CO emissions change with engine speed, with the lowest CO emissions recorded at 1600 rpm. The minimum CO values for the various fuels were as follows: diesel (0.078%), J5 (0.071%), J15 (0.065%), J5CNT20 (0.074%), J5CNT40 (0.079%), J5CNT60 (0.082%), J15CNT20 (0.075%), J15CNT40 (0.079%), and J15CNT60 (0.81%). The lowest CO emissions of 17.28% were recorded for the J15 fuel blend at an engine speed of 1800 rpm, while the highest increase, at 10.37%, was noted with the J5CNT60 fuel blend at 2200 rpm. Yilmaz, Vigil, and Donaldson [63] reported similar findings, noting a reduction in CO emissions from the CI engine.
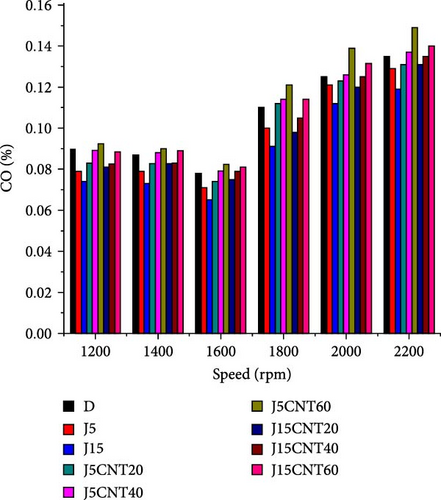
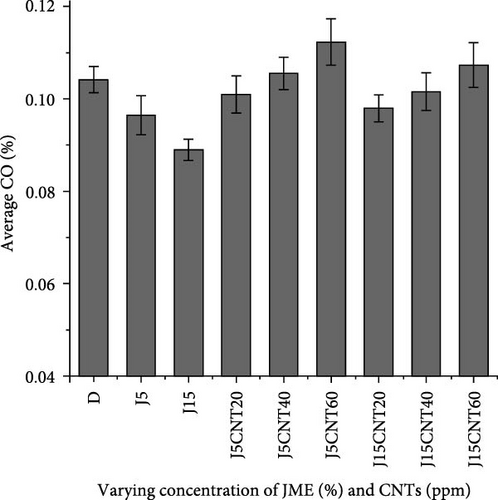
Blending biodiesel with pure diesel reduces CO emissions due to increased oxygen availability, which improves combustion efficiency. The additional oxygen from biodiesel allows for a more complete conversion of carbon atoms into CO2. Biodiesel’s lower stoichiometric air–fuel ratio means it needs less oxygen for combustion, resulting in higher EGT compared to pure diesel. Moreover, the high cetane number of biodiesel further lowers CO emissions.
However, adding more CNT to J5 and J15 blends leads to increased CO emissions. This rise is primarily due to inadequate oxygen in the engine cylinder, which causes incomplete combustion of the fuel. Additionally, incorporating CNT into the fuel decreases the EGT.
Figure 9b demonstrates the variation in average CO emissions from the engine across different fuel blends. The average CO emissions decreased by 7.36%, 14.56%, 3.07%, 5.97%, and 2.48% with the fuel blends J5, J15, J5CNT20, J15CNT20, and J15CNT40, respectively. Conversely, the average CO emissions increased by 1.32%, 7.81%, and 3.04% with the J5CNT40, J5CNT60, and J15CNT60 fuel blends, respectively.
3.6. CO2 Emissions
Figure 10a shows CO2 emissions for different fuel blends, with the peak emissions occurring at 1600 rpm. For Diesel, J5, and J15, the maximum CO2 emissions were 6.08%, 5.63%, and 5.39%, respectively, at 2200 rpm. In comparison, the highest CO2 emissions for blends with J5CNT20, J5CNT40, J5CNT60, J15CNT20, J15CNT40, and J15CNT60 were 5.81%, 6.17%, 6.65%, 5.69%, 5.94%, and 6.47%, respectively, at the same speed. All fuel blends exhibited a similar trend. Fuels with added biodiesel typically produce lower CO2 emissions than pure diesel. The highest reduction in CO2 emissions, at 20.86%, was observed for J5 at 1600 rpm. The reduced CO2 emissions for J5 and J15 suggest that the fuel underwent more complete combustion within the engine’s cylinder. The largest increase in CO2 emissions was 9.31% with the J5CNT60 blend at 2200 rpm.
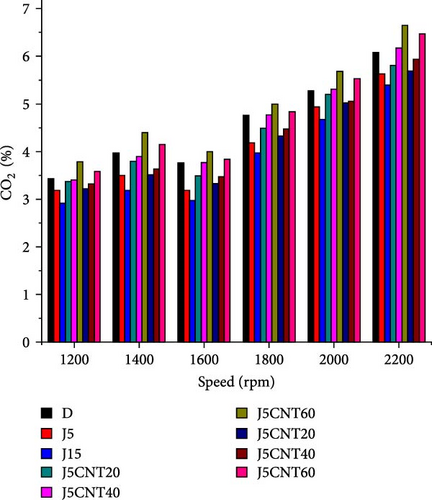
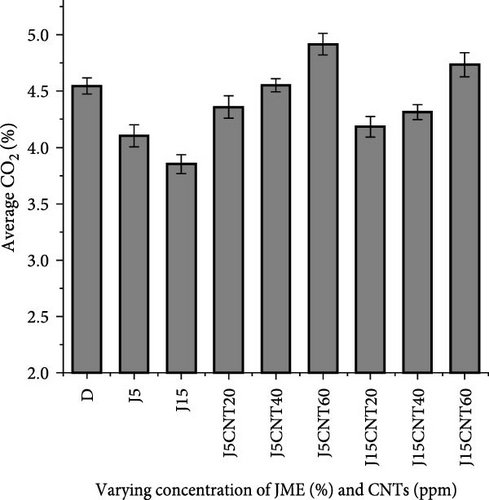
As the number of nanoparticles of CNT in the J5 and J15 fuel blends increases, the carbon content rises, leading to higher CO2 emissions. This increase in CO2 emissions is primarily due to insufficient oxygen in the engine cylinder, which causes incomplete combustion of the fuel. Additionally, the calorific value of the fuel blends has a significant impact on CO2 emissions. These observations align with findings from Razzaq et al. [61], who reported a 9.88% rise in CO2 emissions with the addition of CNT to pure diesel fuel.
Figure 10b shows the changes in average CO2 emissions across all fuel blends. The average CO emissions decreased by 9.75%, 15.26%, 4.12%, 7.96%, and 5.10% for the fuel blends J5, J15, J5CNT20, J15CNT20, and J15CNT40, respectively. In contrast, the average CO2 emissions increased by 0.12%, 8.14%, and 4.15% for the fuel blends J5CNT40, J5CNT60, and J15CNT60, respectively.
3.7. UHC Emissions
Figure 11a illustrates how UHC emissions vary with engine speed. The lowest UHC emissions were observed at 2200 rpm. A notable reduction of 10.12% in UHC emissions was achieved with the J15 fuel blend at 1800 rpm. In contrast, the highest increase in UHC emissions, 23.52%, occurred when using the J15CNT60 fuel blend at 2200 rpm.
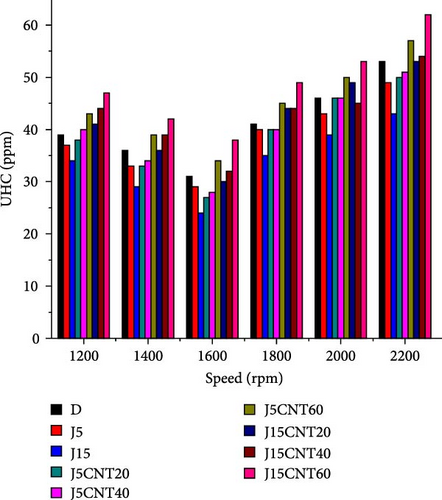

The decrease in UHC emissions with biodiesel-blended fuel is due to the earlier ignition of biodiesel and the extended duration for complete combustion. Research by Mohammed et al. [59] shows a 26.6% reduction in UHC emissions with the addition of biodiesel to the fuel, compared to using only pure diesel. Figure 11b illustrates the variation in average UHC emissions for the CI engine. The average UHC emissions decreased by 3.19% with the J5 and 7.28% with the J15 fuel blends. However, UHC emissions increased with the J5CNT20, J5CNT40, J5CNT60, J15CNT20, J15CNT40, and J15CNT60 fuel blends by 0.91%, 9.55%, 22.73%, 8.64%, 22.73%, and 35.00%, respectively.
3.8. NOx Emissions
Figure 12a illustrates the variation in NOx emissions at various engine speeds. The NOx emissions decreased by 12.84% with the J15 fuel blend at 2200 rpm. Conversely, the highest increase in NOx emissions, recorded at 24.06%, was observed with the J5CNT60 fuel blend at 1400 rpm. Kashyap, Das, and Kalita [64] reported similar findings in their research.
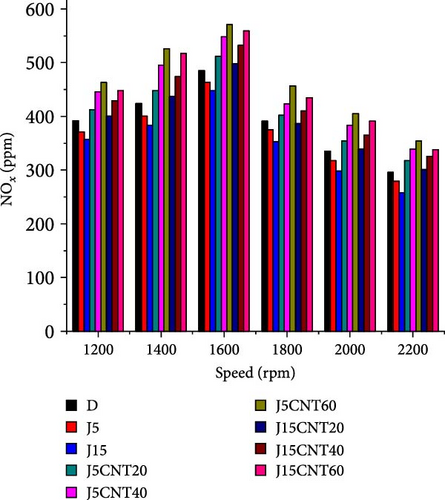
As the percentage of biodiesel increased from 5% to 15%, NOx emissions also rose. This increase in NOx emissions is influenced by reasons such as combustion chamber temperature, ignition delay, pressure, and the duration of the combustion process. The elevated oxygen content in biodiesel promotes more complete combustion. Furthermore, fuel blends with biodiesel exhibit more complex bsfc compared to neat diesel, leading to higher NOx levels in the exhaust gases.
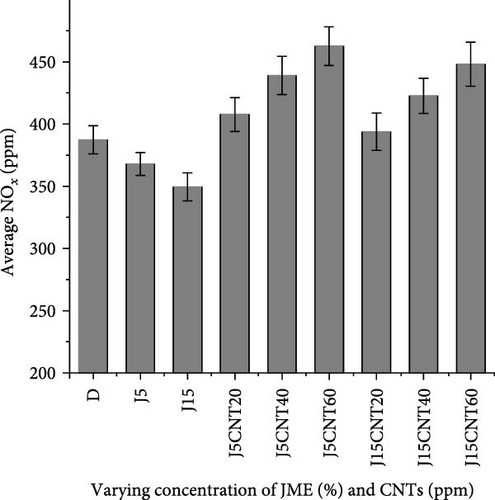
Figure 12b illustrates the changes in average NOx emissions across various fuel blends. The average NOx emissions were reduced by 5.00% with the J5 blend and by 9.73% with the J15 blend. In contrast, the NOx emissions increased by 5.30%, 13.39%, and 19.51% with the J5CNT20, J5CNT40, and J5CNT60 fuel blends, respectively, and by 1.73%, 9.17%, and 15.72% with the J15CNT20, J15CNT40, and J15CNT60 fuel blends, respectively.
3.9. SO
Figure 13a illustrates the impact of CNT and biodiesel on SO at various engine speeds. PM, the most complex of diesel engine emissions, consists of carbonaceous particulates or soot and the less concentrated, cooler exhaust gases that form the PM. As engine speed increases, SO decreases rapidly, the highest SO emissions were observed at 1200 rpm, while at 2200 rpm, the SO for pure diesel was recorded at 32.93%.
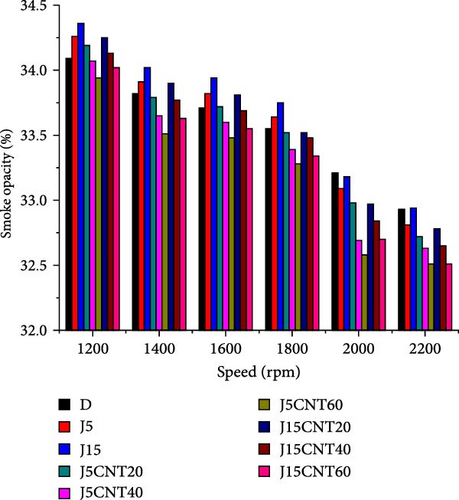

When biodiesel is added to pure diesel for J5 and J15 fuel blends, the SO, relative to the power produced, increases compared to pure diesel. For the J5 and J15 fuel blends, the SO was measured at 32.81% and 32.94%, respectively. Adding CNT to J5 and J15 blends reduced the SO compared to blends without CNT. Among the blends, the SO was highest with the J15 blend and lowest with the J5CNT60 blend. The greatest reduction in SO was 1.90% with the J15CNT60 blend at 2000 rpm, while the maximum increase was 0.80% at 1200 rpm.
Figure 13b shows the changes in average SO across various fuel blends. The average SO increases by 0.11% and 0.44% for the J5 and J15 fuel blends, respectively. In contrast, the SO decreases by 0.20%, 0.64%, 1.00%, 0.04%, 0.38%, and 0.78% for the J5CNT20, J5CNT40, J5CNT60, J15CNT20, J15CNT40, and J15CNT60 fuel blends, respectively. The notable reduction in SO can be attributed to the lowered viscosity resulting from the addition of CNT. Additionally, diesel particulate filters can greatly mitigate the respiratory health risks associated with PM emissions.
4. Statistical Evaluation of Experimental Results for Diesel Engines
The statistical analyses were conducted using Minitab 20.1.3 software, calculating p-values and F-values to evaluate the significance of the results at a 95% confidence level. It assesses how JME and CNT influence diesel engine performance metrics, such as BP, torque, BTE, and emission factors including CO, CO2, UHCs, NOx, and SO. For each attribute, p-values and F-values were calculated from various experimental data. The F-values exceeded 0.05, and the p-values were below 0.05. This indicates that, at a significance level of 0.05 (or a 95% confidence level), the differences between the data sets are substantial. Table 7 provides a comparison of p-values and F-values for various fuel blends, neat diesel, and the average values of bsfc, BTE, BP, and torque. The significant differences observed at a 95% confidence level indicate that the fuel additives substantially disturb engine performance parameters.
| Fuel blends | BTE (%) | bsfc (g/kWh) | BP (kW) | Torque (Nm) | ||||||||
|---|---|---|---|---|---|---|---|---|---|---|---|---|
| Δ (mean values) | p value | F value | Δ (mean values) | p value | F value | Δ (mean values) | p value | F value | Δ (mean values) | p value | F value | |
| J5 | 1.095 | 0.0056 | 6.951 | −9.785 | 0.0019 | 206.38 | 2.683 | 0.0051 | 385.90 | 4.653 | 0.035 | 5.659 |
| J15 | 0.917 | 0.0042 | 6.286 | −8.163 | 0.0008 | 251.67 | 2.262 | 0.0042 | 528.68 | 2.438 | 0.041 | 2.135 |
| J5CNT20 | 1.359 | 0.0061 | 5.934 | −10.867 | 0.0015 | 238.90 | 3.084 | 0.0039 | 589.23 | 5.950 | 0.028 | 2.958 |
| J5CNT40 | 1.650 | 0.0057 | 5.357 | −12.264 | 0.0012 | 229.52 | 3.407 | 0.0024 | 421.52 | 6.264 | 0.052 | 3.504 |
| J5CNT60 | 1.908 | 0.0049 | 5.650 | −13.960 | 0.0016 | 235.68 | 3.895 | 0.0046 | 510.08 | 6.759 | 0.015 | 4.918 |
| J15CNT20 | 1.164 | 0.0064 | 6.028 | −9.978 | 0.0014 | 250.28 | 2.680 | 0.0059 | 575.38 | 3.658 | 0.062 | 4.237 |
| J15CNT40 | 1.597 | 0.0039 | 5.706 | −10.861 | 0.0017 | 276.60 | 2.858 | 0.0048 | 681.06 | 5.365 | 0.054 | 3.902 |
| J15CNT60 | 1.706 | 0.0047 | 5.392 | −11.709 | 0.0011 | 247.09 | 3.354 | 0.0063 | 652.84 | 6.068 | 0.046 | 3.172 |
- Abbreviations: BP, brake power; bsfc, brake-specific fuel consumption; BTE, brake thermal efficiency.
Multiple linear regression models were developed to quantify the relationship between the independent variables (biodiesel concentration, CNT concentration, engine speed) and dependent variables (performance metrics and emissions). The models showed that engine speed and CNT concentration had the strongest effects on BP, torque, and BTE, while biodiesel percentage also contributed, especially in emission reductions. Standardized regression coefficients were calculated to rank the influence of each independent variable. Engine speed and CNT concentration were the most influential factors, followed by biodiesel percentage. Interaction terms revealed a synergistic effect between biodiesel and CNTs, enhancing performance more than either factor alone.
Table 8 shows the emission values for UHC, NOx, CO2, CO, and SO of the diesel engine, which vary significantly between fuel-additive treated blends and pure diesel (D). Regarding SO, fuel blends with CNT exhibit a distinct pattern compared to those treated with JME. The symbol ∆ (mean values) represents the variation between the average values of each characteristic for pure diesel (D) and other fuel blends. Negative or positive values indicate that the parameters for pure diesel (D) were either higher or lower than those for the other blends. The significant differences observed are validated by p-values below 0.05 and high F-values.
| Fuel blends | CO (%) | CO2 (%) | UHC (ppm) | NOx (ppm) | Smoke (%) | ||||||||||
|---|---|---|---|---|---|---|---|---|---|---|---|---|---|---|---|
| Δ (mean values) | p value | F value | Δ (mean values) | p value | F value | Δ (mean values) | p value | F value | Δ (mean values) | p value | F value | Δ (mean values) | p value | F value | |
| J5 | 1.927 | 0.0101 | 8.208 | 6.208 | 0.0075 | 42.393 | 19.815 | 0.054 | 103.123 | 13.695 | 0.0107 | 19.726 | −0.652 | 0.0046 | 5.750 |
| J15 | 1.358 | 0.0092 | 7.543 | 5.724 | 0.0066 | 67.683 | 15.640 | 0.06 | 128.413 | 11.058 | 0.0084 | 45.016 | −0.808 | 0.0051 | 5.085 |
| J5CNT20 | 2.163 | 0.0089 | 7.191 | 6.598 | 0.0063 | 54.913 | 23.908 | 0.047 | 115.643 | 14.250 | 0.0100 | 32.246 | −0.184 | 0.0029 | 4.733 |
| J5CNT40 | 2.492 | 0.0074 | 6.614 | 6.905 | 0.0048 | 45.533 | 28.162 | 0.071 | 106.263 | 16.957 | 0.0081 | 22.866 | 0.681 | 0.0018 | 4.156 |
| J5CNT60 | 2.908 | 0.0096 | 6.907 | 7.516 | 0.0070 | 51.693 | 32.509 | 0.042 | 112.423 | 19.360 | 0.0095 | 29.026 | 1.806 | 0.0048 | 4.449 |
| J15CNT20 | 1.705 | 0.0109 | 7.285 | 6.127 | 0.0083 | 66.293 | 20.952 | 0.089 | 127.023 | 13.067 | 0.0123 | 43.626 | 0.171 | 0.0046 | 4.827 |
| J15CNT40 | 2.068 | 0.0098 | 6.963 | 6.591 | 0.0072 | 92.613 | 25.830 | 0.081 | 153.343 | 16.194 | 0.0087 | 69.946 | 0.580 | 0.0060 | 4.505 |
| J15CNT60 | 2.519 | 0.0113 | 6.649 | 6.991 | 0.0087 | 63.103 | 29.058 | 0.073 | 123.833 | 17.992 | 0.0110 | 40.436 | 1.197 | 0.0067 | 4.191 |
- Abbreviations: CO, carbon monoxide; CO2, carbon dioxide; NOx, nitrogen oxide; UHC, unburned hydrocarbon.
5. Fuel Conversion Efficiency and Energy Balance Between the Emissions and Performance Parameters of JME and CNT Blends
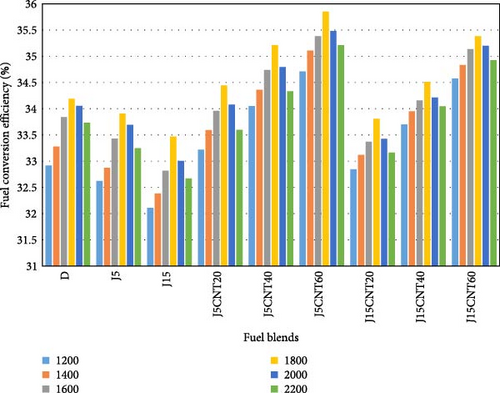
The fuel conversion efficiency (ηf) of a CI engine is defined as the ratio of the mechanical work generated by the engine to the energy content of the diesel fuel it consumes. This efficiency is evaluated for each fuel blend, as shown in Figure 14. It has been observed that CNT enhances fuel conversion efficiency more effectively with J5 fuel blends than with J15 blends. This improvement is due to a higher cetane index, a slight reduction in kinematic viscosity, and the superior performance of CNT when combined with lower concentrations of JME. Even J15CNT40 achieves a fuel conversion efficiency similar to that of J5CNT20. Generally, fuel conversion efficiency decreases at higher speeds due to increased fuel consumption but improves from lower to medium speeds.
In this study, a specific fuel blend was identified to achieve an optimal balance between engine emissions and performance. The most effective fuel blend was chosen based on its performance and emission characteristics. Figure 15 displays the maximum percentage variation in BTE, bsfc, BP, torque, CO2, CO, UHC, NOx, and SO across various fuel blends—J5CNT20, J5CNT40, J5CNT60, J15CNT20, J15CNT40, and J15CNT60—at engine speed from 1200 to 2200 rpm, with increments of 200 rpm. It is evident that BTE, BP, and torque increase while bsfc decreases with all fuel blends. The J5CNT60 fuel blend shows the greatest improvement in torque and reduction in bsfc. CO and SO are reduced with all fuel blends, with the lowest CO levels observed for J15CNT20. Additionally, CO2, UHC, and NOx levels increase with higher concentrations of CNT. The J15CNT60 blend gave the highest UHC emissions, while the J5CNT20 and J15CNT60 blends have the lowest and highest NOx formation rates, respectively.
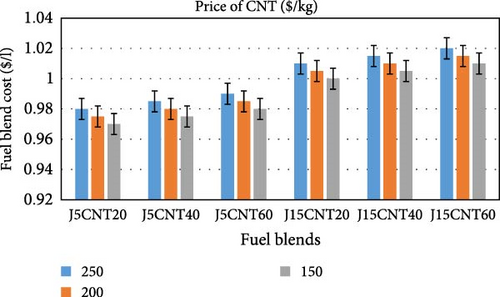
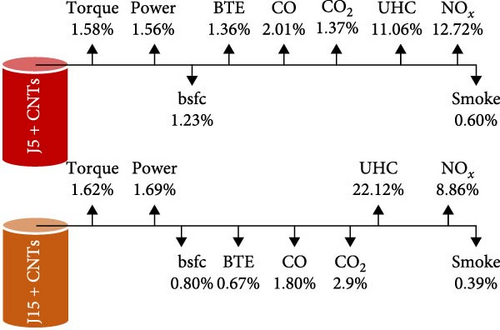
Figure 16 illustrates the percentage variations in average engine characteristics for pure diesel, J5 + CNT, and J15 + CNT fuel blends. Generally, the BP, torque, UHCs, and NOx increase by 1.58%, 1.56%, 11.06%, and 12.72% with J5 + CNT blends, and by 1.62%, 1.69%, 22.12%, and 8.86% with J15 + CNT blends, respectively. The average bsfc decreases by 1.23% with J5 + CNT and by 0.80% with J15 + CNT blends. The percentage of average BTE increases by 1.36% with J5 + CNT and decreases by 0.67% with J15 + CNT blends. The average CO increases by 2.01% with J5 + CNT and decreases by 1.80% with J15 + CNT blends. Additionally, the proportion of average CO2 decreases by 2.9% with J15 + CNT blends and increases by 1.37% with J5 + CNT blends. The average SO2 decrease by 0.60% with J5 + CNT and by 0.39% with J15 + CNT blends. On average, J15 + CNT combinations produce 2.14%, 1.05%, and 16.4% more torque, BP, and UHC compared to J5 + CNT blends. The J15 + CNT blend results in reductions of 1.56%, 6.24%, 4.95%, 10.36%, 20.51%, and 2.38% in CO, BTE, bsfc, CO2, NOx, and smoke, respectively, compared to J5 + CNT blends. The effects of JME biodiesel and CNT on each characteristic considered in the study are summarized in Table 9.
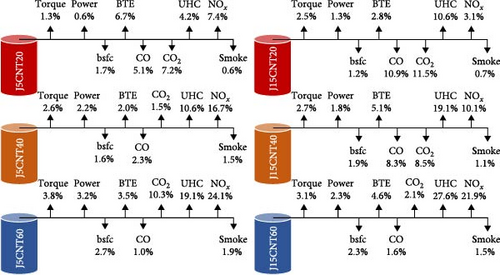
| Fuel blends | ∆ Torque | ∆ BP | ∆ bsfc | ∆ BTE | ∆ CO | ∆ CO2 | ∆ UHC | ∆ NOx | ∆ Smoke |
|---|---|---|---|---|---|---|---|---|---|
| J5CNT20 | 1.3% ↑ | 0.6% ↑ | 1.7% ↓ | 6.7% ↑ | 5.1% ↓ | 7.2% ↓ | 4.2% ↑ | 7.4% ↑ | 0.6% ↓ |
| J5CNT40 | 2.6% ↑ | 2.2% ↑ | 1.6% ↓ | 2.0% ↑ | 2.3% ↓ | 1.5% ↑ | 10.6% ↑ | 16.7% ↑ | 1.5% ↓ |
| J5CNT60 | 3.8% ↑ | 3.2% ↑ | 2.7% ↓ | 3.5% ↑ | 1.0% ↓ | 10.3% ↑ | 19.1% ↑ | 24.1% ↑ | 1.9% ↓ |
| J15CNT20 | 2.5% ↑ | 1.3% ↑ | 1.2% ↓ | 2.8% ↑ | 10.9% ↓ | 11.5% ↓ | 10.6% ↑ | 3.1% ↑ | 0.7% ↓ |
| J14CNT40 | 2.7% ↑ | 1.8% ↑ | 1.9% ↓ | 5.1% ↑ | 8.3% ↓ | 8.5% ↓ | 19.1% ↑ | 10.1% ↑ | 1.1% ↓ |
| J15CNT60 | 3.1% ↑ | 2.3% ↑ | 2.3% ↓ | 4.6% ↑ | 1.6% ↓ | 2.1% ↑ | 27.6% ↑ | 21.9% ↑ | 1.5% ↓ |
- Note: Upward arrows indicate an increase, while downward arrows indicate a decrease in efficiency and emission parameters.
- Abbreviations: BP, brake power; bsfc, brake-specific fuel consumption; BTE, brake thermal efficiency; CO, carbon monoxide; CO2, carbon dioxide; NOx, nitrogen oxide; UHC, unburned hydrocarbon.
Given the previous discussion, the J5CNT60 emerges as the ideal fuel blend. According to the literature, CNT, despite being a carbon-based substance, can pose several health risks even in minimal amounts. In contrast, biodiesel derived from JME is nontoxic and environmentally friendly. Nanoparticles are frequently employed in industrial applications such as warmers, steam boilers, combustion turbines, and IC engines (both compression and spark ignition) to enhance engine performance while reducing fuel consumption [65]. Even a slight reduction in fuel combustion can result in significant fuel savings in large-scale processing sectors and power plants, notably improving vehicle mileage and fuel efficiency in public transportation. Furthermore, a slight decrease in emissions is an added benefit.
6. Cost Analysis
In 2024, the cost of CNT in recent research conducted in Pakistan, including importation, shipping, and customs, is approximately $250 per kilogram. Biodiesel supplied by PSO in Pakistan costs about $3 per liter. Fuel blends are prepared by mixing 20, 40, and 60 mg/l of CNT with pure diesel. Biodiesel is added at concentrations of 5% and 15% to pure diesel to create the fuel blends. The cost for fuel blends containing 5% biodiesel and varying concentrations of CNT is $0.020, $0.025, and $0.030 per liter, respectively. For fuel blends with 15% biodiesel and different concentrations of CNT, the costs are $0.50, $0.55, and $0.60 per liter, respectively. In Pakistan, the price of diesel is around $0.96 per liter. When adding 5% biodiesel and the mentioned concentrations of CNT to pure diesel, the price increases by 2.04%, 2.53%, and 3.03%, respectively. Similarly, the price increases by 4.95%, 5.41%, and 5.88% when the same concentrations of CNT are combined with 15% biodiesel. Using CNT with 5% and 15% biodiesel concentrations can reduce bsfc by up to 2.64% and 2.28%, respectively. A comparison of fuel blends at different prices of CNT is shown in Figure 15. Due to the high cost of CNT from importation, shipping, and customs fees, large-scale use in commercial diesel is currently uneconomical in Pakistan. However, if these nanoparticle additives were produced domestically, their cost could be reduced by ~30%. In the United States, where nanoparticles cost around $130 per kilogram, using them as additives is more financially feasible. Additional advantages, including lower exhaust emissions and bsfc, can be assessed to advocate for the use of these nanoparticle additives.
7. Comparison With Previous Studies
This study demonstrates that the combination of JME biodiesel and CNT improves both engine performance and emissions as demonstrated in Figures 16 and 17. The addition of JME biodiesel significantly reduced emissions of NOx, CO, CO2, and UHCs, with reductions of up to 12.84% for NOx and 10.12% for UHC. CNT enhanced combustion efficiency, leading to improvements in BP, torque, and BTE, with the J5CNT60 blend showing a 3.84% increase in torque and a 6.72% improvement in BTE. At higher CNT concentrations, CO2 and NOx emissions increased, but CO and SO were reduced.
Compared to previous studies, the JME-CNT blends in this study offer a balanced approach, achieving both performance gains and emission reductions, particularly in CO and SO, as detailed in Table 10. This confirms the potential of JME-CNT blends as a sustainable and efficient alternative to conventional fuels.
| References | Additives used | Torque | BP | BTE | bsfc | CO | CO2 | UHC | NOx | Smoke |
|---|---|---|---|---|---|---|---|---|---|---|
| Pure diesel | None | Baseline properties of pure diesel | ||||||||
| [17] | Copper oxide | 1% ↑ | — | 3.2% ↑ | 1.2% ↑ | 5% ↓ | 4.2% ↑ | 2.3% ↓ | 2% ↓ | — |
| [18] | Ferrous picrate | — | — | 3.4% ↑ | 2.1% | — | — | 3.1% ↓ | — | 2.4% ↓ |
| [19] | Aluminum oxide | — | 5.4% ↑ | 5.4% ↑ | 10.6% ↑ | 3% ↓ | 1.6% ↓ | 1.7% ↓ | 43.6% ↑ | — |
| [20] | Titanium oxide | — | — | 1% ↑ | 2.1% | 25% ↓ | — | — | 32% ↑ | 1.3% ↓ |
| [22] | Manganese | 14% ↑ | 12.9% ↑ | — | 8.2% ↓ | 12.4% ↓ | 7.2% ↑ | — | 18.7% ↑ | — |
| [1] | Graphite | 2.8% ↑ | 9.6% ↑ | 4.1% ↑ | 2.6% ↓ | 14.2% ↑ | — | — | 18.1% ↑ | — |
| Present study | CNT | 3.8% ↑ | 3.2% ↑ | 6.7% ↑ | 2.7% ↓ | 10.9% ↓ | 11.5% | 19.1% ↑ | 21.9% ↑ | 1.9% ↓ |
- Note: Upward arrows indicate an increase, while downward arrows indicate a decrease in efficiency and emission parameters.
- Abbreviations: BP, brake power; bsfc, brake-specific fuel consumption; BTE, brake thermal efficiency; CO, carbon monoxide; CO2, carbon dioxide; NOx, nitrogen oxide; UHC, unburned hydrocarbon.
8. Conclusions
In the experimental study, a four-stroke, water-cooled, three-cylinder CI engine was utilized to examine how CNT and JME influence engine emissions and performance. JME was mixed with pure diesel at 5% and 15% concentrations, resulting in J5 and J15 blends. CNTs were incorporated into these blends at levels of 20, 40, and 60 ppm. An eddy-current dynamometer was used to evaluate performance metrics such as torque, BP, BTE, and bsfc. The engine operated under full load conditions across a speed range of 1200–2200 rpm, in 200 rpm intervals. CO2, CO, NOx, and UHCs were analyzed with the AVL DITEST, while SO was measured using a smoke meter.
- •
The J5CNT60 fuel blend produced a 3.84% increase in maximum torque at an engine speed of 1400 rpm compared to pure diesel.
- •
The J5CNT20 fuel blend achieved the highest BTE improvement of 6.72% at 1400 rpm.
- •
When compared to pure diesel, the J5CNT60 fuel blend resulted in a maximum reduction of 2.65% in bsfc at 1600 rpm.
- •
CO emissions were reduced by 17.28% at 1800 rpm using the J15 fuel blend, while the J5CNT60 blend caused a 10.37% increase in CO emissions at 2200 rpm.
- •
The J5CNT60 fuel blend led to a maximum reduction of 20.86% in CO2 emissions at 2200 rpm, but also showed a 9.31% increase in CO2 emissions at the same speed.
- •
The J15 fuel blend achieved a 10.12% reduction in UHCs emissions at 1800 rpm, while the J15CNT60 blend caused a 23.52% increase in UHC emissions at 2200 rpm.
- •
NOx emissions decreased by 12.84% at 2200 rpm with the J15 fuel blend, whereas the J5CNT60 blend resulted in the highest NOx emissions increase of 24.06% at 1400 rpm.
- •
Smoke emissions were reduced by 1.90% with the J15CNT60 fuel blend at 2000 rpm, while the highest increase in SO was 0.80% at 1200 rpm.
- •
In summary, the J5CNT60 fuel blend showed the greatest performance enhancements, whereas the J15 fuel blend resulted in the most notable emission reductions. Consequently, J5CNT60 and J15 were found to be the most effective fuels in this study.
The J5CNT60 fuel blend, containing 5% JME and 60 ppm CNT, significantly improved engine performance, increasing torque by 3.84%, BTE by 6.72%, and reducing bsfc by 2.65%. Further studies should focus on optimizing fuel blends for different engine conditions, evaluating long-term engine durability, and assessing the economic feasibility of using CNTs on a larger scale.
A policy could be developed and implemented at both the national and international levels to support and promote the use of biodiesel and CNT blends with conventional diesel fuel. This approach would contribute to the sustainability of fuel reserves, reduce capital expenditures, and improve environmental cleanliness.
Nomenclature
-
- ASTM:
-
- American Society for Testing and Materials
-
- BMEP:
-
- Brake mean effective pressure
-
- bsfc:
-
- Brake-specific fuel consumption
-
- BTE:
-
- Brake thermal efficiency
-
- CI:
-
- Compression Ignition
-
- CNT:
-
- Carbon nanotubes
-
- CO:
-
- Carbon monoxide
-
- CO2:
-
- Carbon dioxide
-
- D:
-
- Pure diesel
-
- DAQ:
-
- Data acquisition unit
-
- EGT:
-
- Exhaust gas temperature
-
- EEVO:
-
- Early exhaust valve opening
-
- FIP:
-
- Fuel injection pressure
-
- FPC:
-
- Ferrous picrate combustion catalyst
-
- g:
-
- Gram
-
- J5:
-
- 95% D + 5% JME
-
- J5CNT20:
-
- J5 + 20 ppm CNT
-
- J5CNT40:
-
- J5 + 40 ppm CNT
-
- J5CNT60:
-
- J5 + 60 ppm CNT
-
- J15:
-
- 85% D + 15% JME
-
- J15CNT20:
-
- J15 + 20 ppm CNT
-
- J15CNT40:
-
- J15 + 40 ppm CNT
-
- J15CNT60:
-
- J15 + 60 ppm CNT
-
- JME:
-
- Jojoba methyl ester
-
- kW:
-
- Kilowatt
-
- kWh:
-
- Kilowatt-hour
-
- m3:
-
- Cubic meter
-
- mg:
-
- Milligram
-
- mm:
-
- Millimeter
-
- MWCNT:
-
- Multiwalled carbon nanotubes
-
- Nm:
-
- Newton meter
-
- NOx:
-
- Nitrogen oxide
-
- °C:
-
- Centigrade degree
-
- ppm:
-
- Parts per million
-
- rpm:
-
- Revolution per minute
-
- SWCNT:
-
- Single-walled carbon nanotubes
-
- SO:
-
- Smoke opacity
-
- SOI:
-
- Start of injection timing
-
- TIP:
-
- Turbulence inducer piston
-
- UHCs:
-
- Unburned hydrocarbons.
Conflicts of Interest
The authors declare no conflicts of interest.
Author Contributions
Muhammad Sarfraz Ali: conceptualization, methodology, software, formal analysis, writing–original draft. Asad Naeem Shah: supervision, writing–review and editing. Sadia Saleem: software, resources, writing–review and editing. Ammar Ahmad: investigation, resources, writing–review and editing, data curation. Ali Azam: investigation, validation, writing–review and editing. Zafar Abbas: validation, investigation. Shanawar Hamid: writing–review and editing, validation. Eustache Hakizimana: writing–review and editing. Sadia Saleem contributed equally to this work and should be listed as cofirst author.
Funding
No funding was received for this research.
Acknowledgments
The authors are pleased to acknowledge the valuable guidance and assistance from Engr. Muhammad Asif HSE Pakistan.
Open Research
Data Availability Statement
The research data supporting the findings of this study are not shared.


