Assessing the Performance of Point and Two-Point Kinetics Models in Simulating the Control Rod Drop Accident in VVER-1000 Reactors
Abstract
Reactivity-initiated accidents (RIAs), such as the control rod drop accident (CRDA), are classified as design-basis accidents (DBAs) in the final safety analysis report (FSAR) of a nuclear power plant (NPP), and investigating these events is crucial. Therefore, point kinetics (PK) and two-point kinetics (2PK) models of a real VVER-1000 reactor have been simulated and evaluated to assess their ability to reproduce CRDA dynamics. Additionally, the simulation results of these two models have been validated against the FSAR data for a rapid-transient CRDA to examine various dynamic parameters. The reactor model was simulated in MATLAB Simulink. The model results show small deviations compared to the FSAR. Therefore, a PK model provides a reasonable degree of accuracy in the evaluation of such fast-paced incidents.
1. Introduction
The point kinetics (PK) model is commonly used to represent the nonlinear dynamic behavior of a nuclear power plant (NPP). However, this model lacks sufficient accuracy under all operating conditions. The control rod drop accident (CRDA) is a critical scenario classified as a design-basis accident (DBA) in the final safety analysis report (FSAR) and must be analyzed as a reactivity-initiated accident (RIA). Such analysis is essential for assessing the stability of the reactor following this type of incident.
An investigation has been conducted on the CRDA of Laguna Verde Boiling Water Reactor (BWR) NPP. Solís-Rodarte et al. [1] investigated CRDA using two coupled codes: TRAC-BF1/NEM and TRAC-BF1/ENTREE, which refer to themselves based on a real reactor. Later, Solis et al. [2] evaluated the reactor safety parameters in the CRDA scenario through the parallel coupling of the COBRA-TF and TRAC-BF1/NEM codes. This paper presents an advanced approach to modeling and analyzing control rod failure events in BWR, using parallel computing and multilevel code coupling. This method can be modified or used as a reference for similar studies in VVER-1000 reactors, especially in code pair, parallel computing and dynamic identification of constraint conditions under CRDA. Ivanov and Avramova [3] used the coupled TRACE/PARCS algorithm to examine the behavior of CRDA analysis. At the local (pin level) and global (assembly level) scales, his research investigates interconnected phenomena and modeling challenges. Similarly, in a CRDA scenario for a BWR, Jernkvist [4] examined combustion rate-dependent enthalpy thresholds. To determine fuel enthalpy limits for liner tube failure and melt initiation, this study examines the thermomechanical behavior of high-burnup UO2 fuel rods during RIAs. Extensive property of the mechanical properties of zircaloy sheath materials served as the basis for the analysis. Parizhkari et al. [5] have investigated CRDA in Bushehr VVER-1000 NPP using multipoint kinetics (MPK) methods. They used two, three and six nodes in their case studies. Polach and Hajžman [6] investigated a multibody model of a VVER-1000 nuclear reactor unit, focused on modeling the moving parts during the meltdown. They presented a multiscale model of the VVER-1000 reactor control unit that simulated the failure of the control the control rod cluster during an earthquake. Their model evaluated operational reliability by analyzing the effects of modifying the fuel assembly guide tube. Cheng et al. [7] used numerical simulations to study the hydrodynamics of falling control rods. In their research into the mechanical failure of control rods in nuclear reactors, they used three-dimensional numerical models to examine shock forces and failure times. The paper does not directly address the VVER-1000 reactor or the state of research on force rod failure Accident in these reactors.
Wang et al. [8] studied the analysis and management of a sudden migration in a closed bank. To increase the stability and reliability of the signaling and control system of a third-generation nuclear reactor, they are studying this phenomenon. The information from his study can be used for comparable events in VVER-1000 reactors. Zhao et al. [9] developed an integrated physical model and a time-step adaptive symplectic (TSAS) algorithm to analyze the dynamics of control rod drop in nuclear reactors. The model employs a unified coupling state equation to simultaneously simulate control rod motion and fluid flow, effectively addressing nonsmooth behaviors in the process. The TSAS algorithm accurately captures sudden changes in flow state, enhancing prediction accuracy, and its performance was validated against commercial software and experimental data. Wu et al. [10] introduced the adaptive collocation stochastic perturbation (ACSP) method for uncertainty analysis of control rod drop dynamics in nuclear reactors. By integrating sensitivity and correlation analyses, the method effectively identifies key parameters and outperforms traditional approaches in both precision and computational efficiency, as validated against Monte Carlo simulations. Yang et al. [11] proposed the UA-CRD framework, which combines an interval process model with the CMA-ES evolutionary algorithm to efficiently analyze time-variant epistemic uncertainties in control rod drop dynamics. The framework improves computational performance and accuracy over traditional methods, emphasizing the critical impact of time-dependent factors like mechanical friction in safety analyses.
When examining long-term transients, when axial xenon oscillations arise as a result of variations in the axial power distribution, the MPK model is especially well-suited. CRDA events, on the other hand, take place across brief transients. Other reactivity feedback mechanisms stabilize the reactor within safety margins following such abrupt transients. As a result, this model offers little useful information on stability during brief transients. This finding might be verified, however, by additional research into alternative MPK models, such as two-point kinetics (2PK) model.
The results were compared and validated with real FSAR data from the VVER-1000 NPP [12]. It should be noted that the Russian Federal Agency on Atomic Energy was transformed into the State Atomic Energy Corporation Rosatom in 2007. With this validation, we can evaluate the dynamic additions. This study provides a comprehensive understanding of nuclear reactor safety analysis, demonstrating the usefulness of the PK model for simulating CRDA projects in VVER-1000 reactors. It provides a reliable safety assessment tool and software that nuclear engineers can use to optimize reactor control systems and increase safety margins. Furthermore, the focus on model selection based on short-term conditions emphasizes the importance of a proper approach for proper reactor safety analysis.
2. Materials and Method
2.1. Reactor Model
The 9th and 11th order models are used for nonlinear simulations, validation, and comparison. In nuclear power plants (NPPs), oscillations in the axial power distribution lead to axial xenon oscillations over long-term transients. Therefore, it is preferable to use an MPK model during normal reactor operation. However, a CRDA is characterized by its rapid timescale, such that the delayed effects of xenon are not yet significant. Thus, using the PK model alone appears sufficient. The effects of fuel temperature, coolant temperature, and xenon feedback are considered in the reactor dynamics. To support this claim, 20th and 16th order 2PK models are applied in simulations, both with and without xenon feedback effects.
2.2. Neutronic Model
2.3. Xenon and Iodine Model
2.4. Fuel and Coolant Model
2.5. Total Induced Reactivity
According to the FSAR, δρr represents the induced reactivity due to the rapid drop of the overall control rod within 4 s. The parameter values listed in Table 1 are used for the reactor model at the middle of the cycle (MOC). MOC is the intermediate phase of the fuel cycle. During this phase, the fuel is partially spent, and the reactor operates in a relatively stable state as the concentrations of fissile materials and fission products approach equilibrium. Adjusting the control rods and neutron-absorbing materials at this stage is essential for maintaining the safety and efficiency of the reactor.
| Parameter | Value | Parameter | Value |
|---|---|---|---|
| Thermal power | 3000 MW | β5 | 0.0007475 |
| Core height | 358 cm | β6 | 0.000273 |
| Core diameter | 316 cm | γI | 0.059 |
| ff | 0.91 | γX | 0.003 |
| G | 3.2 × 10⁻¹¹ MW · s | λ1 | 0.0124 s−1 |
| Gr | 62 × 10−5 δK/K | λ2 | 0.0305 s−1 |
| l | 10−4 s | λ3 | 0.111 s−1 |
| M | 102 MW/°C | λ4 | 0.301 s−1 |
| Te | 291 °C | λ5 | 1.14 s−1 |
| αc | −21.3 × 10⁻⁵ (δK/K)/°C | λ6 | 3.01 s−1 |
| αf | −3.24 × 10⁻⁵(δK/K)/°C | λI | 2.9 × 10⁻⁵ s−1 |
| αX | 3.5 × 10⁻¹⁸ (δK/K) · cm3 | λX | 2.1 × 10⁻⁵ s−1 |
| β | 0.0065 | μc | 55.8 MW · s/°C |
| β1 | 0.00002145 | μf | 26.3 MW · s/°C |
| β2 | 0.0014235 | Σf | 0.3358 s−1 |
| β3 | 0.001274 | Ω | 6.6MW/°C |
| β4 | 0.0025675 | — | — |
2.6. Models Assumptions
In the present study, the impact of structural uncertainties (such as variations in physical parameters, material inhomogeneities, or geometric changes) on simulation results has not been explicitly investigated. The modeling performed is based on simplified assumptions and constant values for fuel cycle parameters (such as βi, λi, and Σf). While these assumptions increase computational speed and allow for a focus on the rapid dynamics of the accident (this research), they may overlook the effects of long-term changes or inherent uncertainties in the system parameters. Examining these uncertainties using methods like advanced sensitivity analysis or probabilistic approaches (such as those mentioned in references [17] and [10]) could improve the accuracy of the models and enhance the reliability of predictions under diverse operational conditions.
- 1.
Uniform Power Distribution: In the PK model, the neutron flux and power density are assumed to be spatially uniform across the reactor core. This simplification reduces computational complexity but neglects localized power variations. In the 2PK model, the core is divided axially into two halves, but radial power gradients are ignored.
- 2.
Linear Temperature-Reactivity Feedback: αf and αc are modeled as linear functions, independent of spatial or temporal heterogeneities.
- 3.
Xenon Dynamics: Xenon-135 concentration is assumed to be uniform within each axial half of the core (for the 2PK model).
- 4.
Constant Fuel Cycle Parameters: Parameters, such as βi, λi, and Σf are held constant, disregarding burnup-dependent changes during the simulation.
- 5.
Control Rod Drop Time: The control rod insertion is modeled as an instantaneous reactivity ramp completed within 4 s, as per FSAR specifications. Hydrodynamic effects (e.g., turbulence, vibration, guide tube friction, coolant flow resistance, and gravitational acceleration) during rod motion are not considered.
2.7. CRDA
CRDA is classified as a DBA in the FSAR. After this event, the reactor power decreases, the primary pressure and the turbine steam flow rate decrease. As a result, the maximum power ratio increases. In this situation, the compressor maintains the primary loop pressure at 15.7 MPa, while the turbine controller adjusts the secondary pressure. From a safety perspective, the primary loop pressure must remain below 135% of the design limit. The CRDA sends a negative reaction into the reactor core. In the proposed real reactor, the entire control rod falls into the core within 4 s [12].
The current model simplifies control rod movement by using a fixed drop time (4 s from FSAR) and ignoring the effects of the mechanical dynamics of the process (such as friction between the rod and guide tube, coolant flow resistance, and gravitational acceleration). This is okay for quick CRDA simulations (present study) but might miss real-world variations. Future improvements should include a more detailed mechanical-hydrodynamic model and sensitivity analyses on key parameters to better understand result variability and system reliability. Advanced coupled physics-mechanics modeling (using methods in references [9, 11]) could be used in future work.
3. Results and Discussion
The dynamic reactor models described in Section 2 are implemented in the MATLAB Simulink environment. The developed MATLAB Simulink model offers several key advantages, including modular structure, flexibility in adjusting reactor dynamics parameters (e.g., fuel and coolant temperature feedback, xenon effects), ease of integrating custom feedback controllers, transparent numerical schemes, high computational speed for rapid transient simulations, and direct integration with experimental data from the FSAR. The system of differential equations was solved using MATLAB’s ode23tb (TR-BDF2) solver, which combines the trapezoidal rule and backward differentiation formula (BDF2) to efficiently handle stiff systems. This solver was chosen for its exceptional computational speed while maintaining accuracy comparable to ode45, making it particularly suitable for our problem. We specified a relative tolerance of 1e–6 to ensure solution precision, with the absolute tolerance automatically adjusted by the solver. The reactor operates initially at equilibrium power (100% power). Within 4 s, the control rods are rapidly inserted [12], creating a ramp reactivity as per the CRDA scenario applied to the core. The impact of this reactivity is analyzed both with and without xenon feedback, using the PK and 2PK models.
Figure 1 shows the simulation results and a comparison with the FSAR. The maximum power deviation between the PK and 2PK model results and the FSAR data post-CRDA was observed as 6.2% and 9.8%, respectively, during the rapid transient phase (0–4 s). These peak deviations align with the safety margin of 10% for transient errors specified in ISO 26802. Late-phase discrepancies (toward the end of the simulation timeline) reached 4.2% (PK) and 6.8% (2PK). All deviations remained within the ± 7% threshold defined by the ANSI/ANS-20.1 standard for post-transient stability analysis.
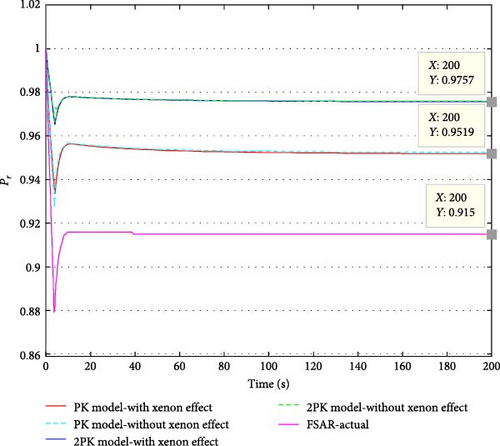
Given the low margin of error, the models used can be considered validated, allowing for the evaluation of additional dynamic parameter variations.
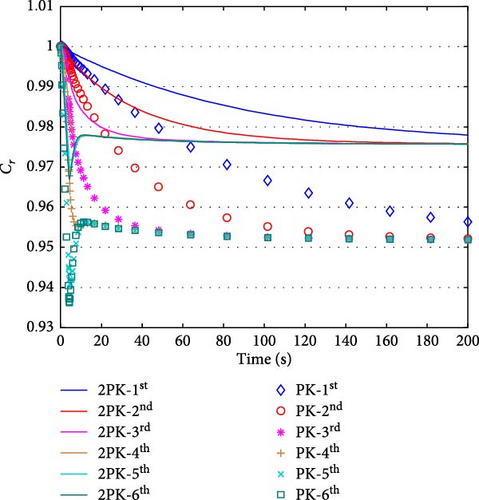
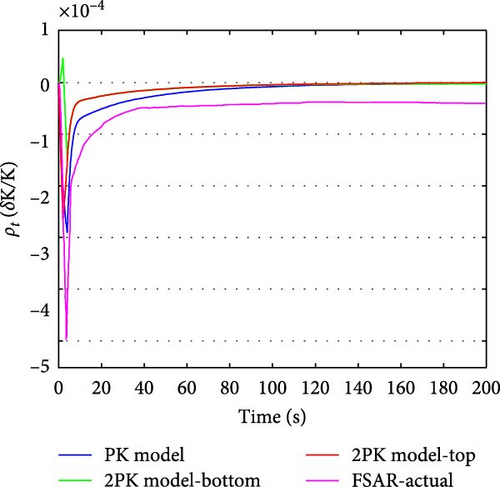
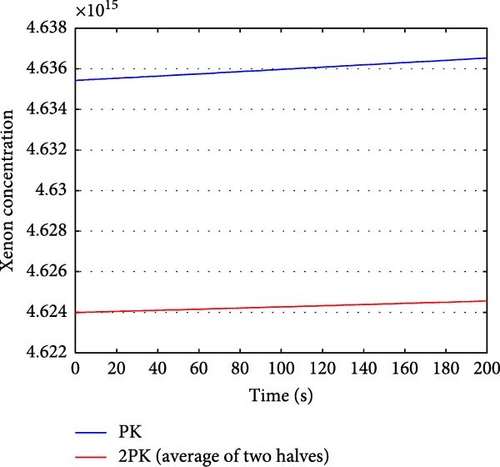
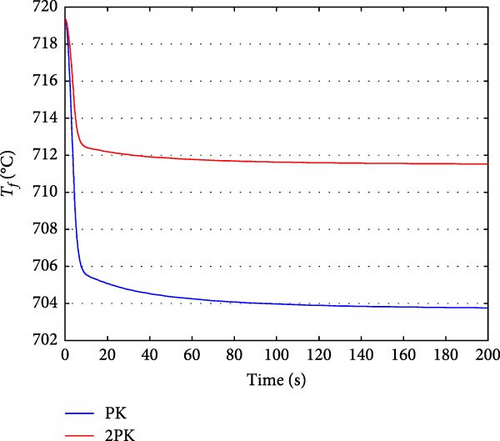
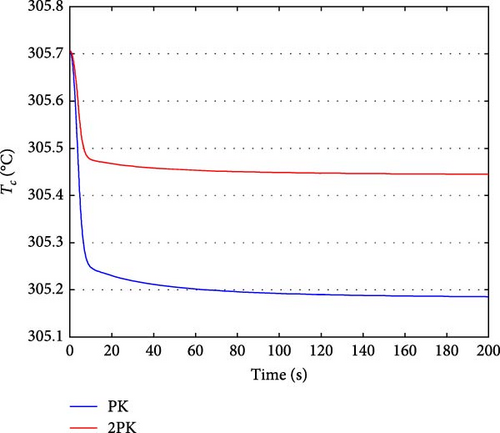
Figure 2 illustrates the changes in the relative density of the precursor groups in the PK and 2PK models after CRDA. Figure 3 shows the changes in total reactivity in the PK and 2PK models after CRDA. Effective control of the total reactivity is maintained, ensuring that it remains exactly zero and remains stable. Figure 4 illustrates the changes in xenon concentration in the PK and 2PK models after CRDA. Figure 5 shows the fuel temperature changes in PK and 2PK models after CRDA. Figure 6 shows the coolant temperature changes in PK and 2PK models after CRDA. Both models show a clear tendency towards the stability of temperature variations.
4. Conclusion
This study successfully demonstrates that fast-moving transient events, like the CRDA in a VVER-1000 reactor, may be simulated using the PK model. The model’s accuracy, as demonstrated by comparison with the FSAR, emphasizes its potential as a reliable tool for safety assessments. While the 2PK model gives a more detailed representation of core dynamics, the PK model provides a simpler and computationally efficient approach suitable for studying fast-paced transients. The information acquired from this study can help develop advanced reactor control systems and enhance the overall safety of nuclear power facilities.
The current study did not investigate the effects of structural uncertainties (e.g., variations in physical parameters and material heterogeneities) or the detailed mechanical dynamics of the control rod drop process (including guide tube friction, coolant flow resistance, and gravitational acceleration). Future research could address these limitations by integrating advanced uncertainty quantification methods (such as probabilistic sensitivity analysis [10, 17]) and coupled mechanical-hydraulic modeling [9, 11]. These approaches would enhance prediction accuracy under diverse operational conditions and enable a more comprehensive assessment of reactor safety and control system optimization.
Nomenclature
-
- cr:
-
- Precursor density relative to initial equilibrium density
-
- D:
-
- Diffusion coefficient
-
- d:
-
- Axial distance between the two halves of the core
-
- ff:
-
- Fraction of reactor power deposited in the fuel
-
- G:
-
- Useful thermal energy liberated per fission of 235U
-
- Gr:
-
- Control rod total reactivity
-
- ΔH:
-
- Axial height of each core half
-
- I:
-
- Iodine concentration
-
- l:
-
- Neutron generation time
-
- M:
-
- Mass flow rate time heat capacity of water
-
- P0:
-
- Full core power
-
- Pr:
-
- Core power relative to initial equilibrium power
-
- Tc:
-
- Coolant average temperature (Tc = (Te + Tl)/2)
-
- Tc0:
-
- Coolant average temperature at the initial condition
-
- Te:
-
- Coolant inlet temperature
-
- Tf:
-
- Fuel average temperature
-
- Tf0:
-
- Fuel average temperature at the initial condition
-
- Tl:
-
- Coolant outlet temperature
-
- V:
-
- Core volume
-
- v:
-
- Thermal neutron speed
-
- X:
-
- Xenon concentration
-
- δK/K:
-
- Relative change in the effective multiplication factor
-
- wxx:
-
- Coupling coefficient of half-x to itself
-
- wxy:
-
- Coupling coefficient between half-x and half-y
Greek Symbols
-
- αc:
-
- Coolant temperature coefficient
-
- αf:
-
- Fuel temperature coefficient
-
- αX:
-
- Xenon coefficient (αX = σX/Σf)
-
- β:
-
- Effective delayed neutron fraction,
-
- βi:
-
- ith Group effective delayed neutron fraction
-
- γI:
-
- Iodine yield per fission
-
- γX:
-
- Xenon yield per fission
-
- λI:
-
- Iodine decay constant
-
- λi:
-
- ith Delayed neutron group decay constant
-
- λX:
-
- Xenon decay constant
-
- μc:
-
- Coolant total heat capacity
-
- μf:
-
- Fuel total heat capacity
-
- ρ:
-
- Total reactivity
-
- δρr:
-
- Control rod reactivity
-
- Σf:
-
- Macroscopic thermal neutron fission cross-section
-
- σX:
-
- Microscopic thermal neutron absorption cross-section of xenon
-
- Φ = P0Pr/GΣfV:
-
- Neutron flux
-
- Ω:
-
- Coefficient of heat transfer between fuel and coolant.
Conflicts of Interest
The authors declare no conflicts of interest.
Funding
No funding was received for this manuscript.
Open Research
Data Availability Statement
All data regarding this study are included in the manuscript.


