Synergistic Effects of F Doping and CNT Incorporation in ZnMn2O4 Cathode Materials to Achieve High-Performance Aqueous Zinc-Ion Batteries
Abstract
Mn-based materials are promising cathode candidates for aqueous Zn-ion batteries (AZIBs) because of their high-voltage platforms, environmental friendliness, and nontoxicity. However, their practical applications are limited by the rapid capacity decay caused by their slow electrochemical reaction kinetics and intrinsically poor conductivity. In this study, F-doped ZnMn2O4 (ZMO) (F-ZMO) microspheres incorporated with carbon nanotubes (CNTs) were synthesized and investigated to overcome these limitations. F-doping induced structural modifications by generating oxygen defects, which improved the ion diffusion and electronic conductivity. In addition, it improved the structure stability owing to the formation of strong metal-F bonds. These doping effects led to enhanced rate performance and cycle stability. Furthermore, the incorporation of CNTs complemented the insufficient electrical conductivity of the cathode material. The resulting F-ZMO/carbon nanotube (CNT) composites exhibited superior charge–transfer kinetics. Consequently, they achieved an enhanced discharge capacity of 122.2 mAh g−1 at a high current density of 2.0 A g−1, demonstrating significantly improved performance compared to those of ZMO and ZMO/CNT. These findings highlight the synergistic effect of F-doping and CNT incorporation in enhancing the electrochemical properties of ZMO cathodes and provide critical insights into the development of high-performance cathode materials for AZIBs.
1. Introduction
In recent years, aqueous Zn-ion batteries (AZIBs) have garnered significant attention attributed to their numerous advantages, including high capacity (820 mAh g−1), low redox potential (−0.76 V versus standard hydrogen electrode), abundant availability, safety, and cost-effectiveness of Zn [1]. Despite their promising potential, AZIBs face numerous challenges, particularly concerning the development of suitable cathode materials, which are capable of maintaining structural stability during prolonged cycling [2]. In addition, the high valence state and strong solvation effect of Zn-ions hinder efficient Zn-ion (de)intercalation, further complicating the search for an effective intercalation host for AZIBs [3]. However, because the cathode material is the primary factors limiting battery performance [4], significant research efforts have been dedicated to exploring and designing efficient cathode materials for AZIBs.
Cathode materials for AZIBs are broadly categorized into Mn-based oxides [5–7], vanadium-based oxides [8–10], Prussian blue analogs [11–13], and organic compounds [14–16]. Mn-based oxides are widely used because of their well-established synthesis processes, abundant resources, low toxicity, significant theoretical capacity, and high operating voltage [17]. Moreover, they have garnered significant scholarly interest owing to the abundance of Mn in its valence state. Therefore, various Mn oxides, including MnO [18], MnO2 [19, 20], Mn2O3 [21, 22], and Mn3O4 [23, 24], have been extensively studied as cathode materials for AZIB. Among these, ZnMn2O4 (ZMO), which has a spinel structure, has emerged as a promising cathode material for AZIBs because it can effectively provide Zn ions owing to the unique diatomic synergistic effect of its bimetallic oxide, which is similar to that of LiMn2O4 [25–28]. However, ZMO faces significant challenges, including large volume changes during ion insertion/extraction, slow electrochemical reaction kinetics, and the inherently low electrical conductivities of transition metal oxides, resulting in the deterioration of its cycle stability and rate performance [29–31]. To address the issues associated with ZMO materials, several researchers have focused on defect engineering, such as introducing oxygen or cation vacancies, as an effective strategy. This method significantly improves the electrochemical performance by adjusting the local electronic structure of the material. In particular, the introduction of oxygen vacancies is effective in enhancing the electronic conductivity and Zn-ion diffusion kinetics [32, 33]. Doping is well known as a facile strategy for forming oxygen vacancies. In particular, fluorine ion doping in metal oxides has been reported to increase the oxygen vacancy concentration because it weakens the surrounding metal–oxygen bonds and easily releases oxygen [34]. Not only defect engineering, but also, the incorporation of carbon-based materials, particularly one-dimensional carbon nanotubes (CNTs), is widely used to improve the electrochemical performance in the field of energy storage, because CNTs have a distinctive structure, high surface area, exceptional electrical conductivity, and good stability [35–37]. Thus, the incorporation of CNTs into manganese-based compounds is an effective means of overcoming the intrinsic low electrical conductivity.
In this study, F-doped ZMO (F-ZMO) microspheres were synthesized for the first time by ultrasonic spray pyrolysis (USP) to develop high-performance cathode materials with enhanced reaction kinetics and improved structural stability. F-ZMO cathodes were prepared at different doping concentrations, structurally characterized, and electrochemically evaluated to determine the optimal doping amount of F ions in the ZMO. The experimental results demonstrated that an optimal F doping concentration facilitates ion diffusion and electron transfer and strengthens the structure, leading to improved rate capability and cycle stability. In addition, CNTs-incorporated F-ZMO (F-ZMO/CNTs) was synthesized to enhance the electrical conductivity of this system. The experimental results demonstrated that F-ZMO/CNTs exhibit synergistic effects that improve the performance of ZMO cathode materials.
2. Experimental Section
2.1. Material Synthesis
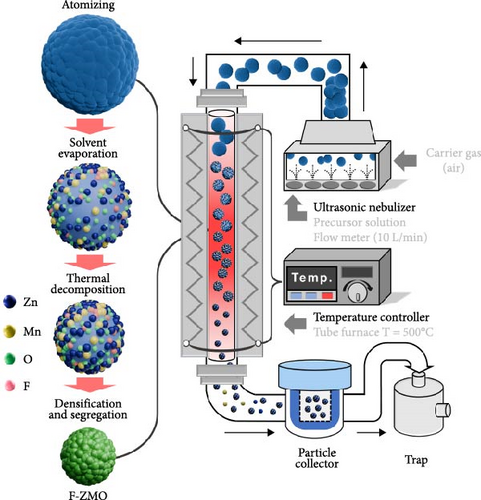
ZnMn2O4-xFx (x = 0, 0.1, 0.2, and 0.3) samples were synthesized by the USP method (Scheme 1) and are hereafter referred to as ZMO, 0.1 F-ZMO, 0.2 F-ZMO, and 0.3 F-ZMO, respectively. Initially, 0.5 M precursor solutions were prepared by dissolving zinc nitrate hexahydrate (Zn [NO3]2 · 6H2O, SIGMA, 98%), manganese nitrate solution (Mn[NO3]2, DAEJUNG, 50%), and ammonium fluoride (NH4F, DAEJUNG, 97%) in distilled water. The precursor solution was nebulized into droplets using an ultrasonic nebulizer. The generated droplets were carried by air at a fixed rate of 10 L min−1 into a quartz reactor maintained at 500°C. As the droplets passed through the quartz reactor, they underwent solvent evaporation, thermal decomposition, densification, and segregation reactions, resulting in the formation of particles. These particles were transported by carrier gas (air) flow to a bag filter. The particles collected by the bag filter were further crystallized by calcination in a furnace at 500°C for 3 h. The F-ZMO/carbon nanotube (CNT) and ZMO/CNT samples were synthesized using the method described earlier, except for the addition of acid-treated CNTs (Super CNT A-1500M, SEOHYUN) to the precursor solution at a concentration of 5 wt%. The acid-treated CNTs were prepared using a HNO3/H2SO4 (1:3, v/v) solution at 70°C and washed five times using distilled water [38–41].
2.2. Material Characterization
The phases of the as-synthesized samples were analyzed using powder X-ray diffraction (XRD; MiniFlex, Rigaku) with Cu-Kα radiation (λ = 0.154056 nm) in the 2θ range with a step size of 0.02° at an acceleration voltage of 40 kV. The morphologies and structures of the samples were investigated using a field-emission scanning electron microscope (FE-SEM; SU8000, Hitachi) equipped with an energy-dispersive X-ray (EDX; Pathfinder) detector. The chemical composition and valence state of each element in the composite were determined by X-ray photoelectron spectroscopy (XPS; K-Alpha, Thermo Scientific). Oxygen vacancy in the prepared samples were characterized by electron paramagnetic resonance (EPR; EMXplus, Bruker) testing at microwave frequency of 9.423 GHz and room temperature. The CNT content in the prepared samples was measured by conducting thermal gravimetric analysis (TGA; Q500, TA Instruments) at a rate of 10°C min−1 from room temperature to 750°C in air.
2.3. Electrochemical Measurements
The electrochemical measurements were performed using CR-2032 type coin cells. The positive electrodes were prepared by coating a slurry paste onto a stainless steel foil (99.9%, Goodfellow) using the doctor blade. The slurry consisted of the active material (ZMO, F-ZMO, or F-ZMO/CNTs), conductive material (carbon black), and binder (polyvinylidene fluoride, PVDF) in a weight ratio of 7:2:1. The coated electrodes were then dried in an oven at 130°C for 24 h and subsequently, pressed and punched to obtain disc-type electrodes with a diameter of 10 mm and active material contents in the range of 1.2–1.5 mg cm−2. The cells were assembled in air using a metallic Zn metal disc as the anode, 2 M ZnSO4 and 0.1 M MnSO4 as the electrolytes, and glass fiber filter paper (GF/A, Whatman) as the separator. Cyclic voltammetry (CV) was performed within the voltage range of 0.8–1.8 V and electrochemical impedance spectroscopy (EIS) was conducted in the frequency range of 10−2–105 Hz at an amplitude of 5 mV on an electrochemical workstation (SP-240, Bio-Logic Science Instruments). The galvanostatic charge/discharge tests were performed using a battery test system (WBCS 3000, Neo Science) within the potential window range of 0.8–1.8 V (vs., Zn2+/Zn) at varying current densities.
3. Results and Discussion
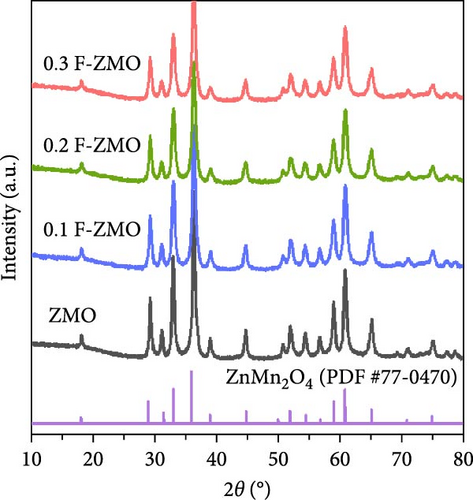
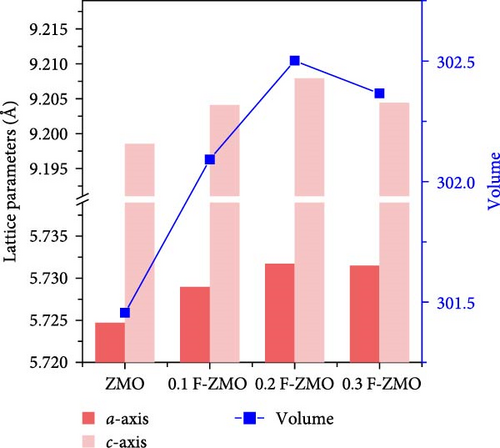
The crystal structures of the undoped ZMO and F-ZMO samples were analyzed by XRD, as illustrated in Figure 1a. The XRD pattern of the undoped ZMO synthesized by the USP method is closely aligned with the standard diffraction pattern of ZMO (PDF #77-0470), confirming the successful synthesis of the ZMO sample. The F-ZMO samples also exhibit a structure similar to that of the pure ZMO with no additional impurity peaks, indicating that F-doping was successfully achieved in the ZMO samples. We measured the lattice parameters and unit cell volume, as presented in Figure 1b, and observed that the a- and c-axis lattice parameters, and unit cell volume of the ZMO increased with increasing F-doping concentrations. F-doping into the oxygen sites of transition metal oxide materials is well known to results in a partial reduction of the transition metal adjacent to the doping sites because of charge compensation, which leads to an increase in the ionic radius of the transition metal, resulting in increases in the lattice parameters and unit cell volume [42–44]. It is expected that this enlarged unit cell volume facilitated Zn2+ diffusion. However, for 0.3 F-ZMO, the lattice parameter and unit cell volume were decreased compared to those of 0.2 F-ZMO. This decrease was attributed to the smaller size of F- (1.33 Å) compared to that of O2− (1.40 Å) overriding the effect of the reduction of the adjacent transition metal ion when the F-doping was excessive [45, 46].
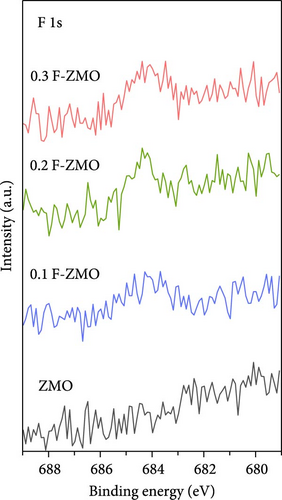
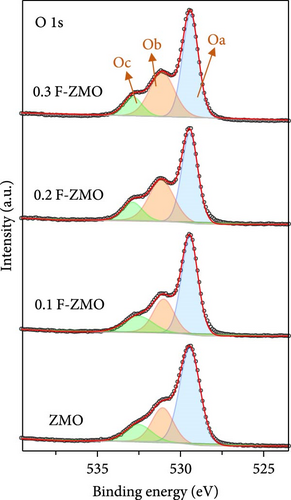
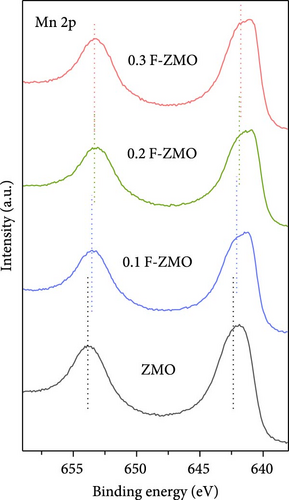
The chemical compositions and electronic states of the ZMO and F-ZMO samples were investigated by XPS analysis to analyze the effects of F-doping in detail. Figure 2a illustrates the high-resolution F 1s spectra of all samples. A peak corresponding to F at 684 eV is evident only in the F-ZMO samples, distinguishing them from the pure ZMO sample [47]. In addition, Figure 2b presents the high-resolution O 1s spectra of all samples, which are deconvoluted into three characteristic peaks centered at 529.4, 531.2, and 532.5 eV, corresponding to the lattice oxygen (denoted as Oa), surface adsorbed oxygen (O─C)/defective oxygen (denoted as Ob), and hydroxyl oxygen (O─H) in water molecule (denoted as Oc), respectively [48, 49]. With an increase in the F-doping concentration, pronounced defective oxygen peaks are observed, indicating an increase in the number of oxygen vacancies. When F was doped into oxygen sites, the higher electronegativity of F- (4.00) compared to that of O2− (3.44) reduced the electron density around the surrounding metal ions, weakening the metal–oxygen bond. This reaction promoted the release of oxygen ions, leading to the formation of additional oxygen vacancies [34]. Figure 2c illustrates the high-resolution Mn 2p spectra of all the samples. As the F-doping concentration increases, the Mn peaks shift negatively, indicating the reduced presence of oxygen around the Mn atoms [37]. The high-resolution XPS spectra confirm successful F-doping in the F-ZMO samples and the effective generation of oxygen vacancies. However, the O 1s and Mn 2p spectra show significant changes up to 0.2 F-ZMO, with no significant changes observed for 0.3 F-ZMO. This finding indicates that F is no longer effectively doped above a specific concentration, which is consistent with the XRD and lattice parameter results.
To investigate the prepared samples further, FE-SEM analysis was conducted, and the results are illustrated in Figure 3. All samples exhibit approximately 1 µm spherical secondary particles, which are densely packed with approximately 50 nm primary particles (Figure 3a–d). No discernible differences in morphology are observed among the samples, as illustrated in the FE-SEM images, indicating that the F doping did not affect the morphology. In addition, Figure 3e. presents the SEM elemental mapping images of the F-ZMO samples. The Zn, Mn, O, and F ions are uniformly distributed within the particles, suggesting successful and uniform F-doping into the ZMO structure.

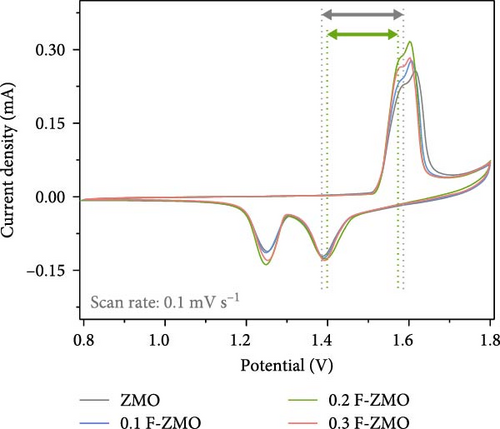
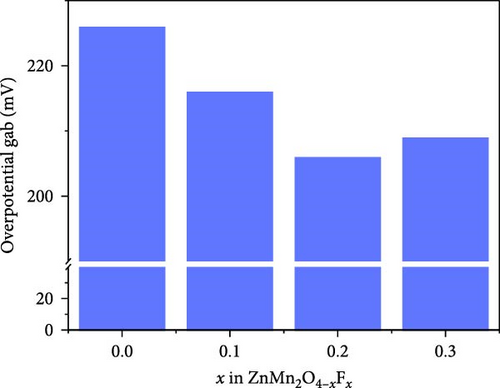
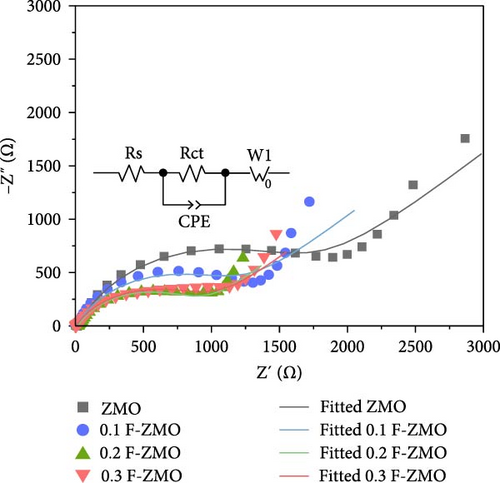
To investigate the effect of F-doping on the electrochemical performance of ZMO, undoped ZMO and F-ZMO samples were incorporated into coin cells and evaluated. Initially, the intercalation and extraction properties of Zn2+ were studied using CV tests in the potential range of 0.8–1.8 V (vs., Zn/Zn2+) at a scan rate of 0.1 mV s−1, as illustrated in Figure 4a. In Figure 4a, two coupled redox peaks are observed at similar locations in the CV curves of all samples. In cathodic scans, two reduction peaks appear at approximately 1.24 and 1.38 V, which correspond to the intercalation of H+ and Zn2+. Similarly, in anodic scans, a peak appears at approximately 1.57 and 1.61 V, which is ascribed to the extraction of H+ and Zn2+ [2, 35, 42]. These results indicate that all samples exhibit similar Zn2+ intercalation and extraction behaviors. In contrast, the peak current densities of the F-ZMO samples are higher than those of the undoped ZMO. In addition, the F-ZMO samples exhibit a smaller overpotential gap between the oxidation and reduction peaks of the CV curve compared to undoped ZMO, as illustrated in Figure 4a,b. The CV results suggest that oxygen vacancies derived from F-doping generate more active sites and improved the reaction kinetics by reducing the energy barrier for Zn2+ transport [50, 51]. To understand the electrochemical characteristics of the F-ZMO sample further, EIS spectra were recorded (Figure 4c). The Nyquist plot forms the semicircle in the high-frequency region and a straight line at low-frequency region, corresponding to the charge–transfer resistance (Rct) and Warburg resistance, respectively. The EIS spectra reveal that the Rct values of the F-ZMO samples are smaller than that of the undoped ZMO, indicating that the oxygen vacancies derived from F-doping enhance charge transfer by improving the electron conductivity [52]. In addition, the spectra of the F-ZMO samples show straight lines with steeper slope in the low-frequency region compared to that of undoped ZMO, which indicates faster ion diffusion, reflecting improved ion transport properties [53–55]. This improvement is attributed to the expansion of the unit cell volume caused by F-doping, which facilitates more efficient ion diffusion.
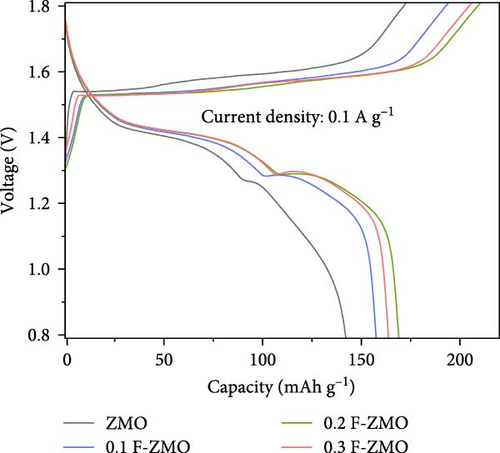
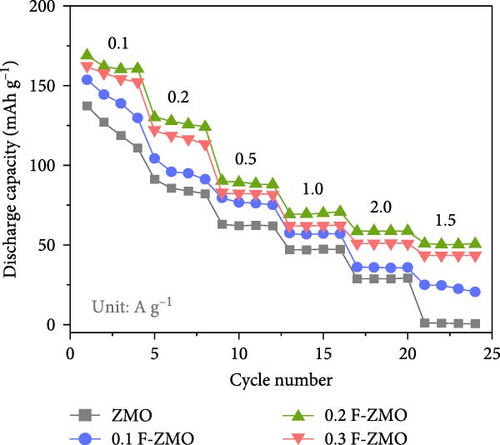
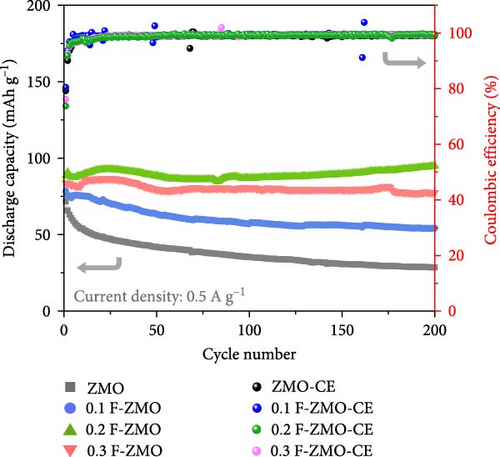
The charge/discharge curves of all the samples at 0.1 A g−1 are presented in Figure 4d, which exhibit distinct sloping voltage platforms that correspond to the redox peaks in the CV curves. The F-ZMO samples display more stable and longer platforms than the undoped ZMO, indicating that F-doping reduces the overpotential and improves the capacity. All samples show low coulombic efficiencies, which are attributed to poor stability with high electrostatic repulsion and the large polarization caused by Zn2+ in the initial insertion/extraction [34, 56–58]. In addition, the rate performance of the prepared samples was evaluated at varying current densities from 0.1 to 2.0 A g−1, as illustrated in Figure 4e. The F-ZMO samples exhibit higher capacities and excellent rate capabilities across all current densities. In particular, the F-ZMO samples maintain a discharge capacity at a high current density of 2.0 A g−1, whereas the undoped ZMO samples experience limited operation. The enhanced electrochemical performance of the F-ZMO samples is attributed to the enhanced reaction kinetics and increased ionic and electronic conductivities owing to the F-doping, as confirmed by the CV and EIS results. Although the F-ZMO samples exhibit enhanced electrochemical performance compared to the undoped ZMO, significant differences are observed in the doping effects based on the F-doping concentration. The electrochemical performance gradually increases with increasing F-doping concentration up to 0.2 mol and then decreases beyond this level, consistent with the tendencies of the physical characteristics of this system, as confirmed by the XRD and XPS results. The above physical and electrochemical characterizations demonstrate that the optimal F-doping concentration for obtaining effective ZMO cathode material is 0.2 mol. To verify the effect of F-doping on the long-term cyclic stability, repeated charge/discharge tests were conducted at a current density of 0.5 A g−1, as illustrated in Figure 4f. After 200 cycles, the F-ZMO samples exhibit significantly superior performances compared to that of the undoped sample. Among these, 0.2 F-ZMO exhibits a high specific capacity of 95.0 mAh g−1, with a capacity retention rate of 89.4%. In contrast, ZMO exhibits a capacity of 28.5 mAh g−1 with a capacity retention rate of 39.8%, demonstrating poor capacity and cycling stability compared to the F-ZMO samples. The superior cyclic performance of F-ZMO was attributed to the strengthened structural stability provided by the stable metal-F bonds, which was attributed to the fact that F possesses a higher electron affinity than oxygen [59].
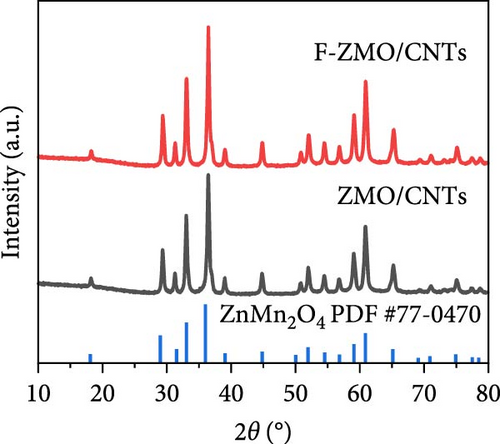
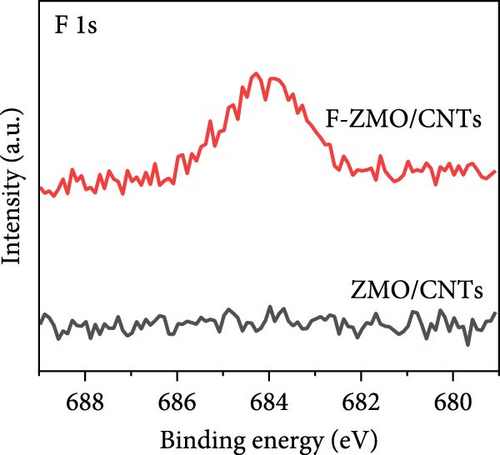
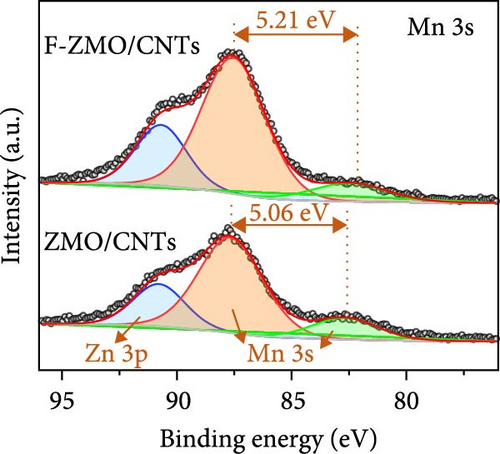
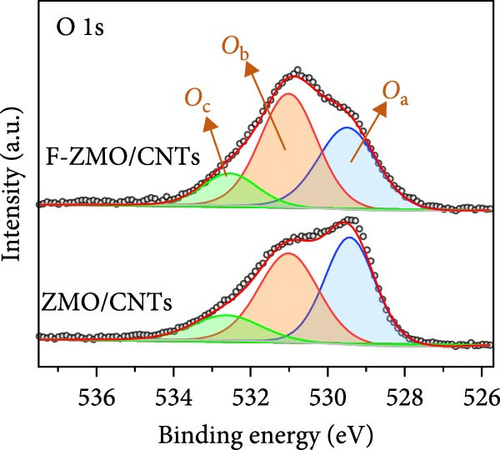
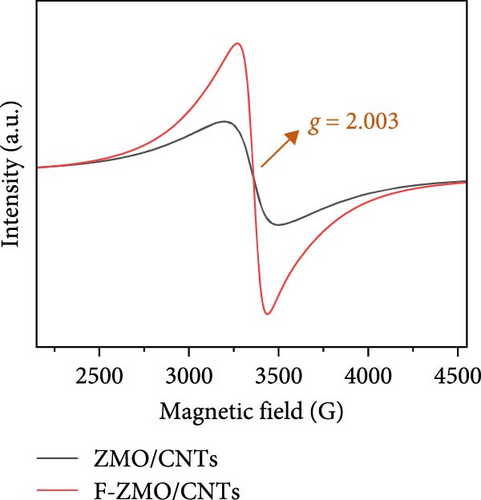
To address the intrinsically poor electrical conductivity of ZMO and improve the electrochemical performance of the optimized 0.2 F-ZMO further, we synthesized ZMO/CNTs and F-ZMO/CNTs via the USP method. The crystal structures and chemical composition of the prepared samples were analyzed through XRD and XPS; the results are illustrated in Figure 5. As shown in Figure 5a, ZMO/CNTs and F-ZMO/CNTs possess structures similar to those of pure ZMO and F-ZMO (Figure 1a). Moreover, the corresponding XRD patterns do not include any additional impurity peaks, indicating that the incorporation of CNTs did not affect the crystal structure. Additionally, as shown in Figure 5b,c, the high-resolution F 1s and Mn 2 p XPS spectra of ZMO/CNTs and F-ZMO/CNTs exhibit similarities with those of pure ZMO and F-ZMO (Figure 2a–c), respectively. These results confirm successful F-doping and a decrease in average alence state of Mn in F-ZMO/CNTs. Figure 5d exhibit the high-resolution Mn 3s XPS spectra of both samples and shows the binding energy difference between the main peak and its satellite originated from splitting in Mn 3s orbital [35, 43]. The binding energy difference of F-ZMO/CNTs was larger than that of ZMO/CNTs, which indicates that the average valence state of Mn of F-ZMO/CNTS is lower than that of ZMO/CNTs. It is consistent with the results of the Mn 2p spectra. In contrast, the high-resolution O 1s spectra of ZMO/CNTs and F-ZMO/CNTs differ from those of pure ZMO and F-ZMO, respectively. As shown in Figure 5e, the Ob content of ZMO/CNTs was higher than that of pure ZMO (Figure 2b), which is attributed to increase in the content of C─O bond due to the incorporation of mildly oxidized CNTs [60, 61]. The Ob content of F-ZMO/CNTs was higher than that of ZMO/CNTs. This is attributed to the formation of additional oxygen vacancies due to F doping. These results are similar to those observed for pure ZMO and F-ZMO. In addition, EPR test was conducted to further characterize the presence of oxygen vacancies as shown in Figure 5f. The EPR spectra of both samples exhibit a signal in the range of g of 2.003, which is indexed to the typical signal of unpaired electrons in the sites of oxygen vacancy [35, 42, 50]. As can be seen in Figure 5f, the peak intensity of the F-ZMO/CNTs is higher than that of ZMO/CNTs, suggesting a high concentration of oxygen vacancies. It is consistent with the results of the O 1s XPS spectra.

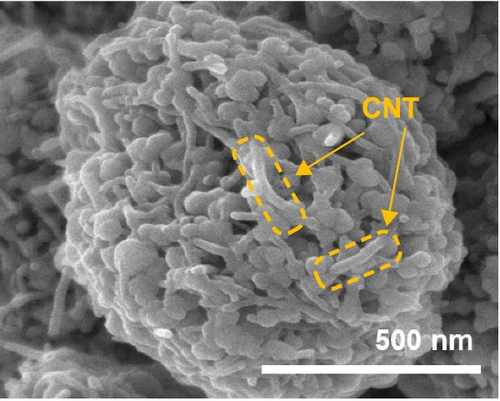
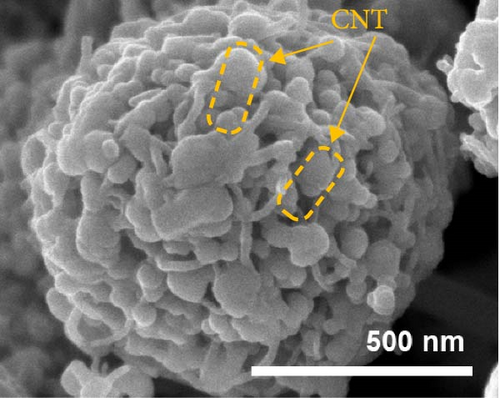
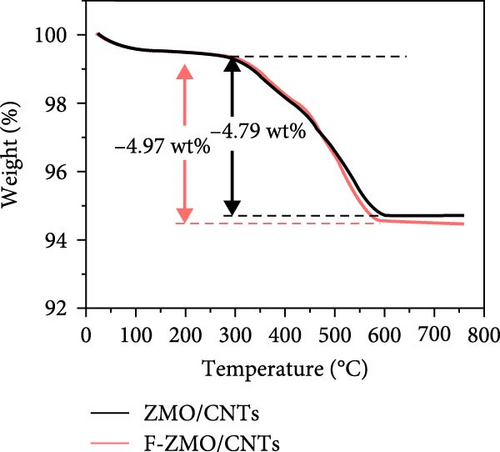
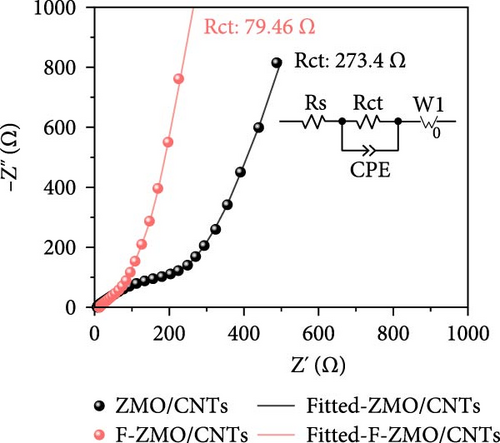
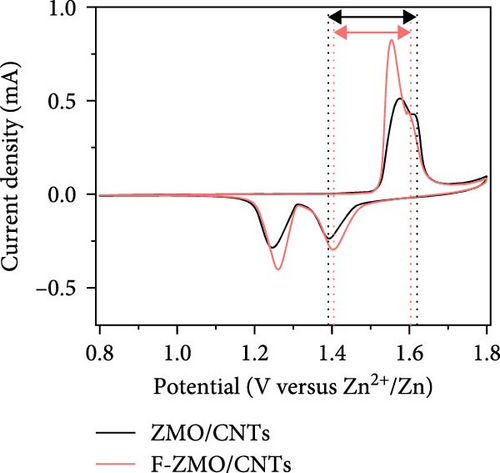
To investigate the prepared samples further, FE-SEM analysis was conducted. As illustrated in Figure 6a and (b), the CNTs are evenly distributed between the primary particles, indicating the formation of efficient electrically conductive pathways. The CNT contents of the ZMO/CNTs and F-ZMO/CNTs are 4.79 and 4.97wt%, respectively (Figure 6c). In Figure 6d, the CNT-incorporated samples exhibit an Rct lower than those of the prepared samples without CNTs (Figure 4c), indicating that CNT implantation is an effective approach for decreasing the Rct of the ZMO cathode material. In particular, the F-ZMO/CNTs (79.5 Ω) exhibit remarkably decreased Rct values compared with those of the ZMO/CNTs (273.4 Ω), F-ZMO (822 Ω), and ZMO (1407 Ω). In addition, the incorporation of CNTs contributes to the superior capacitance and enhanced reaction kinetics of the prepared samples, as illustrated in the CV test results (Figure 6e). Compared with ZMO and F-ZMO as well as the ZMO/CNTs, the F-ZMO/CNTs exhibit remarkable enhancements in the capacitance and reaction kinetics, suggesting that the enhanced electrochemical performance of the F-ZMO/CNTs was attributed to the synergistic effect of F-doping and CNT implantation. To understand the reaction kinetics of the F-ZMO/CNTs samples further, CV tests were conducted at various scan rates, and the diffusion coefficients of the Zn ions were calculated.
As illustrated in Figure 7a,b, the CV curve profiles of the F-ZMO/CNTs remain consistent with increasing scan rate, whereas the CV curve profiles of the ZMO/CNTs gradually widen and shift significantly. This finding indicates that the F-ZMO/CNTs possess a faster electrochemical response. Furthermore, the cathodic/anodic peak current (Ip) has a linear relationship with the square root of the scan rate (v), as illustrated in Figure 7c,d, which proves the dynamic behavior of diffusion control. The diffusion coefficient of Zn2+ (DZn2+) is given by the Randles–Sevcik equation [31]:
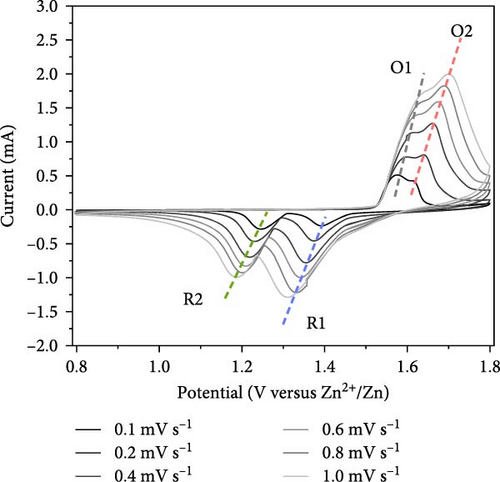
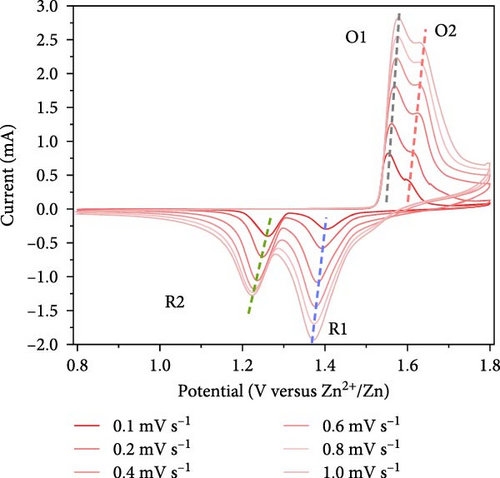
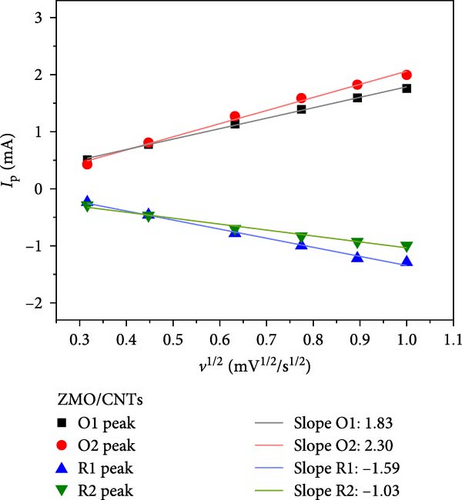
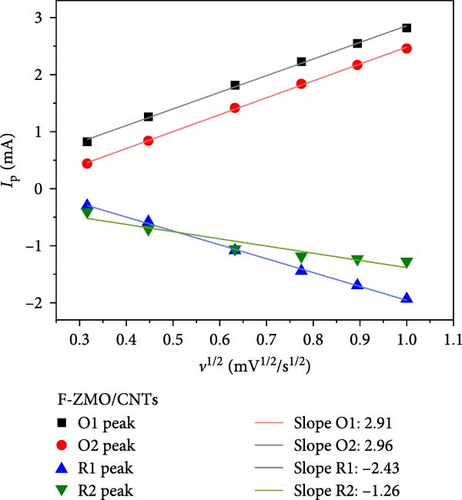
In Equation (1), Ip is the peak current (mA), n is the number of transferred electrons, A is the contact area between the electrolyte and active material (0.785 cm2), the obtained C is the volume concentration of Zn2+ in the electrode (5.52 × 10⁻³ mol cm−3), and ν is the scan rate (V s−1). The values obtained from the oxidation and reduction peaks were used for further calculations, and Table 1 lists the resulting DZn2+ values for the F-ZMO/CNTs and ZMO/CNTs. A comparison reveals that the DZn2+ values for the F-ZMO/CNTs are consistently higher than those for the ZMO/CNTs, indicating that Zn2+ diffuses more rapidly in the F-ZMO/CNTs than in the ZMO/CNTs. These results clearly demonstrate that the F-ZMO/CNTs significantly enhanced the diffusion kinetics of Zn2+.
| Samples | ZMO/CNTs, DZn2+ (cm2 s−1) |
F-ZMO/CNTs, DZn2+ (cm2 s−1) |
|---|---|---|
| O1 | 3.08 × 10⁻⁷ | 7.79 × 10⁻⁷ |
| O2 | 4.87 × 10⁻⁷ | 8.06 × 10⁻⁷ |
| R1 | 2.33 × 10⁻⁷ | 5.43 × 10⁻⁷ |
| R2 | 9.76 × 10⁻⁸ | 1.46 × 10⁻⁷ |
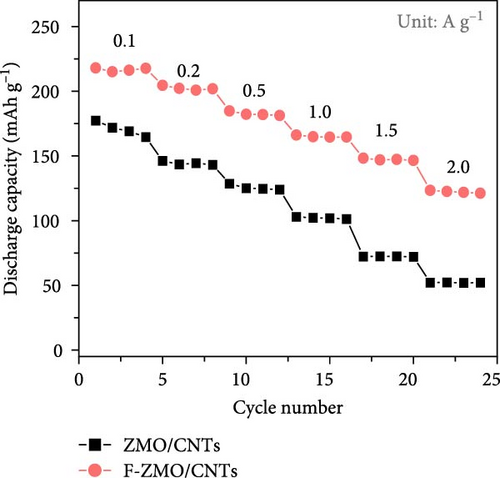
To verify the improved electrochemical performance of the F-ZMO/CNTs, the rate performance was evaluated. As illustrated in Figure 8a, the F-ZMO/CNTs electrode achieve discharge capacities of 216.8, 202.4, 182.6, 165.0, 147.3, and 122.3 mAh g−1 at current densities of 0.1, 0.2, 0.5, 1.0, 1.5, and 2.0 A g−1, respectively. In contrast, the ZMO/CNTs electrode exhibits lower discharge capacities of 170.7, 144.3, 125.6, 102.1, 72.3, and 52.1 mAh g−1 at the same current densities. This finding demonstrates the superior rate performance of the F-ZMO/CNTs compared with that of the ZMO/CNTs.
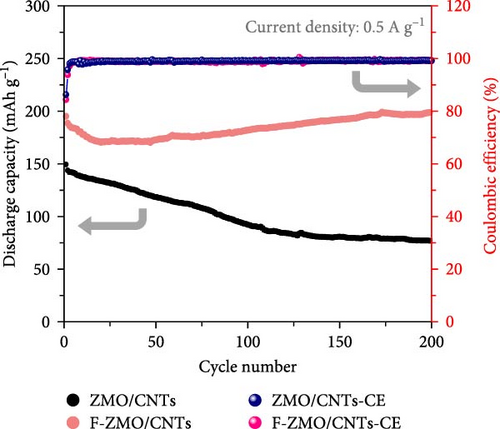
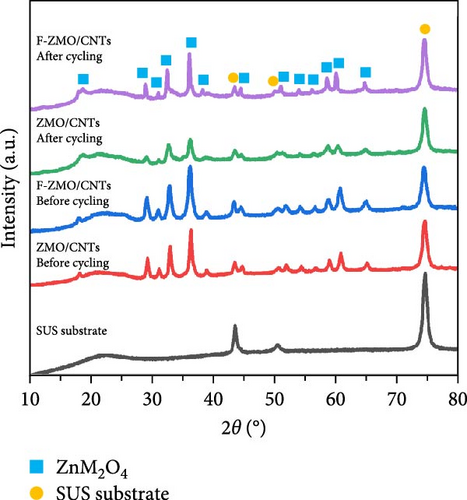
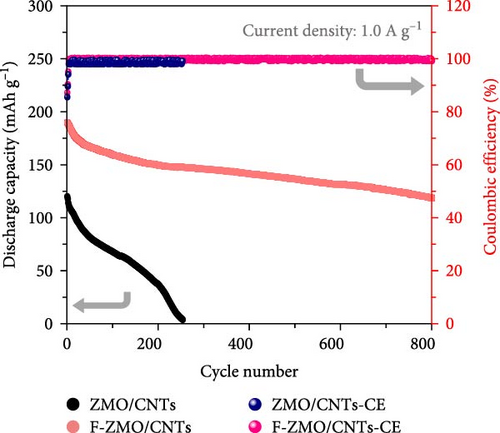
Finally, the cycling performance of the F-ZMO/CNTs and ZMO/CNTs was evaluated by repeating charge/discharge tests at 0.5 A g−1. As illustrated in Figure 8b, the specific capacity of the F-ZMO/CNTs is stably maintained during cycling and exhibits high value of up to 198.8 mAh g−1 after 200 cycles. In contrast, the ZMO/CNTs exhibits a specific capacity of 76.9 mAh g−1, with a gradual decrease in the specific capacity compared to that in the initial stage. To confirm the structural stability, the disassembled electrode after cycling test was analyzed by XRD, as shown in Figure 8c. The initial crystal structure of F-ZMO/CNTs is fairly well maintained, whereas the ZMO/CNTs shows considerable changes after cycling. A long-term cycling test was also, conducted at current density of 1.0 A g−1, as shown in Figure 8d. The F-ZMO/CNTs maintains a high specific capacity even after 800 cycles, exhibiting excellent cycling stability with the CE remaining close to 100% throughout the cycling test. In contrast, the ZMO/CNTs shows rapid capacity fading before reaching 300 cycles. The introduction of F and CNTs improves the ionic and electronic conductivity, and stabilizes the electrode structure, enabling superior capacity retention and long-term cycling stability. Furthermore, F-ZMO/CNTs were sufficiently competitive with ZMO-based cathode materials reported in previous studies, as shown in Table 2. Therefore, F-ZMO/CNTs is promising candidate for high-performance aqueous ZIBs.
| Cathode materials | Current density (A g−1) |
Discharge capacity of final cycle in cycling test (mAh g−1) | Cycle number | Ref. |
|---|---|---|---|---|
| F-ZMO/CNTs | 0.5 | 198.8 | 200 | Our works |
| 1.0 | 118.7 | 800 | ||
| HM-ZnMn2O4@rGO | 1.0 | 72.4 | 650 | [30] |
| HP-ZnMn2O4 | 0.1 | 106 | 300 | [31] |
| ZnMn2O4/C | 0.5 | 80 | 500 | [62] |
| ZnMn2O4@PCPs | 1.0 | 125.6 | 2000 | [63] |
| ZnMn2O4 NDs/rGO | 1.0 | 113.7 | 400 | [64] |
| ZnMn2O4 nanoparticles | 0.2 | 189.5 | 500 | [65] |
| ZnMn2O4/CNTs | 1.0 | 136 | 600 | [66] |
4. Conclusions
This study demonstrated for the first time that F-doping and the incorporation of CNTs are effective approaches for solving the intrinsic problems associated with ZMO cathode materials. The F-ZMO/CNTs with optimized compositions exhibited remarkable potential for stable application in high-performance aqueous ZIBs. F-doping could induce oxygen vacancies, increase the unit cell volume, and form stable bonds with transition metals in the ZMO structure. These changes yielded outstanding performance, with enhanced ionic conductivity, charge transfer, and stability. In addition, the incorporation of CNTs improved the electrical conductivity of the composite material. Notably, F-doping with CNT incorporation produced superior performance compared to that expected from the additive contributions of F-doping and CNT incorporation individually, indicating that the CNT serve as accelerator, enhancing the effect of F-doping by maximizing its potential benefits. Consequently, the F-ZMO/CNTs maintained a capacity of 198.8 mAh g−1 after 200 cycles at a current density of 0.5 A g−1, which was notable enhancement compared with a capacity of 95.0 mAh g−1 observed for F-ZMO alone. These findings suggest that F-doping with incorporated CNTs can significantly improve the performance of ZMO cathode materials. This approach provides insight into the development of high-performance aqueous ZIBs, indicating the potential of this field for future research.
Conflicts of Interest
The authors declare no conflicts of interest.
Funding
This study was funded by the Ministry of Science and ICT, South Korea (Grant GTL24012-000) and Korea Institute of Industrial Technology through research project (Grant JC250029), and this work was also supported by Soonchunhyang University Fund.
Acknowledgments
This work was supported by the National Research Council of Science & Technology (NST) grant by the Korea Government (MSIT) (Grant GTL24012-000) and Korea Institute of Industrial Technology through research project (Grant JC250029), and this work was also supported by Soonchunhyang University Fund.
Open Research
Data Availability Statement
The data that support the findings of this study are available from the corresponding authors upon reasonable request.


