The Carbon Border Adjustment Mechanism as a Trade Shifter: GTAP Simulations of China–EU Trade Response
Abstract
Amid global climate challenges, the European Union’s (EU) Carbon Border Adjustment Mechanism (CBAM) raises concerns over trade competitiveness and carbon leakage. This study integrates input–output theory and a recursively dynamic GTAP model, utilizing the 2020 Environmental Extended Input–Output Table and GTAP 11 database, to quantify direct and indirect carbon emissions across CBAM-covered sectors. Innovatively incorporating dynamic updates and multidimensional scenarios (varying CBAM tax rates, Scope 1/2 emissions), we assess CBAM’s impacts on China–EU trade. The analysis reveals that CBAM has a negative impact on Chinese export commodity prices, export volumes, and trade conditions, with a higher tax rate leading to a more significant adverse effect on Chinese export trade. CBAM significantly reduces China’s export prices (−6.56 × 10⁻⁷% under a $424/ton tax) and volumes (−12.5% decline), while marginally improving EU export prices (up to 1.14 × 10⁻⁵%) but exacerbating global trade contraction (−50% for non-EU regions). Sectoral heterogeneity highlights vulnerabilities in energy-intensive industries. Findings underscore CBAM’s asymmetric trade effects, urging policy coordination to mitigate adverse global impacts.
1. Introduction
Global climate change has driven countries worldwide to urgently commit to peak carbon and carbon neutrality goals (i.e., the “dual carbon” targets). To achieve these goals, many countries have adopted carbon pricing policies to reduce greenhouse gas emissions. However, varying development stages have led to large disparities in carbon pricing standards across countries. These disparities contribute to “carbon leakage”—the relocation of high-emission industries to regions with looser regulations—which undermines global emission reduction efforts and exacerbates international competitive imbalances, especially for industries in Europe and other strictly regulated regions [1–3].
To address these challenges, the European Union (EU) launched the Carbon Border Adjustment Mechanism (CBAM) in October 2023. The mechanism aims to level the playing field by applying levies equal to the carbon price gap between the EU and third countries, thus preventing carbon leakage and protecting the competitiveness of EU industries [4]. However, as a unilateral policy, CBAM has raised concerns about possible trade disputes [5]. In particular, the integration of global value chains complicates the mechanisms through which international trade influences environmental outcomes [6].
Since establishing diplomatic relations in 1975, China and the EU have significantly strengthened their economic and trade relations. Nowadays, the two sides are each other’s second-largest trading partners, and the EU has become China’s top source of imports of consumer goods and a major export market for electromechanical products. In 2024, the total import and export of goods have reached a new peak of $785.8 billion, with an average of nearly $1.5 million in trade exchanges per minute.1 However, a significant carbon cost gap exists between the two sides: the EU imposes high carbon prices through its mature ETS, while China’s national carbon market is still in its early stages, exacerbating “carbon leakage.” The introduction of the CBAM will sharply raise export costs for China’s high-carbon goods to Europe, making it a new focal point in Sino-European trade relations.
Scholars have noted that the implementation of CBAM will significantly impact China [7, 8]. Early studies suggest that China’s exports to the EU—particularly in the steel and aluminum industries—will be disproportionately impacted by CBAM [9, 10]. Because China’s steel and aluminum sectors emit more carbon than those in the EU and are not fully covered by China’s carbon trading system, CBAM will raise the cost of exporting related products to the EU. Considering the expected future rise in carbon prices in the EU and the trend that other countries may adopt similar measures, the impact of the long-term expansion of CBAM needs to be fully assessed. Such changes not only test the ability of relevant industries to adjust their emission reduction strategies but also signal a profound shift in global trade rules under the pressure of environmental protection.
Building on the above analysis, this study innovatively integrates input–output theory and general equilibrium theory to construct a dynamic GTAP model. Using the 2020 Environmental Extended Input–Output Table and the GTAP 11 database to quantify the direct and indirect carbon emissions of the five major industries under CBAM. It also innovatively incorporates variations in the CBAM tax rate, industry-specific emissions, CBAM development trends, and international carbon pricing and trade strategies, constructing multidimensional scenarios to evaluate different policy impacts, and thoroughly evaluates the effects of CBAM tax rate changes on China–EU trade—covering export prices, trade volumes across regions and industries, and overall terms of trade (TOT). These findings offer theoretical support for China in formulating effective responses to CBAM and provide valuable insights for other developing countries confronting similar challenges.
The remaining structure of this paper is as follows: Section 2 reviews the literature. Section 3 is measurement of full carbon emission factors by sector. Section 4 is analysis of the impact of CBAM on international trade. Section 5 provides the conclusion. Section 6 is future prospects.
2. Literature Review
2.1. CBAM Mechanisms and Trade Disputes
CBAM refers to the imposition of a carbon price differential on imports from non-EU countries, aligning with the carbon price under the EU Emissions Trading System (ETS). The core principle is to impose carbon tariffs on imports, calculated based on the carbon price gap between the EU and the exporting country [11, 12]. The CBAM transition period runs from 2023 to 2025, with full implementation starting in 2026. During this period, six key sectors—steel, cement, aluminum, fertilizers, downstream aluminum products, and hydrogen—will fall under CBAM regulation. For electricity imports, default emission values will be used for calculation. Other sectors may adopt actual emissions data or default values for assessment [13]. The European Commission’s Simplification Omnibus and Clean Industrial Deal clearly indicate that the future development of CBAM will focus on “extension and reinforcement.” This strategy aims to boost the global competitiveness of EU industries by streamlining compliance, broadening scope, and tightening regulation, while fostering international climate policy coordination.
Since its introduction, the CBAM policy has sparked extensive scholarly debate regarding its impacts [14–16]. Due to the underdevelopment of carbon markets in the early stages, scholars argued that carbon tariffs were not the most effective instruments to curb carbon leakage [17, 18]. Given the complexity of carbon tariffs, Izard et al. [17] argued that such measures could neither shield domestic industries from competitive disadvantages nor motivate other countries to adopt climate policies. Meanwhile, the CBAM mechanism has raised significant concerns regarding trade law compliance. Scholars have noted that under the WTO’s nondiscrimination principle, border measures based on carbon emissions may result in unequal treatment between imported and domestic products. This differentiation, derived from carbon content, could potentially conflict with WTO rules regarding “like products” [19]. However, other scholars argue that with proper design, CBAM can be made compatible with international trade rules, thereby ensuring legal compliance [20].
2.2. CBAM Trading Impact
For developed countries, CBAM serves not only as a tool to address climate change but also as a catalyst for domestic industrial transformation and upgrading. Davis et al. [21] and Kitetu and Ko [22] argue that CBAM may trigger substantial industrial restructuring in developed economies and stress the importance of effective policy interventions to mitigate its adverse effects on specific sectors and countries. In contrast, CBAM tends to impose significant economic burdens on developing countries [23]. Sikdar [24] highlight that South Asian exporters, including India, may experience substantial trade and welfare losses due to CBAM enforcement [24, 25]. Similarly, countries like Pakistan face comparable challenges [26]. While CBAM aims to reduce climate damage from global carbon emissions, policymakers must also consider the socioeconomic risks that developing countries may encounter during the transition, especially from a social equity and development standpoint [27].
At the same time, the introduction of CBAM is expected to profoundly influence the EU’s external trade and reshape the broader international trade landscape. Policy changes have already prompted price adjustments and trade restructuring in exporting countries, with direct impacts on key EU trading partners such as China. Yue et al. [26] note that CBAM may reduce the price of Chinese exports in the EU market, thereby affecting overall trade structure and flows. Siy et al. [28] Zhu et al. [29] studies consistently show that CBAM not only negatively affects China’s social welfare but also adversely affects its exports. However, China can effectively mitigate these negative impacts and maintain its global competitiveness by promoting international cooperation and optimizing its export structure, including strengthening bilateral ties and diversifying export markets.
2.3. Application of the GTAP Model
The GTAP model is a comprehensive global economic framework encompassing multiple regions and sectors [30]. It is widely applied in analyzing global trade, economic development, and environmental policies. The model is particularly effective in simulating global economic interactions, international trade dynamics, and environmental policy impacts. By integrating multidimensional data across international industries, trade, and consumption, the GTAP provides comprehensive policy impact assessments, particularly well-suited for evaluating policies related to carbon emissions, tariffs, and subsidies [31–33]. GTAP 11 [34] features updated data in terms of both quality and coverage, offering more precise global economic information. These enhancements improve the model’s realism and accuracy, thereby strengthening its applicability for empirical policy analysis.
Recently, general equilibrium analysis using GTAP models has become a mainstream approach in policy evaluation. Meanwhile, at the same time, the CBAM mechanism has triggered extensive discussions on trade compliance issues. Gu et al. [35] employed the GTAP model to construct policy scenarios based on carbon targets and covered sectors, evaluating the economic impacts of the EU’s carbon tariff policy on the “BASIC” countries—China, India, Brazil, and South Africa. The results indicate that carbon tariffs have a negative impact on the economic development, welfare, trade levels, and output of energy-intensive industries in the taxed countries [35]. The study also identified significant regional and sectoral heterogeneity in CBAM’s impacts. However, in-depth analysis of these heterogeneous effects remains limited, highlighting the need for further research and refinement.
2.4. Review of Literature
Although existing research has made notable progress in examining CBAM mechanisms, trade disputes, and economic impacts, several limitations persist. For example, regional analyses mainly focus on South and Southeast Asia, while systematic assessments of China–EU trade relations remain insufficient. In addition, most studies rely on static GTAP models, and carbon emissions are typically calculated using the GTAP database or aggregated input–output tables, leading to limitations in data accuracy and estimation methods. This study focuses on China–EU trade and refines the modeling of Scope 1 and Scope 2 carbon emissions by integrating the recursively dynamic GTAP 11 database with the latest Chinese Environmentally Extended Input–Output (CEEIO) table [36, 37]. Unlike traditional static models, this study incorporates a recursively dynamic mechanism to update the model’s base year in accordance with CBAM’s implementation timeline. Using projected carbon pricing data, the study constructs CBAM tariff scenarios and further develops multidimensional extensions to assess the complex impacts of tariff changes on China–EU trade.
3. Measurement of Full Carbon Emission Factors by Sector
Data from the 2020 CEEIO database [36, 37]. To ensure consistency between the input–output classification and the industry carbon emission classification, the classification in CEEIO GHG total emission was adjusted to 32 industries, as shown in Appendix A Table A1. In the input–output model, the direct carbon emission coefficients represent the carbon emissions per unit of output. Since the EU CBAM levy carbon tariff distinguishes between Scope 1 and Scope 2 [38]. Scope 1 emissions are greenhouse gases that an organization emits from sources it owns or controls directly. The formula is as in Equation (1). Where indicates the total amount of carbon emissions in sector i, Xi is the total output of sector i. Scope 2 emissions are indirect emissions from the generation of purchased energy, such as electricity, steam, heat, or cooling. The formula is as in Equation (2). Where indicates the total carbon emissions of sector i in range 1 and range 2, Xi is the total output of sector i.
The coefficient matrix B of complete consumption can be calculated by Formula (3) [39]. Among them, I represents the unit matrix and A is the direct consumption coefficient matrix. Thus, the complete carbon emission coefficient WEj represents the total amount of carbon emissions directly and indirectly consumed when producing each unit of product in sector j, and the calculation formula is as shown in Equations (4 and 5). The complete carbon emission coefficient of each sector calculated is shown in Appendix A Table A2.
4. Analysis of the Impact of CBAM on International Trade
4.1. GTAP Model Configuration
The GTAP model is a global trade analysis tool developed based on neoclassical economic theory. It is a multicountry, multisector general equilibrium model. It is a powerful tool for analyzing cross-sectoral issues. This paper uses the 11th edition of the GTAP database, which covers trade data for 65 products and 160 regions. According to research needs, the model countries are divided into the EU, China, and other countries. Products are merged into 32 major sectors according to the industry classification standards of the input–output model.
4.2. CBAM Tax Rate
Among them, Ci is the carbon dioxide emissions from the export trade of sector i, T1 refers to the CBAM levy standard set according to the carbon price of the European carbon market, T2 is the domestic carbon price of the country subject to the tax. EXi is the export trade value of sector i, and Ti is the calculated CBAM rate.
4.3. Scenario Analysis and Result Analysis
4.3.1. Scenario Analysis for Changes in CBAM Tax Rates
To explore the impact of different CBAM tax rates on international trade, we have set up three distinct CBAM tax rate scenarios based on the 2024 EU carbon price and the EU’s forecasted carbon price, respectively. These scenarios are as follows: Scenario 1: The EU sets a CBAM tax rate of $70.6 per ton of carbon emissions2; Scenario 2: The EU sets a CBAM tax rate of $265 per ton of carbon emissions; Scenario 3: The EU sets a CBAM tax rate of $424 per ton of carbon emissions.3 The specific tax rates are shown in Table 1. For ease of analysis, we assume that all other countries use the average carbon price of China’s carbon market in 2024, which is $13.37.4
| CBAM levy scenarios | CBAM levy rates (USD/ton) | Industries | CBAM tax rate |
|---|---|---|---|
| Scenario 1 | 70.6 | Fertilizers sectors | 0.2600 |
| Steel sectors | 0.1053 | ||
| Aluminum sectors | 0.1599 | ||
| Electricity sectors | 0.2970 | ||
| Cement sectors | 0.0073 | ||
| Scenario 2 | 265 | Fertilizers sectors | 1.1431 |
| Steel sectors | 0.4630 | ||
| Aluminum sectors | 0.7030 | ||
| Electricity sectors | 1.3061 | ||
| Cement sectors | 0.0319 | ||
| Scenario 3 | 424 | Fertilizers sectors | 1.8654 |
| Steel sectors | 0.7556 | ||
| Aluminum sectors | 1.1473 | ||
| Electricity sectors | 2.1313 | ||
| Cement sectors | 0.0520 | ||
According to the calculated CBAM tax rates, we conduct shocks on the model, focusing on the impact of CBAM on international trade. We select four international trade indicators for an in-depth analysis: the price index of merchandise exports, the volume of global merchandise exports by region, the volume of global merchandise exports by commodity, and the TOT.
4.3.1.1. Price Index of Merchandise Exports
The Pxwerg index measures the relative change in the average price level of exported goods across various regions, directly reflecting the impact of CBAM-induced cost adjustments on international trade competitiveness. Empirical results based on the GTAP model indicate significant regional heterogeneity in response, as shown in Figure 1: Under Scenario 1 ($70.6 per ton of CO2), the export prices of the 27 EU countries rise slightly by 1.55 × 10⁻⁶%, while in Scenario 2 ($265 per ton of CO2) and Scenario 3 ($424 per ton of CO2), the price increases expand to 7.03 × 10⁻⁶% and 1.14 × 10⁻⁵%, respectively. In contrast, export prices in non-EU regions generally decline slightly, with China’s price drop reaching −6.56 × 10⁻⁷% under Scenario 3. This asymmetric trend indicates that the EU can pass on part of the carbon costs to the export prices through CBAM, while economies not participating in CBAM are forced to absorb cost differences through price concessions to maintain competitiveness.
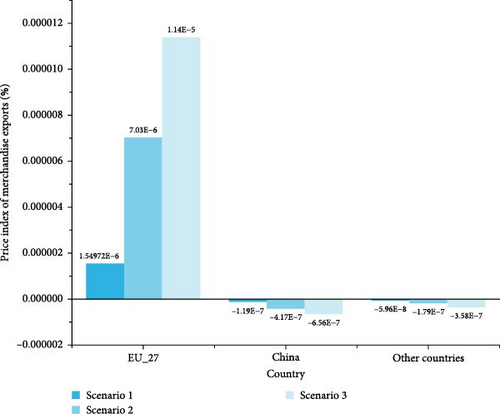
As the implementing entity of the CBAM policy, the EU does not directly face increased costs due to CBAM within its borders. Instead, it protects the competitiveness of its domestic industries to some extent by levying carbon border adjustment taxes on imported goods. In contrast, China, being a significant global exporter of manufactured goods, has a relatively large share of high carbon-emission industries within its industrial structure and lags behind in carbon reduction technologies and green transformation. When confronted with higher CBAM tax rates, Chinese exporting companies face significant cost pressures and find it difficult to effectively respond through technological upgrades in the short term, leading to a decrease in the export price index of their goods. Other countries are facing similar situations.
4.3.1.2. Volume of Global Merchandise Exports by Region
The Qxwreg index reflects the regional restructuring of the global trade landscape following the implementation of CBAM, with its rate of change directly measuring the inhibitory effect of carbon cost disparities on regional export scales. Simulation data indicate that exports from all regions show a downward trend, and the decrease significantly expands with increasing tax rates, as shown in Figure 2: Under Scenario 1 ($70.6 per ton of CO2), exports from the 27 EU countries decline by 7%, while other countries and China decline by 7% and 1.75%, respectively; when the tax rate rises to Scenario 3 ($424 per ton of CO2), the declines intensify to 49%, 50%, and 12.5% for the three, respectively. It is noteworthy that although non-EU economies generally face more severe contractions, China’s export volume decline is relatively moderate, suggesting that its trade structure or policy response may possess heterogeneity buffering mechanisms.
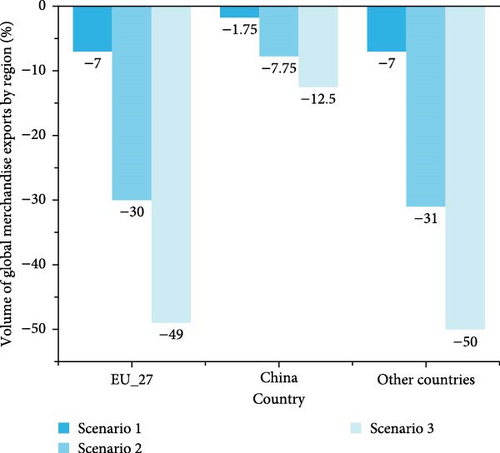
This outcome is primarily due to the inhibitory effect of CBAM on international trade and its differentiated impact on the industrial structures and trade patterns of various regions. The systematic contraction in export volumes stems from the stepwise increase in global trade costs caused by CBAM. As the implementing entity of the CBAM policy, the EU’s export volume decreases mainly because the policy impacts the global trade environment, leading to an overall decline in global demand, thereby affecting the EU’s export market. Concurrently, the CBAM policy may prompt EU enterprises to shift some production segments internally to reduce carbon emission costs, which also suppresses its export scale to a certain extent. For China, the relatively smaller decrease in export volume is largely due to its strong resilience and adaptability within the global industrial chain, enabling it to adjust its industrial structure and optimize trade patterns to partially alleviate the pressure brought by CBAM. However, as CBAM tax rates further increase, Chinese exporting enterprises face greater cost pressures, leading to an expanding decline in export volume. Other countries’ export volume decreases to an extent similar to that of the EU, indicating that the negative impact of CBAM policy on global trade is widespread, especially under high tax scenarios where its inhibitory effect on exports is more pronounced.
4.3.1.3. Volume of Global Merchandise Exports by Commodity
The Qxwcom index reveals the industry-specific impact of varying CBAM tax rates on the global trade structure, with its rate of change directly quantifying the dynamic response differences between carbon-intensive and non-carbon-intensive goods in cross-border flows. Research indicates that the export volumes of all carbon-exposed goods decrease nonlinearly with the increase in CBAM tax rates, and there are significant differences in sensitivity across industries, as shown in Figure 3: Under Scenario 1 ($70.6 per ton of CO2), the export declines are most severe in the fertilizer (−9.0%), energy (−31.0%), and agriculture (−72.4%) sectors, while steel (−0.4%) and cement (−0.02%) show relatively moderate declines; when the tax rate rises to Scenario 3 ($424 per ton of CO2), the agriculture sector’s exports contract by −518.9%, and the energy and industrial sectors decrease by −222.5% and −148.0%, respectively, highlighting their extreme vulnerability in terms of carbon intensity and trade elasticity.
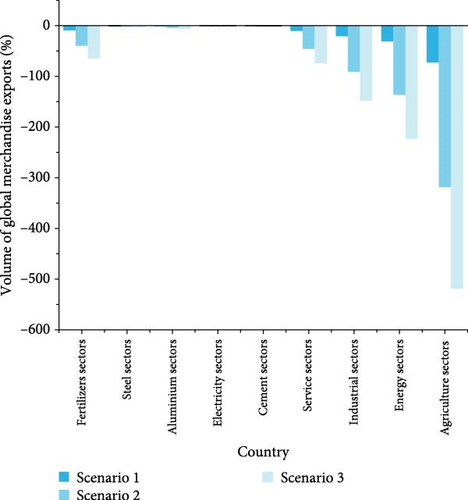
This outcome primarily stems from the differentiated impact of the CBAM policy on various categories of goods. The CBAM policy primarily targets carbon-intensive goods, such as fertilizers, steel, aluminum, and cement, which generate substantial carbon emissions during production. Consequently, under the backdrop of increasing CBAM tax rates, the export costs of these goods rise, leading to a decrease in export volumes. Although the electricity sector also faces cost pressures under the CBAM policy, its export volume changes are relatively minor due to its smaller scale in international trade. The sectors of services, industry, energy, and agriculture experience larger declines, mainly because these industries hold significant positions in global trade and their production processes involve certain carbon emissions. Thus, against the backdrop of rising CBAM tax rates, their export costs increase, leading to a decrease in export volumes. Furthermore, these sectors are grouped together in this study by related departments, leading to more significant changes. As CBAM tax rates continue to rise, the export volumes of various categories of goods gradually decline, indicating that the inhibitory effect of CBAM policy on global trade is widespread and cumulative.
4.3.1.4. TOT
TOT is a key indicator for measuring the price ratio of imported and exported goods for a country or region, reflecting its relative economic benefits in international trade. Specifically, an improvement in trade conditions (i.e., an increase in the trade conditions index) implies that the country or region’s exported goods’ prices rise relative to the prices of imported goods, thereby gaining a more favorable position in international trade; conversely, it indicates a loss in trade benefits. As shown in Figure 4, simulation data indicates that the TOT for the 27 EU countries marginally improves under the three scenarios (Scenario 1: +7.15 × 10⁻⁶%, Scenario 3: +5.36 × 10⁻⁶%), and the extent of improvement is positively correlated with the CBAM tax rate; other regions generally deteriorate, among which China’s TOT decreases by −1.73 × 10⁻⁶% under Scenario 3. This asymmetric pattern confirms that CBAM constructs the international trade price system through carbon pricing weights.
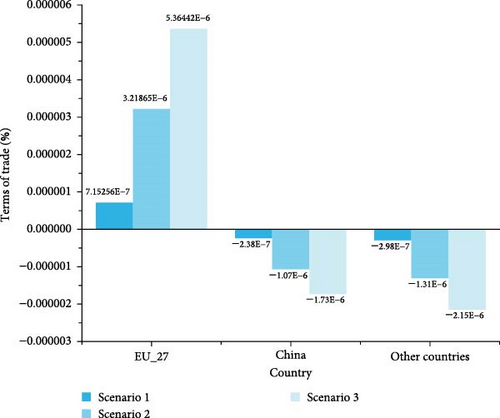
The gradual improvement in the EU’s trade terms stems from the dual pricing mechanism of CBAM: on one hand, it embeds carbon costs into imported goods, raising the supply prices of foreign exporters and strengthening the relative price advantage of EU exports; on the other hand, EU companies further expand the export price increase by passing carbon costs onto export pricing (as indicated by the Pxwreg index). In contrast, China and other nations, as subjects of the CBAM policy, export a larger share of carbon-intensive products, facing higher export costs. Against the backdrop of rising CBAM tax rates, the relative prices of these countries’ exported goods decline while the prices of imported goods rise, leading to a deterioration in their trade terms. As CBAM tax rates continue to increase, this trend of worsening trade terms becomes more pronounced, indicating that the CBAM policy has a significant negative impact on the international trade interests of non-EU countries.
4.3.2. Scenario Analysis of the Future Development Trends of CBAM
To further explore the impact of CBAM and related tariff policies on international trade, we have established four scenarios based on the EU carbon price in 2024. Scenario 4: CBAM is expanded from taxing direct carbon emissions (Scope 1) to also taxing indirect carbon emissions (Scope 2). Scenario 5: CBAM is extended from targeting only specific high-energy-consuming industries to covering all sectors. Scenario 6: In response to CBAM, other countries impose a carbon tariff on the EU based on their own domestic carbon prices. For example, China’s average carbon price in the national carbon market in 2024 was $13.37 per ton of carbon emissions. Scenario 7: Other countries impose an equivalent carbon tariff on the EU based on the CBAM tax rate. The specific tax rates are shown in Table 2.
| CBAM levy scenarios | CBAM levy rates (USD/ton) | Industries | CBAM tax rate |
|---|---|---|---|
| Scenario 4 | The scope of CBAM coverage includes emissions from Scope 1 and Scope 2 | Fertilizers sectors | 0.2856 |
| Steel sectors | 0.1014 | ||
| Aluminum sectors | 0.0782 | ||
| Electricity sectors | 0.3078 | ||
| Cement sectors | 0.0079 | ||
| Scenario 55 | The scope of CBAM is expanded to cover all sectors | Fertilizers sectors | 0.2600 |
| Steel sectors | 0.1053 | ||
| Aluminum sectors | 0.1599 | ||
| Electricity sectors | 0.2970 | ||
| Cement sectors | 0.0073 | ||
| Scenario 6 |
|
Fertilizers sectors | 0.0607 |
| Steel sectors | 0.0246 | ||
| Aluminum sectors | 0.0374 | ||
| Electricity sectors | 0.0694 | ||
| Cement sectors | 0.0017 | ||
| Scenario 7 |
|
Fertilizers sectors | 0.2600 |
| Steel sectors | 0.1053 | ||
| Aluminum sectors | 0.1599 | ||
| Electricity sectors | 0.2970 | ||
| Cement sectors | 0.0073 | ||
4.3.2.1. Price Index of Merchandise Exports
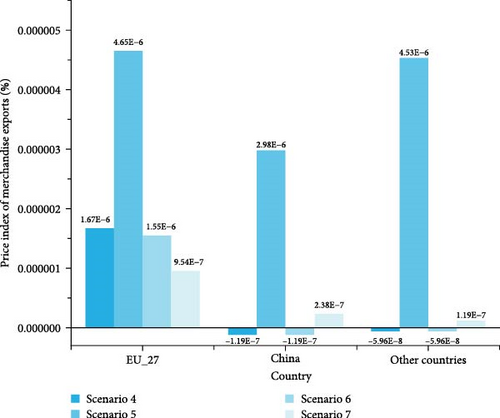
As shown in Figure 5, the simulation data indicates that expanding the coverage of CBAM (Scenarios 4 and 5) significantly intensifies the upward pressure on EU export prices. Among them, Scenario 5 (taxation on all sectors) leads to the largest increase in EU export prices (4.65 × 10⁻⁶%), reflecting that the expansion of the scope of internalized carbon costs exacerbates corporate pricing adjustments. Non-EU economies experience positive export price growth for the first time in Scenario 5 (other countries + 4.53 × 10⁻⁶%, China + 2.98 × 10⁻⁶%), suggesting that they partially absorb external carbon constraints through low-carbon upgrading of the industrial chain. When other countries implement equivalent carbon tariffs (Scenarios 6 and 7), the price increase in the EU declines (Scenario 7 drops to 9.54 × 10⁻⁷%), while China sees positive price growth in Scenario 7 (+2.38 × 10⁻⁷%), indicating that the game of carbon pricing power can reverse the direction of price transmission under a unilateral tax system. The underlying mechanism is as follows: Scenarios 4 and 5 enhance the EU’s ability to pass on the implicit carbon costs of its exported goods systematically by expanding the emission accounting boundaries of CBAM (Scope 2) and the industry coverage. Scenarios 6 and 7, on the other hand, weaken the EU’s carbon pricing monopoly by establishing symmetrical carbon barriers, forcing other economies to convert domestic carbon price differences into export price competitive advantages, thereby triggering two-way carbon cost transmission and rebalancing of trade conditions.
4.3.2.2. Volume of Global Merchandise Exports by Region
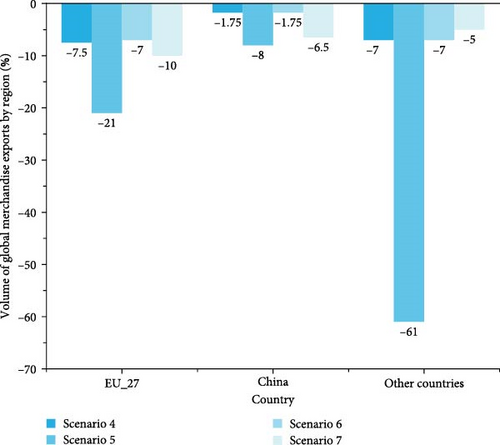
When the scope of CBAM is expanded to cover Scope 2 carbon emissions (Scenario 4) and all sectors (Scenario 5), the global export volume significantly contracts more severely. In particular, the EU’s export volume drops by −21% in Scenario 5, while other countries and China experience sharp declines of −61% and −8%, respectively. This reflects the systemic suppression of high-carbon industrial chains due to the generalization of carbon constraints (as shown in Figure 6). This result also confirms the “boomerang effect” of unilateral climate policies—expanding the coverage of carbon pricing can curb carbon leakage but may come at the cost of reduced global trade efficiency. However, after other countries implement carbon tariffs (Scenarios 6 and 7), trade contraction diverges: the EU’s decline rebounds to −10% in Scenario 7, while China’s situation further deteriorates to −6.5%, indicating that symmetrical carbon barriers may exacerbate the trade friction costs between developed and developing countries.
4.3.2.3. Volume of Global Merchandise Exports by Commodity
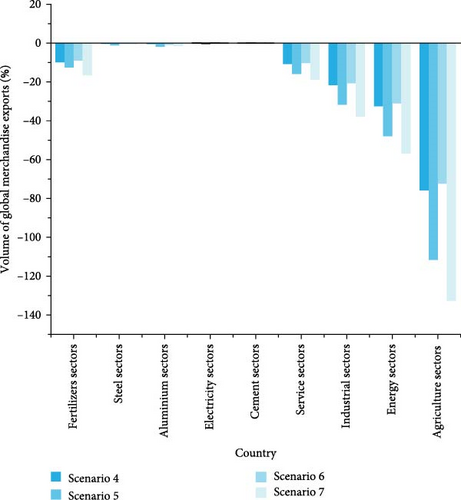
The simulation results indicate (as shown in Figure 7) that the expansion of CBAM policy scope (Scenarios 4 and 5) and the implementation of symmetrical carbon tariffs (Scenarios 6 and 7) have a significant carbon intensity gradient effect on industry export volumes. When CBAM covers indirect carbon emissions (Scenario 4), the export volume declines in the energy (−32.5%) and agriculture (−75.9%) sectors are much greater than in the baseline scenario, highlighting the amplification effect of their supply chain’s implicit carbon exposure. Under the all-sector taxation (Scenario 5), which traces the carbon footprint across the entire industry chain, the digital carbon footprint of the service sector is linked with the physical carbon costs of industrial goods, creating a cross-sector cost resonance. As a result, the export volume declines in downstream sectors such as industry (−31.8%) and services (−15.9%) are exacerbated, and the power sector even experiences negative growth (−0.28%), reflecting the penetrating impact of the generalized carbon accounting boundaries on the trade of nonphysical goods. It is worth noting that symmetrical tariffs in Scenario 7 further exacerbate the collapse of high-carbon industries (agriculture −132.6%, energy −56.8%). Moreover, the “carbon-for-carbon” trade game in Scenario 7 reshapes comparative advantages through two-way carbon price signals. Regions leading in low-carbon technologies (such as China’s power sector + 0.0156%) achieve trade flow redirection in certain areas.
4.3.2.4. TOT
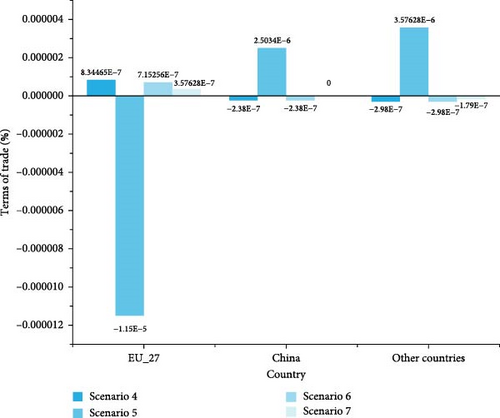
The simulation data show (as shown in Figure 8) that the impact of CBAM policy upgrades and symmetrical carbon tariffs on TOT exhibits an asymmetric redistribution feature. In Scenario 5 (taxation on all sectors), the EU’s TOT turns negative for the first time (−1.15 × 10⁻⁵%), while the TOT of other countries and China improves against the trend (+ 3.58 × 10⁻⁶% and + 2.50 × 10⁻⁶%, respectively). This indicates that the generalization of carbon regulation may weaken the EU’s monopoly on carbon pricing. Although its all-sector taxation increases the carbon costs of imported goods, the EU’s domestic enterprises suffer from a decline in export price competitiveness due to lagging low-carbon transformation, resulting in a “self-sanctioning” effect. Under the symmetrical tariff scenarios (Scenarios 6 and 7), the EU’s TOT increase diminishes with the intensity of the game (dropping to 3.58 × 10⁻⁷% in Scenario 7), and China’s TOT zeroes out in Scenario 7. This reflects that the two-way carbon barriers offset each other through price transmission, forming a balanced state of trade gains.
5. Conclusion
This study comprehensively assesses the complex impacts of CBAM policies and associated tariffs on international trade by constructing multiple scenarios and examining the rate of change in four key trade indicators (Pxwreg, Qxwreg, Qxwcom, and TOT). The results indicate that the implementation and expansion of CBAM have significantly affected global trade patterns. Specifically, under Scenario 4 (expansion to Scope II indirect emissions) and Scenario 5 (expansion to all sectors), the EU—being the primary implementer of CBAM—experienced increases in its export price index by 1.67E−06% and 4.65E−06%, respectively. This suggests that industrial restructuring and adoption of green technologies have enhanced the value-added content and competitiveness of EU exports. Notably, in Scenarios 1–5, although the magnitude of changes in TOT is minimal, the consistent directional trends highlight the institutional influence of carbon border taxation. By establishing a carbon price benchmark, the EU systematically reshapes price relations in multilateral trade, positioning carbon cost as a new core variable in the distribution of trade gains. This “carbon pricing–terms of trade” linkage could intensify structural imbalances between the Global North and South, steering the global trading system toward a climate-regulation-driven paradigm.
However, under Scenarios 4 and 5, the export price index for China and other countries declines by 1.19E−07% and 2.98E−06%, respectively, accompanied by significant reductions in export volumes and worsening TOT. This is primarily because the CBAM policy raises the export costs of carbon-intensive products, thereby weakening their price competitiveness in global markets. For instance, under Scenario 5, exports from China and “other countries” decline by 8% and 61%, respectively, while exports from the EU-27 decrease by 21%. Additionally, when other countries impose carbon tariffs on the EU (Scenarios 6 and 7), the EU’s TOT improve further, while those of other countries show slight improvement but remain unfavorable. This suggests that retaliatory trade measures can partially offset the adverse effects of the CBAM, although global trade as a whole continues to experience significant disruption. Overall, the suppressive effects of the CBAM policy and the retaliatory measures it provokes are broad-based and cumulative, intensifying as the policy’s scope expands and carbon tariff rates rise.
Moreover, this study further uncovers the varying impacts of the CBAM policy across different commodity groups and regions. Under Scenarios 4 and 5, export volumes in high-carbon-emitting industries—such as fertilizers, steel, aluminum, and cement—decline significantly, indicating that carbon tariffs directly undermine the export competitiveness of these sectors. Specifically, in Scenario 5, exports from the fertilizer sector decrease by 12.6%, from steel by 1.13%, and from aluminum by 1.88%. Regionally, although exports from the EU-27 declined, the reductions were more pronounced for China and other countries, suggesting that the CBAM policy more profoundly reshapes global trade patterns, particularly affecting exports from high-carbon-emitting economies. In Scenario 5, exports from other countries drop by 61%, compared to a 21% decline in exports from the EU-27. Overall, the implementation of the CBAM policy exerts not only a direct suppressive effect on high-carbon-emitting industries but also an indirect influence on other sectors and regions by altering the global trade landscape. Its negative impact on international trade is widespread and accumulative.
6. Future Perspectives
Although this study reveals the structural impact of CBAM on international trade through multiscenario simulations, several limitations remain. First, the trade model was simplified for analytical convenience, assuming perfect market competition and immediate responses from trade participants to policy changes. Future research could incorporate market imperfections and firm heterogeneity to refine the trade model, conduct dynamic analysis, and assess the long-term effects of CBAM on trade and firm behavior.
Second, the study did not account for the potential synergies between nontariff barriers (NTBs), such as carbon labeling certification, and regional trade agreements (RTAs), such as the CPTPP’s low-carbon provisions, possibly leading to an overestimation of the unilateral impact of carbon tariffs. Future studies could explore how CBAM policies are reshaping the global trading system, with particular attention to trade diversion effects [11]. For instance, they could examine whether high-carbon industries relocate from CBAM-affected countries to others without such regulations and assess the implications for global carbon emissions.
Finally, this study focuses solely on the impact of varying domestic carbon tariff levels on international trade through scenario design. Future research could further examine the synergy between domestic policies—such as carbon taxes and subsidies—and CBAM measures. It could also analyze how international carbon pricing mechanisms influence domestic policy design and how combined domestic carbon strategies affect trade and the national economy.
Conflicts of Interest
The authors declare no conflicts of interest.
Author Contributions
Yan Li: methodology, data curation, visualization, writing – original draft preparation, writing – review and editing. Tian-tian Feng: conceptualization, methodology, writing – review and editing, funding acquisition. Jia-jie Kong: writing – original draft preparation, data curation. Xian-yue Shen: writing – review and editing.
Funding
This work was supported by the Fundamental Research Funds for the Central Universities (3-7-9-2024-10); the National Natural Science Foundation of China (42171278); the Research Service on Methods, Paths and Strategies for Grid Enterprises to Facilitate the Shift from Dual Control of Energy Consumption to Dual Control of Carbon by State Grid Jiangsu Power 2024 (3-4-2024-270).
Acknowledgments
This work was supported by the Fundamental Research Funds for the Central Universities (Seek-Truth Scholar) (3-7-9-2024-10) (Coupling and synergy optimization of low carbon policy mix in the power industry under “Double-carbon goals”); the National Natural Science Foundation of China (Grant No. 42171278); the Research Service on Methods, Paths and Strategies for Grid Enterprises to Facilitate the Shift from Dual Control of Energy Consumption to Dual Control of Carbon by State Grid Jiangsu Power 2024 (Grant number 3-4-2024-270).
Endnotes
Appendix A
| Number | Sector | Number | Sector |
|---|---|---|---|
| 1 | Crop cultivation | 17 | Fertilizers |
| 2 | Forestry | 18 | Medical and pharmaceutical products |
| 3 | Livestock and livestock products | 19 | Rubber products and plastic products |
| 4 | Fishery | 20 | Nonmetallic mineral products |
| 5 | Coal mining and processing | 21 | Steel |
| 6 | Crude petroleum and natural gas | 22 | Aluminum |
| 7 | Non-metallic minerals and other mining | 23 | Metal products |
| 8 | Food processing | 24 | General purpose machinery |
| 9 | Food production | 25 | Transport equipment |
| 10 | Beverages | 26 | Electrical equipment |
| 11 | Textiles | 27 | Electronic equipment |
| 12 | Wearing apparel | 28 | Electricity |
| 13 | Leather, furs, down and related products | 29 | Gas production and supply |
| 14 | Sawmills, fiberboard, and products of wood, bamboo, cane, palm, straw, etc. | 30 | Water production and supply |
| 15 | Paper and paper products | 31 | Cement |
| 16 | Processing of petroleum, coking and processing of nuclear fuel | 31 | Other service |
| Number | Sector | ||
|---|---|---|---|
| 1 | Crop cultivation | 0.000731396525803768 | 0.000891888407046940 |
| 2 | Forestry | 0.000107535304335732 | 0.000148651045292982 |
| 3 | Livestock and livestock products | 0.000247508857244201 | 0.000269017304666413 |
| 4 | Fishery | 8.47740332285963e-05 | 9.59065668547216e-05 |
| 5 | Coal mining and processing | 0.00300028099663583 | 0.00324927773522725 |
| 6 | Crude petroleum and natural gas | 0.0173306118860083 | 0.0192953745050548 |
| 7 | Nonmetallic minerals and other mining | 0.00304447093177254 | 0.00340134684039621 |
| 8 | Food processing | 0.000592208946109552 | 0.000672123658964816 |
| 9 | Food production | 8.41331461117250e-05 | 0.000102729375967787 |
| 10 | Beverages | 0.000348390321140285 | 0.000372177617283318 |
| 11 | Textiles | 0.000486949344152161 | 0.000670159907089565 |
| 12 | Wearing apparel | 0.000411786432869589 | 0.000457071093069655 |
| 13 | Leather, furs, down and related products | 6.41410538094720e-05 | 8.27059414028746e-05 |
| 14 | Sawmills, fiberboard, and products of wood, bamboo, cane, palm, straw, etc. | 0.000180188494003302 | 0.000241154053928066 |
| 15 | Paper and paper products | 0.000394489130427338 | 0.000540092375786105 |
| 16 | Processing of petroleum, coking and processing of nuclear fuel | 0.00281237119138309 | 0.00293502860377653 |
| 17 | Fertilizers | 0.00477907642994522 | 0.00524935088671311 |
| 18 | Medical and pharmaceutical products | 0.000494103363378437 | 0.000456698809424551 |
| 19 | Rubber products and plastic products | 0.000699157724467693 | 0.000814818495366899 |
| 20 | Nonmetallic mineral products | 0.000687199244730468 | 0.000696453008969210 |
| 21 | Steel | 0.00185642352476207 | 0.00178693922578792 |
| 22 | Aluminum | 0.00292322632755985 | 0.00142934780635286 |
| 23 | Metal products | 0.000782883448742622 | 0.000853344107106187 |
| 24 | General purpose machinery | 0.000913494386582830 | 0.000991178273977322 |
| 25 | Transport equipment | 0.000527650195740173 | 0.000588642071526725 |
| 26 | Electrical equipment | 0.000934392779207489 | 0.00103396715474616 |
| 27 | Electronic equipment | 0.00125377863406005 | 0.00143109520569788 |
| 28 | Electricity | 0.00519037525362695 | 0.00537767145054698 |
| 29 | Gas production and supply | 0.00464923756828180 | 0.00517983029334203 |
| 30 | Water production and supply | 0.000119656396899982 | 0.000137645814664107 |
| 31 | Cement | 0.000126708755450509 | 0.000137376609349810 |
| 32 | Other service | 0.0177653894347174 | 0.0190736942582965 |
| Number | Sector | CBAM tax rate |
|---|---|---|
| 1 | Crop cultivation | 0.0401 |
| 2 | Forestry | 0.0061 |
| 3 | Livestock and livestock products | 0.0134 |
| 4 | Fishery | 0.0048 |
| 5 | Coal mining and processing | 0.1717 |
| 6 | Crude petroleum and natural gas | 0.9918 |
| 7 | Nonmetallic minerals and other mining | 0.1742 |
| 8 | Food processing | 0.0329 |
| 9 | Food production | 0.0044 |
| 10 | Beverages | 0.0187 |
| 11 | Textiles | 0.0260 |
| 12 | Wearing apparel | 0.0212 |
| 13 | Leather, furs, down and related products | 0.0033 |
| 14 | Sawmills, fiberboard, and products of wood, bamboo, cane, palm, straw, etc. | 0.0101 |
| 15 | Paper and paper products | 0.0226 |
| 16 | Processing of petroleum, coking and processing of nuclear fuel | 0.1587 |
| 17 | Fertilizers | 0.2600 |
| 18 | Medical and pharmaceutical products | 0.0278 |
| 19 | Rubber products and plastic products | 0.0380 |
| 20 | Nonmetallic mineral products | 0.0376 |
| 21 | Steel | 0.1053 |
| 22 | Aluminum | 0.1599 |
| 23 | Metal products | 0.0435 |
| 24 | General purpose machinery | 0.0514 |
| 25 | Transport equipment | 0.0290 |
| 26 | Electrical equipment | 0.0522 |
| 27 | Electronic equipment | 0.0713 |
| 28 | Electricity | 0.2970 |
| 29 | Gas production and supply | 0.2661 |
| 30 | Water production and supply | 0.0068 |
| 31 | Cement | 0.0073 |
| 32 | Other service | 1.0096 |
Open Research
Data Availability Statement
The data are available on request.
- 1China Economic Net, China and Europe join hands to safeguard multilateral trade to the benefit of many parties. http://www.ce.cn/xwzx/gnsz/gdxw/202502/13/t20250213_39290037.shtml.
- 2EU Emissions Trading System (EU ETS). https://icapcarbonaction.com/en/ets/eu-emissions-trading-system-eu-ets.
- 3Pioneer PKU, 2022. How Much Carbon Dioxide is Emitted from Consuming 1 kg of Standard Coal? A Comprehensive Guide to Conversion Factors. https://huanbao.in-en.com/html/huanbao-2379476.shtml.
- 4Carbon Herald, 2025. China’s Carbon Market Sees Off Successful 2024 But Challenges Persist. https://carbonherald.com/chinas-carbon-market-sees-off-successful-2024-but-challenges-persist/.
- 5For presentation purposes, Scenario 5 presents the CBAM tax rates for only five covered sectors, and the CBAM tax rates for all sectors are shown in Appendix A Table A3.


