Freestanding ZIF-9-Derived Cobalt Carbon Nanofibers for Supercapacitor Electrodes
Abstract
A zeolitic imidazolate framework (ZIF-9) was synthesized via solvothermal reaction using cobalt (Co) salt and benzimidazole ligands in the presence of polyacrylonitrile. The precursor was electrospun to form carbon nanofibers (CNFs) creating freestanding, binder-free supercapacitor electrodes. Polyvinylpyrrolidone (PVP) and NaCl were added to the precursor solution to reduce fiber diameter and improve structural integrity during high-temperature annealing. The Co/CNF sample achieved an areal capacitance of 316 mF cm−2 and an energy density of 0.043 mWh cm−2 at a current density of 1 mA cm−2. The addition of NaCl and PVP reduced fiber diameter by 30% and increased capacitance by 3.6 times. The optimal sample maintained 96.2% of its capacitance over 10,000 charge/discharge cycles, demonstrating strong electrochemical stability. Symmetrical pouch cells with the developed electrodes powered a light-emitting diode and a humidity/temperature sensor, demonstrating their potential in portable electronics.
- •
Controlling electrospun zeolitic imidazolate framework (ZIF-9)/polyacrylonitrile-fiber enhanced electroactive sites.
- •
NaCl/polyvinylpyrrolidone (PVP) reduced the carbon nanofiber (CNF) diameter and surface roughness.
- •
NaCl/PVP-based cobalt (Co)–CNFs exhibited high capacitances and energy densities.
- •
A supercapacitor with the optimal electrode retained 96.2% of its capacitance after 10,000 cycles.
1. Introduction
Electrospun polymer–metal composites have sparked considerable interest as electrode materials for use in high-power energy storage devices owing to their modifiable electrical and morphological properties, with metal/carbon nanofiber (CNF) composites being of particular interest [1, 2]. Supercapacitors (SC) have emerged as indispensable power sources for use in various applications, including hybrid electric vehicles and portable electronic devices [3–5]. Integrating high-energy-density rechargeable batteries with high-power-density supercapacitors represents a significant advancement that further expands their applications for hybrid systems that store energy from intermittent renewable sources [6–9]. In this regard, the precise coordination chemistry of metal cations and organic ligands is essential for advancing pseudocapacitor materials by enabling them to store significant energy through Faradaic reactions efficiently [10]. Zeolitic imidazolate frameworks (ZIFs) exemplify this coordination chemistry through the interactions of Zn or Co with organic ligands. Composite electrodes incorporating ZIFs or ZIF-derived carbon exhibit high electrochemical performance and power densities while highly electrochemically stable and environmentally compatible [11, 12]. ZIF-67 and ZIF-9, synthesized using Co salts with methyl imidazole and benzimidazole (BIM) ligands, respectively, have garnered considerable attention. ZIF-67- and ZIF-9-derived cobalt (Co)–carbon–nitrogen frameworks facilitate rapid Faradaic reactions and electron transfer owing to the presence of metallic Co. Integrating ZIF-67 or ZIF-9 into a polyacrylonitrile (PAN) solution during electrospinning, followed by thermal stabilization in air and carbonization in argon, enhances the structural characteristics and increases the surface area of the resultant CNFs. The incorporation of ZIFs into the PAN matrix markedly boosts the electrical conductivity of these CNFs, mainly owing to the reduction of Co during carbonization [13]. This interaction fosters a synergistic effect that amplifies charge transfer capabilities and the overall electrochemical activity. As a result, the composites exhibit outstanding electrochemical performance, with remarkable stability and efficiency for energy storage applications, such as supercapacitors and batteries [14–16].
Previous relevant studies utilized Co-based materials including CoS2@gC/rGO [17], CoNi2S4/C/MXene [18], and Co-ZIF-67 [19] as nonfreestanding supercapacitors that retained 76%, 64%, and 67% of their capacitances, respectively, after 10,000 galvanostatic charge/discharge (GCD) cycles. Meanwhile, More et al. [20] used C/Co–CoOx/Mn–CNF as a freestanding supercapacitor that exhibited a capacitance retention of 110% after 10,000 GCD cycles. In contrast, Khadka et al. [21] used CoOx@CN to deliver a freestanding supercapacitor that retained 94% of its capacitance after 30,000 GCD cycles.
ZIF-9 is highly electrochemically stable and can be readily functionalized with polymers owing to the presence of the benzene ring originating from its BIM ligand. This benzene ring is structurally stable because the carbon and nitrogen are hexagonally bonded [22, 23]. Guo et al. [24] synthesized ZIF-9@polyaniline (PANI) on nickel foam that demonstrated a maximum capacitance of 727 F g−1 at a current density of 0.5 A g−1, with a capacitance retention of 113% after 20,000 cycles; PANI was included to endow ZIF-9 with electrical conductivity [24], achieving excellent electrochemical stability. Ebrahimi et al. [25] reported that ZIF-67/ZIF-9 composites delivered a maximum capacitance of 300 F g−1 at a current density of 0.5 A g−1 and retained 89% of their capacitance after 3000 cycles. However, both Guo et al. [24] and Ebrahimi et al. [25] directly used these as-synthesized ZIFs without heat treatment, and the lack of carbonization deprived them of superior electrical conductivity.
In this study, the precursor solution was prepared by solvothermal synthesis of ZIF-9 in a PAN/N, N-dimethylformamide (DMF) solution, which was electrospun to produce ZIF-9/PAN fibers. These fibers were then stabilized at 150°C in air and carbonized at 900°C in argon. The conductivity and viscosity of the electrospinning solution were adjusted by adding polyvinylpyrrolidone (PVP) and NaCl to the precursor solution to vary the fiber diameter. Introducing NaCl increased the quantity of charge carriers in the polymer solution and amplified the electrostatic forces acting on the jet because of the dissociated Na+ and Cl− ions. Consequently, the PAN fibers elongated during electrospinning, generating consistent fibers with reduced diameters. This outcome is advantageous for increasing the number of electrochemical sites. Therefore, our parametric studies were based on including PVP, NaCl, or both in ZIF-9/PAN, followed by stabilization and carbonization. These ZIF-9/PAN-derived electrodes were freestanding and did not require any binders. The optimal sample was identified through cyclic voltammetry (CV), GCD, and electrochemical impedance spectroscopy.
2. Experimental
2.1. Materials
Co (II) nitrate hexahydrate (CoNt; 98%), BIM (98%), DMF (anhydrous 99.8%), PVP (MW: 40,000), NaCl (99%), PAN (Mw: ~150,000), and polyvinyl alcohol (PVA; Mw: ~89,000–98,000) were procured from Sigma–Aldrich, USA, and used as received.
2.2. Co@Na/N-CNFs Electrode Preparation
The ZIF-9 precursor solution was prepared by mixing two DMF solutions containing 8 wt% CoNt and 4 wt% BIM in a 1 : 1, followed by vigorous stirring at 130°C for 30 min, which changed the color from pink to purple (Supporting Information 1: Figure S1), indicating the formation of ZIF-9. The solution was stirred exhaustively to ensure the solution was completely uniform, after which 2.4 wt% PVP and 1 wt% NaCl were introduced to the purple CoNt/BIM solution while stirring and maintaining the temperature at 130°C. Upon the complete dissolution of PVP and NaCl, the solution adopted a distinctly blue hue (Supporting Information 1: Figure S1), after which 7 wt% PAN was added to the solution, followed by vigorous stirring for 48 h at 130°C. The resulting ZIF-9–PVP–NaCl/PAN precursor solution was then loaded into two 10-mL syringes connected to 18-gauge stainless-steel needles (Figure 1a) to dispense the solution at a precise flow rate of 500 μL h−1 for electrospinning. A voltage of 15 kV was applied to the needles to form stable cone jets that ensured continuous fiber ejection. The two stainless-steel needles were kept 15 cm apart, and the needles were placed 7 cm away from the collecting drum (Supporting Information 1: Figure S2). As the fibers were deposited on the drum, it rotated constantly at 200 rpm for 6 h. The ambient conditions of the electrospinning chamber were set to 40% humidity and a constant temperature of 25°C.
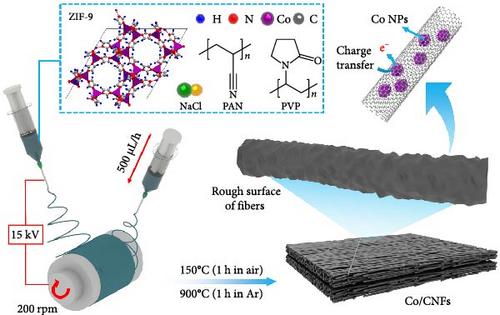
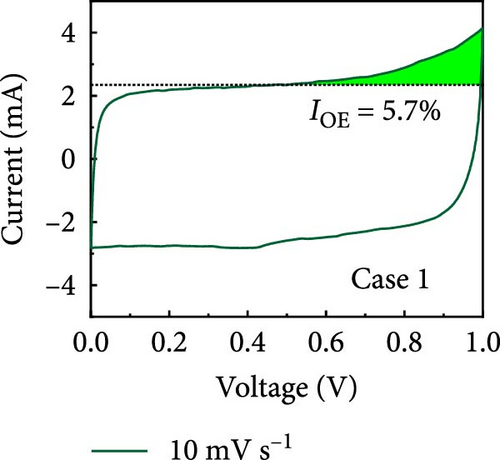
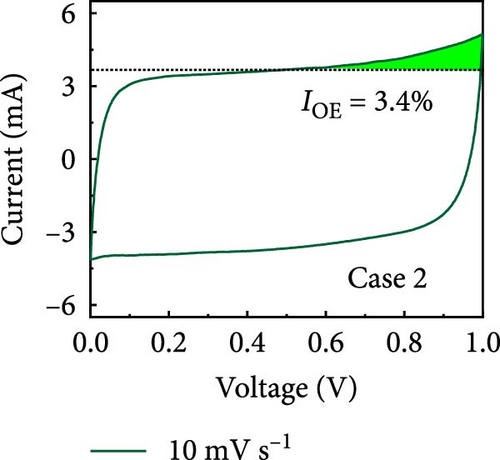
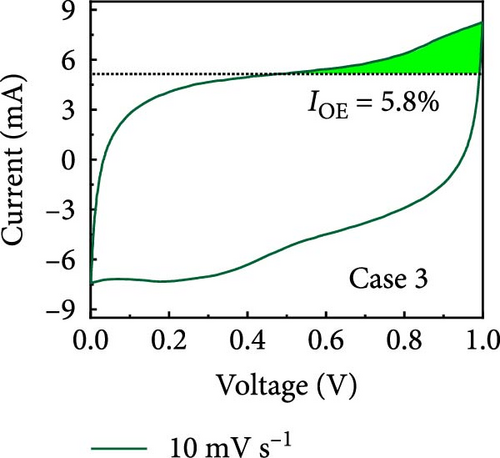
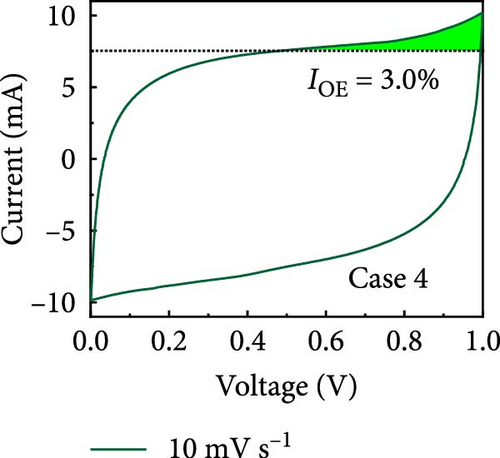
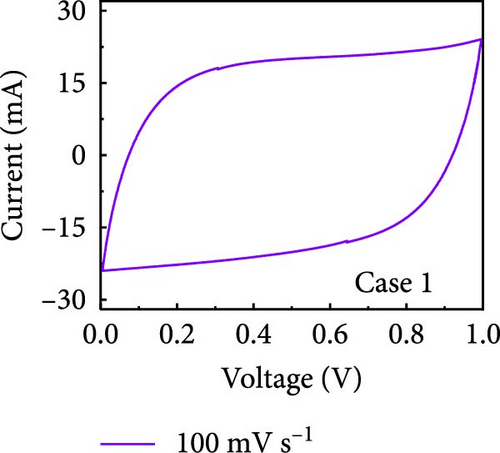
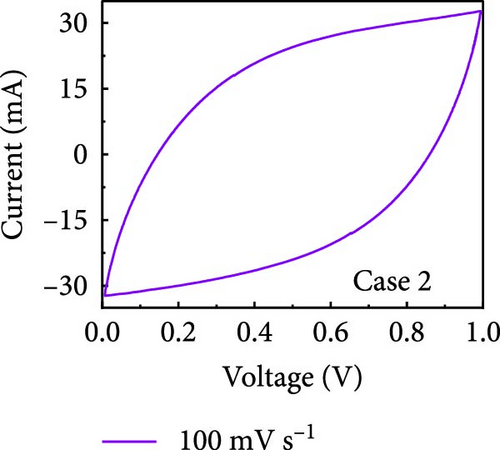
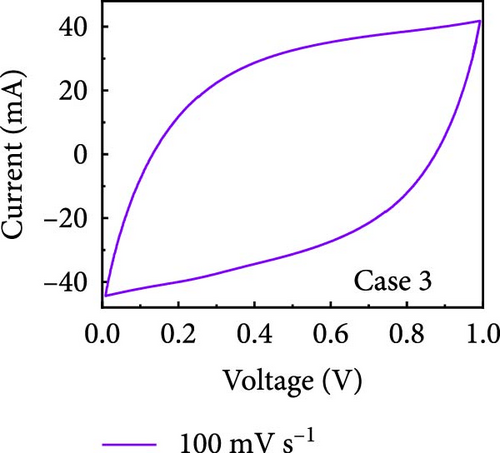
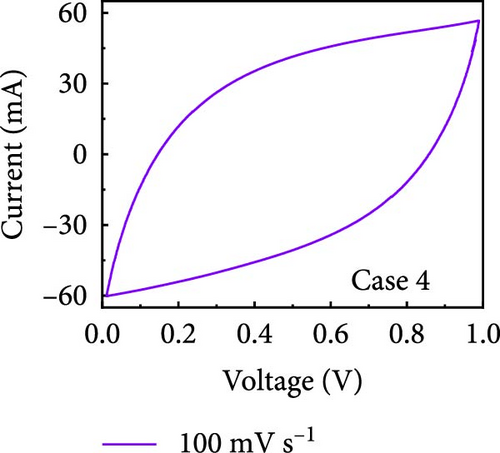
After electrospinning, the resultant ZIF-9–PVP–NaCl/PAN fiber mats were gradually heated at 5°C/min and stabilized in the air at 150°C for 1 h. The stabilized fibers were then heated at 3°C/min in a horizontal tubular furnace, carbonized under flowing Ar for 1 h at 900°C, and allowed to cool naturally to obtain a freestanding black Co@Na/N-CNF mat. Additional experiments were conducted to examine the impact of the additives (PVP and/or NaCl), which involved formulating precursor solutions for ZIF-9/PAN, ZIF-9–PVP/PAN, and ZIF-9–NaCl/PAN fibers, as detailed in the accompanying Supporting Information. The carbonized CNF composites derived from the ZIF-9/PAN, ZIF-9–PVP/PAN, ZIF-9–NaCl/PAN, and ZIF-9–PVP–NaCl/PAN samples are referred to as Cases 1, 2, 3, and 4, respectively. The obtained CNFs were subsequently characterized using various techniques that are comprehensively detailed in the Supporting Information section.
2.3. Electrochemical Measurements
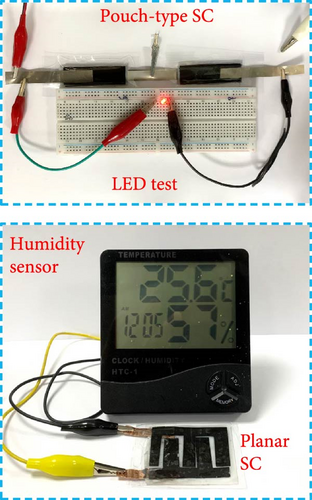
A pouch-type supercapacitor (Figure 1b) was prepared using a PVA/KOH gel electrolyte. PVA (2 g) was dissolved in deionized (DI) water (24 mL) at 80°C with continuous stirring until a transparent PVA solution was obtained. Simultaneously, KOH pellets (3 g) were dissolved in DI water (6 mL) and added dropwise to the PVA solution. The resulting PVA/KOH solution was stirred for 20 min at 85°C, poured into a Petri dish, and heated at 50°C for 2 h to form a gel-like solution by removing excess DI water. The gel-like solution was then left at 25°C for 24 h to obtain the PVA/KOH gel electrolyte [21]. Two pieces of the CNF mat were cut to dimensions of 1.5 × 5 cm2 and used as electrodes with PVA/KOH gel as the electrolyte and separator. Additionally, a T-shaped piece of Ni foil was affixed to the back side of each electrode to establish contact, and the symmetric pouch cell was encased with Scotch tape. We also designed a planar supercapacitor (Figure 1b) using the CNF mats trimmed into a finger-like structure and assembled in two dimensions using the PVA/KOH gel electrolyte and Ni foil. The distinct design and implementation of the PVA/KOH gel electrolyte in both pouch and planar supercapacitors enabled them to power LEDs and humidity sensors (Figure 1b), respectively, demonstrating their practical usefulness in real-world scenarios.
3. Results and Discussions
3.1. Characterizations
The scanning electron microscopy (SEM) images in Figure 2 depict distinct, long, continuous fibers with discernible surface characteristics. Case 1 exhibits protruding metal particles, whereas Case 2 shows a rough surface with sparse particles. Case 3 displays a smooth surface, while Case 4 has a rough surface with a narrow particle distribution. Pronounced interactions between PAN and ZIF-9 induced the upward movement and shrinkage of ZIF-9 particles, leading to the emergence of Co nanoparticles (NPs) on the surface (Figure 2a) [28]. Moreover, PVP vaporization during carbonization resulted in rougher surfaces in Cases 2 and 4 (Figure 2b,d). These results are consistent with our previous observations regarding ZIF/PVP-derived CNF [29]. Figure 2c reveals that the smooth surface of Case 3 and its narrower fibers compared to those of Case 1 are ascribable to the decomposition of NaCl at elevated temperatures; this process was vigorously regulated in our experimental procedures, and volatilization of chlorine resulted in fiber shrinkage. The histograms in the insets of Figure 2 indicate that Cases 1–4 have average fiber diameters of 310, 270, 260, and 220 nm, respectively. Among the four materials, Case 4 exhibits the narrowest fibers, which can plausibly be attributed to the collective impact of PVP and NaCl. Moreover, the comparatively rough surface of Case 4 (Figure 2d) strongly suggests that it may exhibit superior electrochemical performance owing to an augmented contact area with the electrolyte.


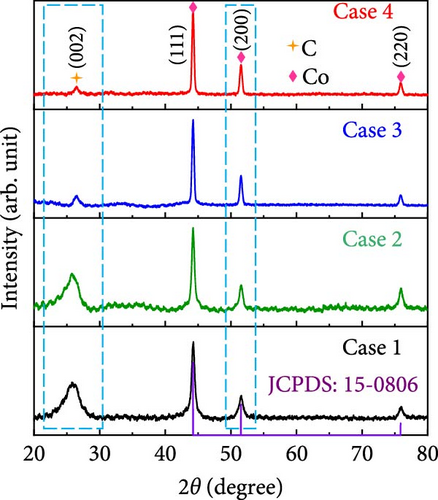
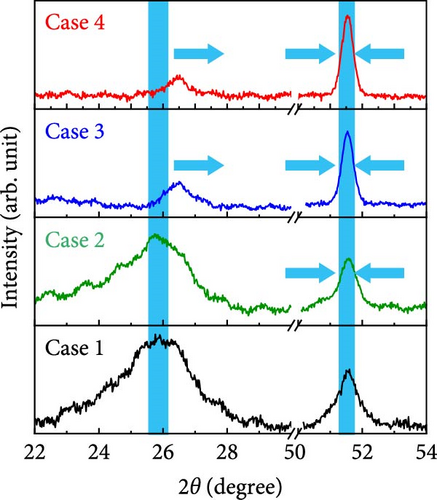
The X-ray diffraction (XRD) patterns of Cases 1–4 were recorded to investigate their crystalline phases and alterations owing to the presence of additives, the results of which are shown in Figure 3a. The XRD patterns of Cases 1 and 2 exhibited a broad peak at 25.9° attributable to the (002) plane of carbon generated through the carbonization of BIM, PAN, and PVP [30]; this peak is consistent with the Joint Committee on Powder Diffraction Standards (JCPDS) 41-1487, which suggests that turbostratic carbon composed of randomly oriented graphitic carbon was present [31]. The diffraction peak ascribable to carbon was broad and visible in the XRD patterns of Cases 1 and 2. In contrast, it was relatively weak in the NaCl-based Cases 3 and 4 patterns, indicating a higher number of defects in the CNFs [32]. The decomposition of NaCl introduced additional nucleation sites that could form smaller carbon domains, thereby resulting in highly disordered carbon. Moreover, Figure 3b reveals that carbon peaks observed for Cases 3 and 4 appear to be shifted to higher diffraction angles relative to those of Cases 1 and 2, consistent with the presence of stress-induced defective carbon owing to the addition of NaCl. All four diffraction patterns in Figure 3a display distinct peaks at 44.2°, 51.5°, and 75.9°, which correspond to the (111), (200), and (220) planes of Co NPs (JCPDS 15-0806) [20, 33], respectively, derived from the carbonization of ZIF-9 in an Ar reducing atmosphere. As depicted in Figure 3b, the diffraction peak attributed to the (200) plane of Co NPs appeared to sharpen with the addition of NaCl, indicating the improved crystallinity of Co NPs. The crystallite sizes determined using the Scherrer equation (Equation S1) increased slightly, from 14.1 nm for Case 1 to 15.7, 21.3, and 21.5 nm for Cases 2–4, respectively.
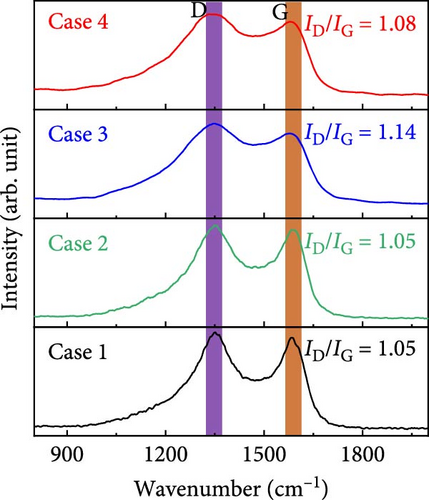
The Raman spectra in Figure 3c show pronounced bands at ~1351.2 and 1589.5 cm−1 that correspond to vibrations from disordered (defect state—D band) and ordered (graphitic state—G band) carbon, respectively; these bands appeared to be sharper in the spectra of Cases 1 and 2. Meanwhile, the NaCl-based Cases 3 and 4 exhibited broader D bands, reflecting a higher number of defect states, consistent with the XRD results. Cases 1–4 exhibited D-to-G intensity ratios (ID/IG) of 1.05, 1.05, 1.14, and 1.08, respectively; the ID/IG value indicates the degree of defective carbon in each sample. These Raman peaks were deconvoluted to determine the defect level in each material, the results of which are shown in Supporting Information 1: Figure S3. Deconvolution revealed four components centered near 1200, 1350, 1540, and 1590 cm−1, which could be assigned to the D4, D1, D3, and G bands attributable to polyene (C─C═ C─C), defective, amorphous, and graphitic carbon, respectively; these data are presented in detail in Table S1. The second-order band (2D) in Supporting Information 1: Figure S3 exhibits double peaks at 2660 and 2990 cm−1 for Cases 1 and 2, which almost overlap in Case 3 and are partially discernible in Case 4. These double peaks indicate a graphitic state resulting from Co catalysis. However, the merging peaks imply increased defects, which is consistent with the analysis results of the D and G bands. This highlights the impact of defects and catalytic activity on CNF structures, which influence their electrical and mechanical properties. This analysis also underscores the critical importance of regulating catalytic effects during synthesis to enhance CNF quality [14, 34, 35]. The low-wavenumber Raman spectra in Supporting Information 1: Figure S3 distinctly show broad peaks at 450 and 682 cm−1 in the spectra of Cases 3 and 4, which are attributable to cobalt oxide (CoO) [36].
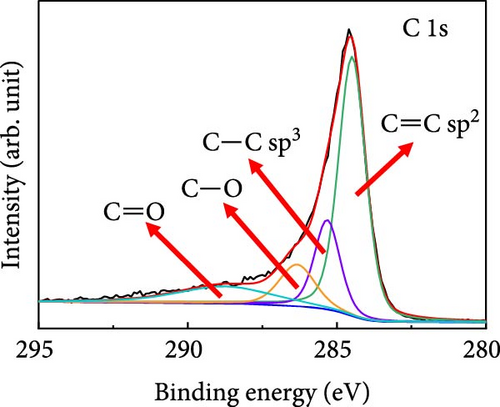
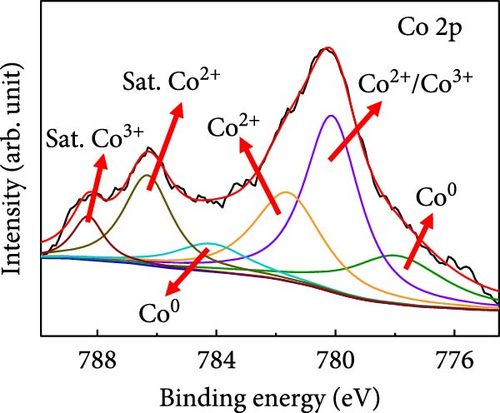
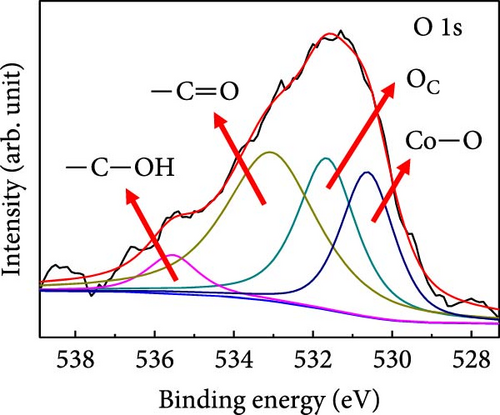
X-ray photoelectron spectroscopy (XPS) was used to determine the elemental compositions and oxidation states of Case 4. The XPS survey spectrum (Supporting Information 1: Figure S4) revealed the presence of C, N, O, Co, and Na. The higher C content is attributable to the carbon derived from BIM/PVP/PAN. Figure 3d shows the C 1s core spectrum with deconvoluted peaks at 284.5, 285.3, 286.4, and 288.8 eV that correspond to C ═ C, C─C, C─O, and C ═ O species in the CNFs, respectively [37]. The dominant C ═ C peak indicates that the high annealing temperature promoted carbon graphitization, which endowed the CNFs with conductivity and a suitable freestanding structure. The Co 2p3/2 region (Figure 3e) exhibits intense peaks at ~780.2 and 781.7 eV, along with a satellite peak at 786.3 eV. These features are associated with Co2+, indicating the presence of CoO. The peak at 780.2 eV may also correspond to Co3+, given the minimal energy separation between these peaks. Furthermore, the satellite peak at 788.2 eV supports the conclusion that Co3+ was present. The other deconvoluted peaks at 777.7 and 783.9 eV are ascribable to metallic Co (Co0), consistent with the XRD observations. Thus, the deconvolution analysis reveals a mixture of metallic and oxidized Co species in the sample [38, 39]. The deconvoluted O 1s spectrum (Figure 3f) shows peaks at 530.6, 531.7, 533.1, and 535.6 eV, which are attributable to metal–oxide (Co─O) bonds, chemisorbed oxygen, and—C ═ O and—C─OH bonds, respectively, all of which formed during stabilization and carbonization. The Co 2p oxidation and O 1 s metal–oxide peaks support the existence of CoO in Case 4. The high-resolution N 1s spectra in Supporting Information 1: Figure S4 show deconvoluted peaks at 397.9, 398.5, 400.5, and 402.2 eV, which correspond to nitrogen in pyridinic, pyrrolic, graphitic, and N–O, respectively, and are derived from the carbonization of BIM and PAN. The Na 1 s spectra of Supporting Information 1: Figure S4 show a peak at the binding energy of 1071.4 eV, along with a plasmon-loss peak at 1078 eV, both of which are consistent with the presence of metallic Na and confirm that carbonization does not lead to the removal of Na.
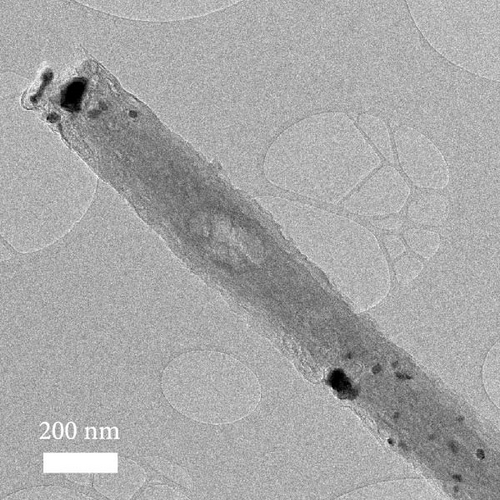
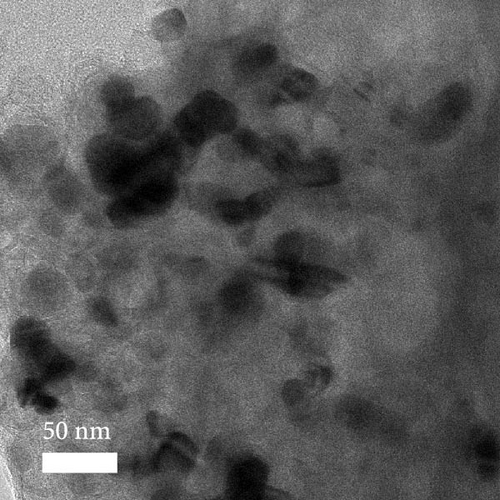
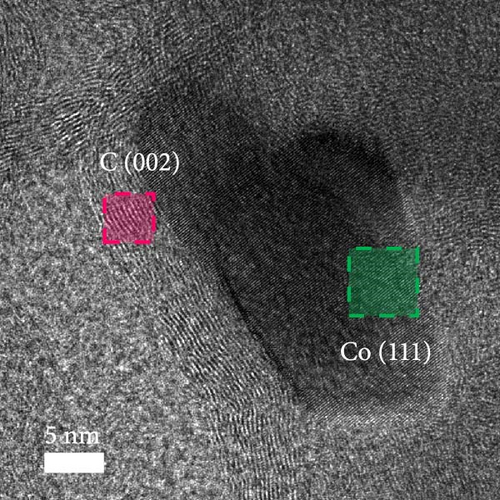
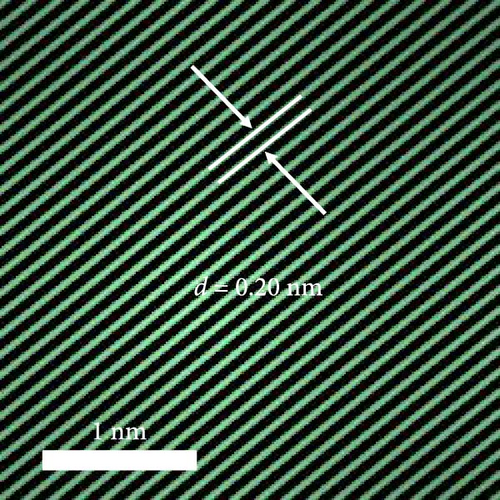
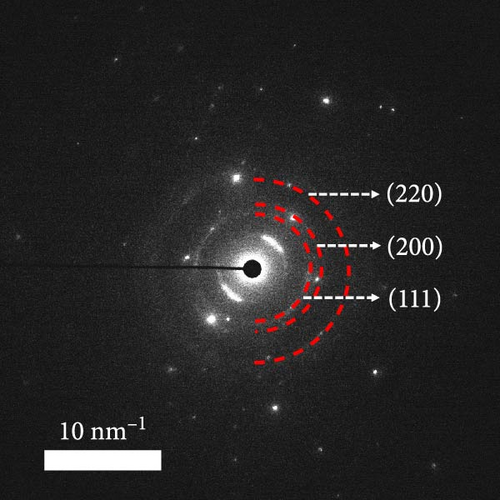
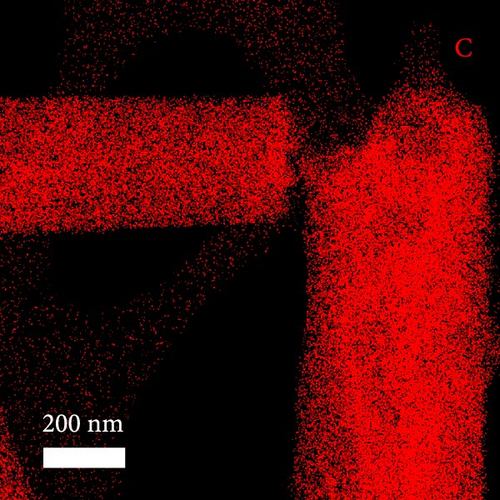
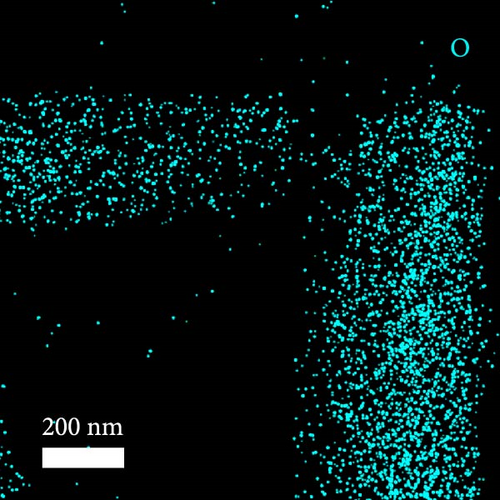
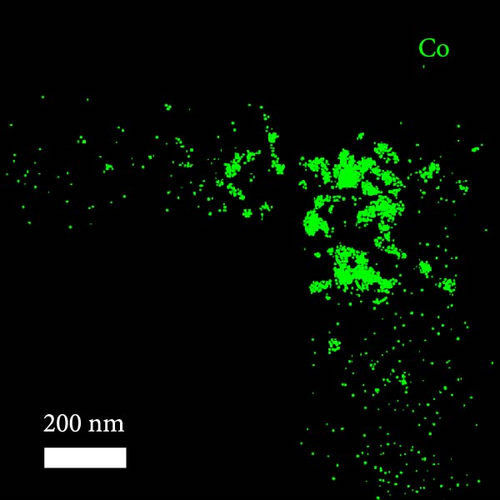
A composite CNF containing ZIF-9-derived Co NPs is depicted in the transmission electron microscopy (TEM) image in Figure 4a, in which distinct bright and dark areas are observed. The dark areas in the high-magnification TEM image (Figure 4b) reveal a well-distributed pattern of Co NPs derived from ZIF-9 embedded within the CNF. The high-resolution TEM (HRTEM) image in Figure 4c shows lattice fringes near the dark area, which indicate Co NPs and carbon, respectively, confirming that ZIF-9 was converted into Co and that BIM/PAN was carbonized. Furthermore, the shaded boxes in Figure 4c were subjected to fast-Fourier-transform and inverse-Fourier-transform analyses using GATAN software to show the lattice spacings clearly. The pink and green areas in Figure 4c exhibit lattice spacings of 0.35 nm (Figure 4d) and 0.20 nm (Figure 4e), respectively, which correspond to the (002) plane of carbon and the (111) plane of Co, respectively [40]. The selected-area electron diffraction (SAED) pattern in Figure 4f exhibits diffraction rings consistent with the (111), (200), and (220) crystal planes of Co, in agreement with the XRD and HRTEM results. Additionally, the high-angle annular dark-field scanning TEM image of the CoOx/CNF in Supporting Information 1: Figure S5 shows dark and bright areas attributable to metal oxide particles and carbon, respectively. The elemental maps in Figure 4g–i and Supporting Information 1: Figure S5 reveal that C, O, Co, N, and Na coexist in the CNFs and that the Co NPs, C, and O are uniformly dispersed. The energy dispersive X-ray (EDX) spectrum in Figure S6 reveals that C was present in the highest atomic percentage (92.5%) because the CNFs were derived from PAN, followed by N (4.13%), O (2.56%), Co (0.44%), and Na (0.37%), which is consistent with elemental mapping.

3.2. Electrochemical Performance
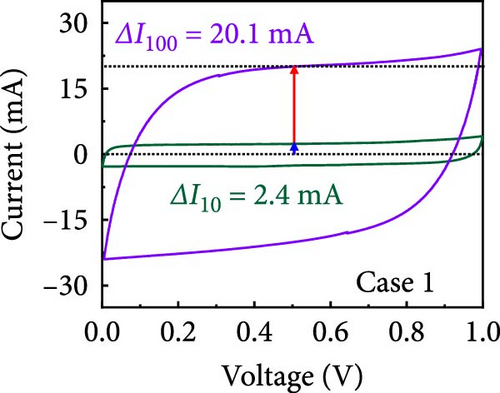
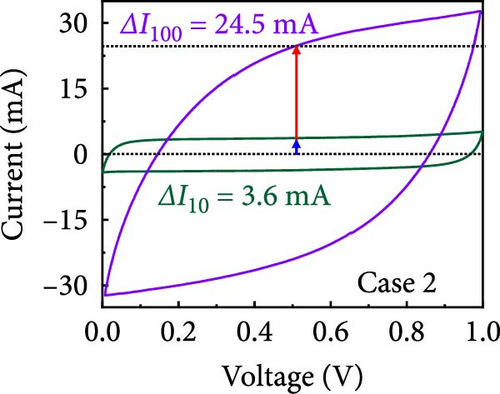
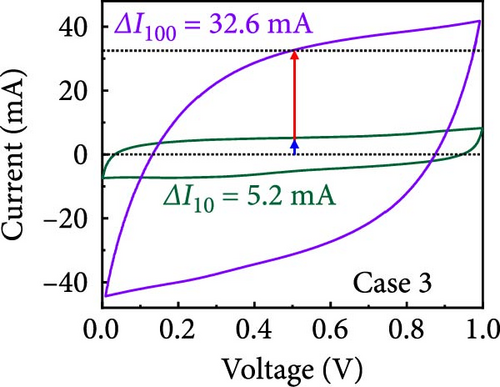
In this study, we used CV at low and high scan rates to analyze the current characteristics of the supercapacitor electrodes, with CV curves for Cases 1–4 acquired at the low scan rate of 10 mV s−1 shown in Figure 5a–d. Cases 1, 2, and 4 exhibit almost rectangular CV traces within the 0–1 V operational potential window. By contrast, Case 3 exhibits a quasirectangular shape in the same potential window, ascribable to the absence of PVP in the precursor solution. Notably, the anodic current increased significantly beyond 0.6 V, indicating the presence of trace amounts of oxygen at the electrode–electrolyte interface that originated from the ZIF-9-derived Co NPs. The increase in Faradaic current at higher potentials during the CV measurements of supercapacitors using aqueous electrolytes can be attributed to the improved ion mobility and enhanced electrode surface activity for Cases 1 (owing to CoOx) and 3 (owing to CoOx and Na). At high potential, the stronger electric field promoted the movement of hydroxide ions or protons, making the Faradaic processes, including the current due to oxygen evolution, more dominant. However, the Faradaic process for Cases 2 and 4 appeared to be significantly suppressed due to additional carbon from carbonized PVP. By contrast, this trend appeared to be attenuated at the higher scan rate of 100 mV s−1 (Figure 5e–h), highlighting the exceptional capacitive attributes of the electrodes. These observations provided valuable insights and demonstrated excellent prospects for further exploration of this remarkable electrode behavior at higher scan rates, which may lead to potential advancements in the field. Figure 5i–l compare CV curves for the four cases acquired at scan rates of 10 and 100 mV s−1, revealing that the current response at 0.5 V increased sequentially from Case 1 to Case 4 at a scan rate of 10 mV s−1. In Cases 1–4, currents of 20.1, 24.5, 32.6, and 41.4 mA, respectively, were generated at 0.5 V and 100 mV s−1. Interestingly, this increasing trend in current is attributable to the additional electrochemically active sites provided by the nitrogen in PVP and sodium. The ability of nitrogen and sodium to increase the electrode conductivity is equally substantial. It represents a pivotal finding of the present study.

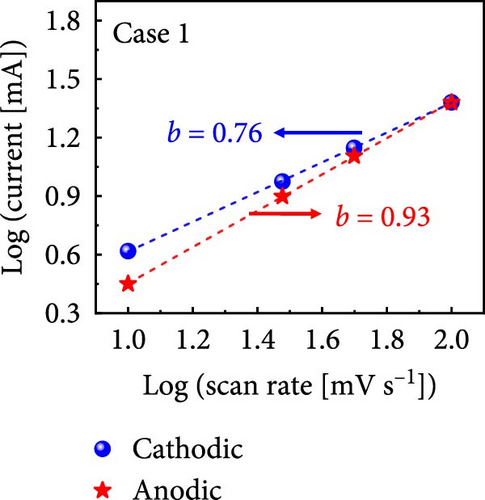
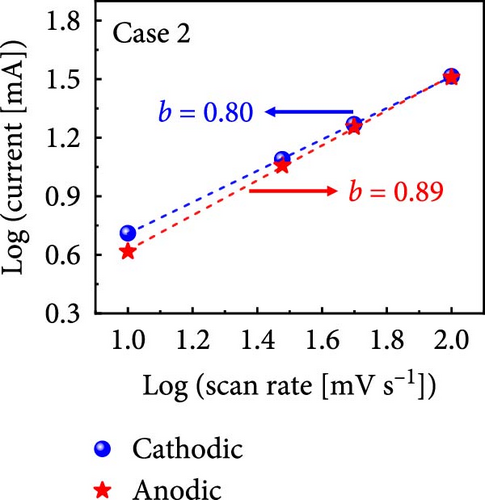
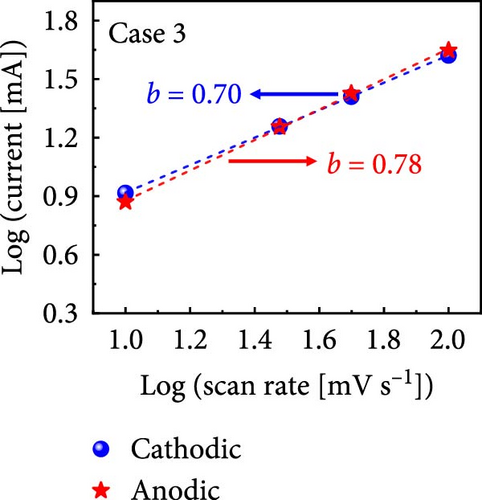
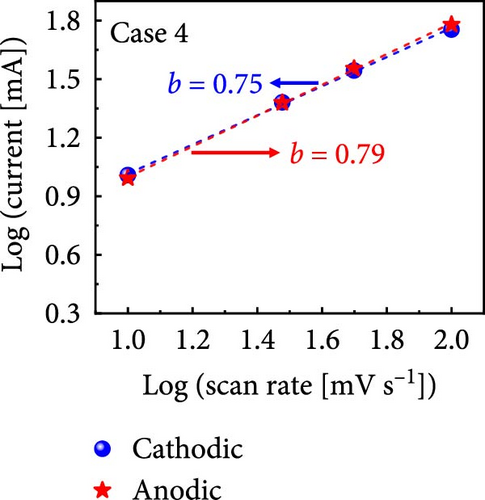
The values of parameter b were determined from the CV curves acquired at various scan rates to investigate the energy storage behavior of the electrodes. A b value of 0.5 implies battery-like behavior, while a value of 1.0 indicates ideal capacitor behavior. Cases 1–4 exhibited b values between 0.5 and 1.0 (Figure 5m–p), indicating excellent pseudocapacitive characteristics. We analyzed the current in CV curves recorded at scan rates of 10, 30, 50, and 100 mV s−1 using the equation: i (ν) = k1ν + k2ν1/2 to separate the pseudocapacitive current from the electric double-layer (EDL) current. Supporting Information 1: Figure S7 shows that Case 4 demonstrates a more substantial contribution from the pseudocapacitive current than Case 1 at the same scan rate, highlighting the importance of N and Na doping in increasing the number of Faradaic active sites. The pseudocapacitive current contribution in Case 4 decreased from 80.5% to 57.0% as the scan rate increased from 10 to 100 mV s−1. In contrast, the corresponding EDL current contribution increased from 19.5% to 43.0%. This change was attributable to the different Faradaic reaction rates of the electrolyte ions and active materials at different scan rates. Electrolyte ions diffused slowly and in smaller quantities at lower scan rates, leading to slower Faradaic reactions. Conversely, more electrolyte ions approached the surface of the active material at higher scan rates, resulting in faster Faradaic reactions. These findings have implications for future research and applications in the materials science and electrochemistry fields.
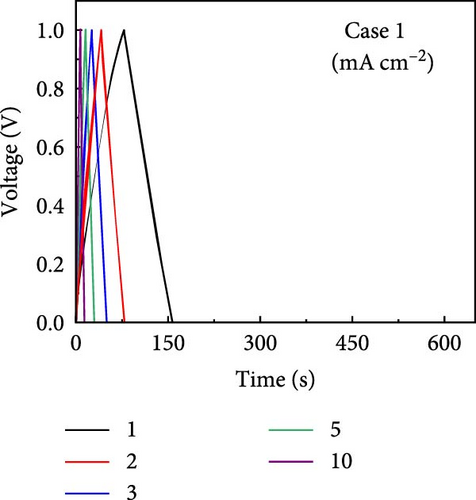
GCD profiles of Cases 1–4 were acquired at various current densities, with significant implications for practical applications. Figure 6a–d shows nearly symmetrical triangular GCD profiles for all four cases, indicating reversible ion-adsorption/desorption processes and efficient ion transfer at the electrode/electrolyte interface. Figure 6e displays the GCD profiles of the four cases at a current density of 1 mA cm−2. Notably, Case 1 exhibited the weakest electrochemical performance. In contrast, the N introduced by adding PVP enhanced the energy storage capability of Case 2. The introduction of Na (Case 3) resulted in a pronounced improvement in electrochemical performance, highlighting this additive’s potential. Case 4 exhibited the best electrochemical performance due to the synergy between C, Co, N, and Na, which has significant implications for practical applications. Figure 6f plots the capacitance as a function of the current density for Cases 1–4, which exhibit maximum areal capacitances of 0.32, 0.48, 0.79, and 1.13 F cm−2, respectively. Meanwhile, at the same current density of 1 mA cm−2, the corresponding specific capacitances were estimated to be 55.4, 83.5, 137, and 194.5 F g−1, respectively. The capacitance retentions for Cases 1–4 at 1–10 mA cm−2 were estimated to be 83%, 79%, 72%, and 77%, respectively, indicating the superior current rate capability of these electrodes [41, 42].
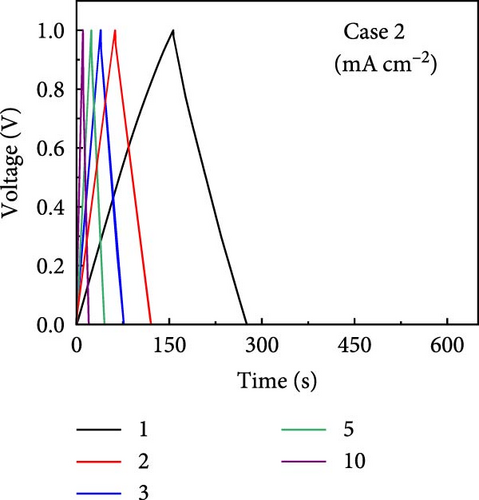
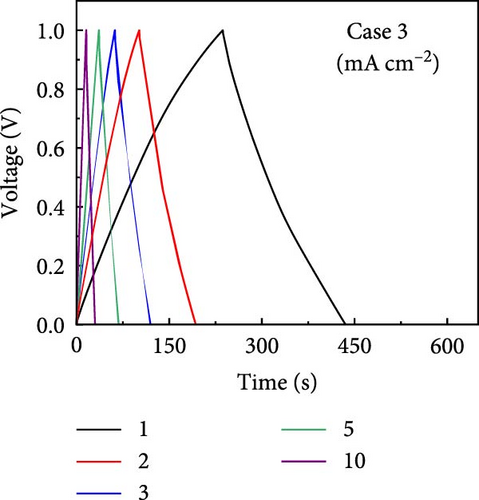
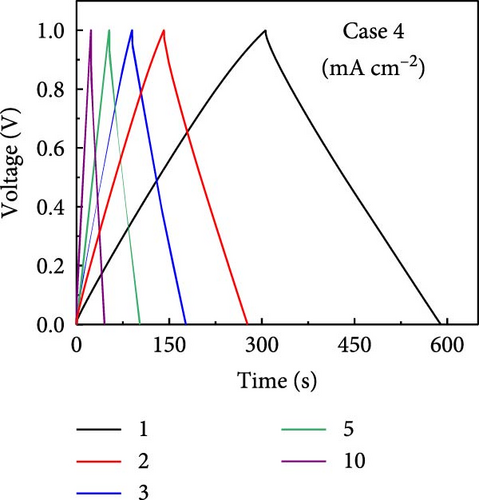
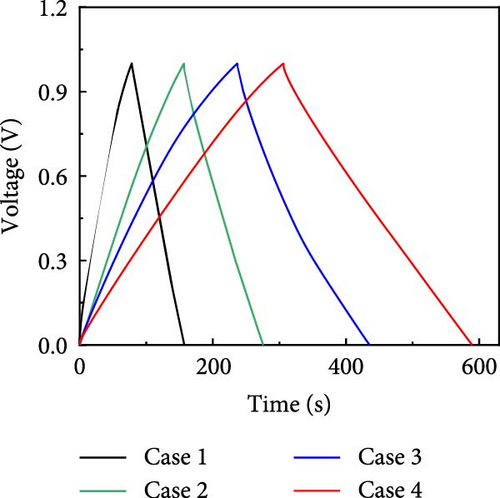
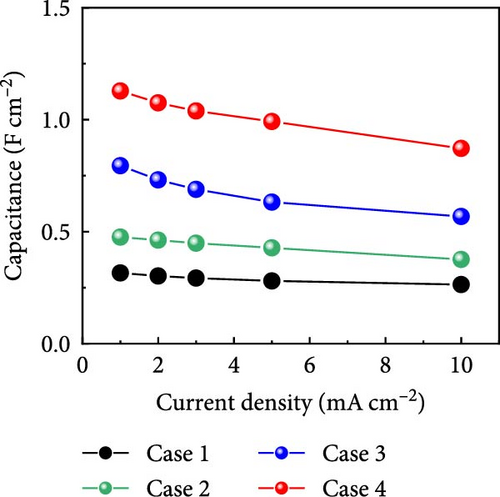
The increase in the areal capacitance from Cases 1 to 4 could be attributed to the reduction in the fiber diameter caused by adding PVP and NaCl to the precursor solution during electrospinning. Adding both PVP and NaCl further decreased the fiber diameter, as indicated by the SEM images in Figure 2. PVP played a crucial role in modifying the viscosity of the precursor solution, resulting in finer fibers. Moreover, NaCl increased the electrical conductivity of the solution, primarily through its dissociation into ions, Na+ and Cl−. Therefore, reducing the fiber diameter increases the availability of active sites on the electrode surface, increases the interactions between the electrode and electrolyte, and improves electrochemical performance. The electrochemically active surface area (ECSA) was determined using CV curves within the voltage range of −0.1 to −0.25 V (Supporting Information 1: Figure S8). This analysis led to double-layer capacitances (Cdl) of 55.0, 63.5, 72.1, and 80.3 F g−1 for Cases 1–4, respectively (Supporting Information 1: Figure S9). Using the formula ECSA = geometrical area of the electrode (1 cm2) × (Cdl/Cs), the ECSAs were calculated to be 137.5, 158.7, 180.3, and 200.8 m2 g−1 for Cases 1–4, respectively (Supporting Information 1: Figure S9). The substantially higher ECSA values for Cases 2–4 compared with that for Case 1 underscores the contribution of both additives. Their combined effects optimized the morphology of the fibers. They enhanced the ionic and electronic transfer characteristics, leading to superior electrochemical performance. The ECSA results indicate the material composition and processing conditions required to design effective electrode materials for energy storage applications.
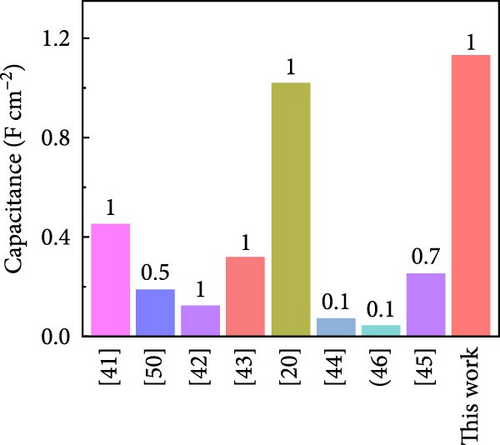
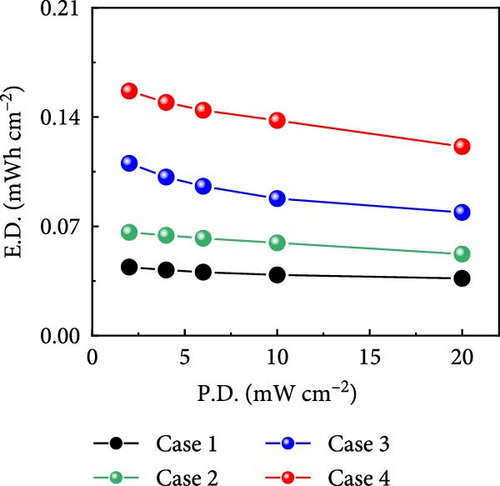
Figure 6g shows that Case 4 exhibits a higher specific capacitance than previously reported Co- and CNF-based electrode materials [43, 44], which has significant implications for the development of high-performance electrode materials; the electrochemical properties reported in similar studies are listed in Table 1. The commercial supercapacitors offered by Nippon Chemi-Con (DKA series) with a potential window of 15 V produced a capacitance of 840 mF cm−2 [50]. Furthermore, the comparison of the gravimetric capacitances of recently reported devices indicates the superior charge storage capability demonstrated by Case 4 (Table S2). In addition, the Ragone plot in Figure 6h shows that for Cases 1–4, energy densities of 0.044, 0.066, 0.110, and 0.157 mW cm−2, respectively, were produced at a power density of 2 mW cm−2. Notably, Case 4 retained over 77% of its energy density as the power density increased from 2 to 20 mW cm−2, which showcased its excellent rate capability and further highlighted the practical relevance of this study.
| Electrode materials | Electrolyte | Current density (mA cm−2) | Areal capacitance (mF cm−2) | Power density (mW cm−2) |
Energy density (μWh cm−2) |
Capacitance retention (%) | Number of cycles | References |
|---|---|---|---|---|---|---|---|---|
| CNTF/ZCO | PVA/LiCl | 1 | 450.7 | 1.8 | 50.8 | 90.6 | 10,000 | [43] |
| Co-TiN@HC-2/CC | 1 M KOH | 0.5 | 189 | — | — | 70 | 1000 | [45] |
| Co3O4/CB//GP | 6 M KOH | 1 | 124 | 1.6 | 44.0 | ≳100 | 1000 | [46] |
| 3D-GCNFs | 6 M KOH | 1 | 318 | — | — | 98.5 | 5000 | [47] |
| C/Co-CoOx/Mn-CNF | 6 M KOH | 1 | 1018 | 2 | 140 | 110 | 10,000 | [20] |
| Co3O4-NLIG-20 | 1 M KOH | 0.1 | 72 | 0.2 | 10.0 | ≳70 | 5000 | [48] |
| Ni-Co-10 | 3 M KOH | 0.71 | 252 | — | — | 91 | 1000 | [49] |
| CoMoO4@CNF | 6 M KOH | 0.1 | 1199 | 0.2 | 166.5 | 100 | 30,000 | [26] |
| CoOx@CNF | 6 M KOH | 0.1 | 624 | 0.2 | 86.8 | 94 | 30,000 | [21] |
| Case 4 | 6 M KOH | 1 | 1130 | 2 | 157 | 96.2 | 10,000 | Present |
- Abbreviations: CNF, carbon nanofiber; Co, cobalt; CoO, cobalt oxide.
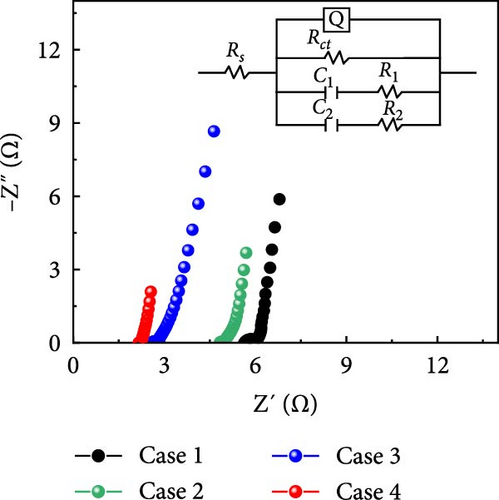
Nyquist plots for Cases 1–4 are displayed in Figure 6i. The intersection between the curve and the x-axis at high frequency yielded the solution resistance (Rs). Remarkably, the Rs value decreased from Cases 1 to 4. A closer examination of the Nyquist plots reveals characteristic semicircular patterns in the high-to-mid frequency range (Supporting Information 1: Figure S10), the diameters of which are indicated by the charge-transfer resistances (Rct) of the electrodes. A Randles equivalent circuit was fitted using ZSimDemo, which revealed Rs values of 5.6, 4.8, 2.6, and 2.1 Ω for Cases 1–4, respectively. The corresponding Rct values were 0.43, 0.1, 0.2, and 0.1 Ω, respectively, emphasizing the impact of doping the electrodes with N and Na. The lower Rs and Rct values of Case 4 compared with those of the other cases confirmed that the three-dimensional network of composite fibers delivered faster ion and electron transfer. The increased ECSA enhanced the performance of these electrochemical systems. Specifically, the larger ECSA promoted the interactions between the electrode and electrolyte, boosting ion accessibility and mobility. This, in turn, decreased the length of ion transport pathways and increased the ion concentration near the electrode, thus enhancing ion movement. Furthermore, the additional active sites accelerated the reaction kinetics, thereby making both electron and ion transfer more efficient.
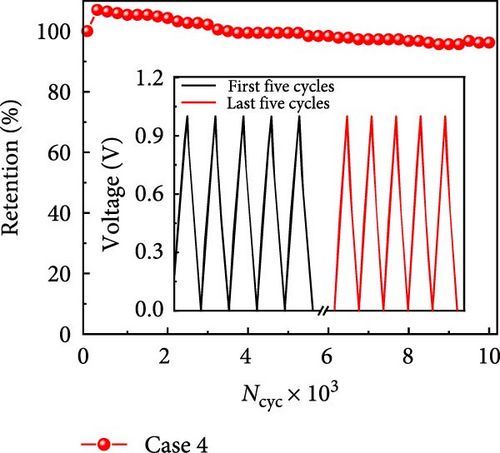
Next, we investigated the electrochemical stability of Case 4 by subjecting it to long-term cycling at 5 mA cm−2. The capacitance retention was observed to initially increase by more than 100% before stabilizing, which was consistent with the gradual but substantial activation of the electrode surface. Case 4 maintained a capacitance retention rate of 96.2% after 10,000 cycles (Figure 6j). The GCD profiles of the last five cycles were similar to those of the first five cycles (inset Figure 6j). SEM images of Case 4 captured at different magnifications (Supporting Information 1: Figure S11) indicate that the surface morphology of the CNFs closely resembles their original structure (Figure 2d) even after undergoing 10,000 GCD cycles. This indicates the exceptional cycling stability exhibited by Case 4, with no apparent changes in the fiber morphology, demonstrating its suitability for applications requiring long-term steadfast performance.
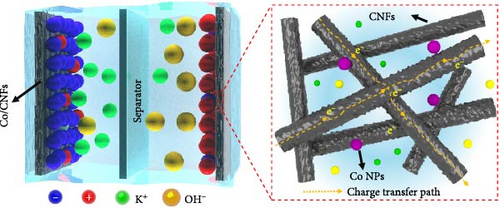
Developing electrode materials that integrate dual charge storage mechanisms, namely, charge adsorption/desorption (electric double-layer capacitance, EDLC) and Faraday redox reactions (pseudocapacitance), presents challenges for supercapacitors using aqueous electrolytes, particularly in achieving high energy density. Composite supercapacitors effectively combine capacitive and pseudocapacitive characteristics, considerably enhancing the overall energy storage performance. This enhancement is attributed to the synergistic effect of the fast charge–discharge characteristics of EDLC, complementing the high energy density associated with pseudocapacitance from carbon and CoOx. Advancements in electrode materials and a deeper understanding of these charge storage mechanisms are crucial for further improving the efficiency and performance of supercapacitors for energy storage applications. The unique structure of ZIF–PAN-derived CoOx/CNF, characterized by an interconnected fiber network, enhanced charge transport and promoted the chemical kinetics during electrochemical reactions (Figure 6k). This refined morphology increased the specific surface area. It optimized the interaction between electrolyte ions and the electrodes, enabling efficient energy storage and conversion processes.
Finally, the practical use of Case 4 supercapacitor as an energy storage component of an electronic device was demonstrated in a light-emitting diode and temperature/humidity sensor. As shown in Figure 1b, two series-connected devices could power a light-emitting diode (Supporting Information 2: Movie S1); furthermore, when formed into an E-shaped planar supercapacitor, the electrodes could power a temperature/humidity sensor, demonstrating the practical applicability of these electrodes in real-world scenarios.
4. Conclusion
This study introduced an effective approach for enhancing the performance of Co/CNFs derived from Co-based ZIF-9 fibers. The composite CNFs were optimized by incorporating PVP and NaCl into the precursor solution during electrospinning, which notably increased both the electrochemical activity and conductivity. Therefore, the Co/CNF composite fibers exhibited enhanced areal capacitances and energy densities, even at high power densities. The optimal sample with the thinnest fibers delivered energy and power densities of 0.157 mWh cm−2 and 2 mW cm−2, respectively. The electrochemical performance of the composite highlighted its potential as a high-power, high-energy supercapacitor. These findings underscored the potential of the proposed method for developing high-performance supercapacitors and integrating advanced materials in energy storage applications.
Conflicts of Interest
The authors declare no conflicts of interest.
Author Contributions
Hao Gao: writing–original draft, visualization, methodology, investigation. Xinyue Cheng: writing–review and editing, formal analysis, conceptualization. Bhavana Joshi: writing–review and editing, software, formal analysis. Edmund Samuel and Ali Aldalbahi: validation, investigation. Jian Zhang: formal analysis, data curation. Govindasami Periyasami: data curation. Hae-Seok Lee: project administration, funding acquisition. Qufu Wei: supervision, resources. Sam S. Yoon: writing–review and editing, supervision, project administration. Hao Gao and Xinyue Cheng contributed equally to this work.
Funding
This work was supported by the National Research Foundation of Korea (NRF) grant funded by the Korea Government (MSIT) (NRF-2020R1A5A1018153 and 2022M3J1A106422611) and also by China Scholarship Council (CSC) grants 202208320110 and 202306790065. The authors acknowledge King Saud University, Riyadh, Saudi Arabia, for funding this work through researchers supporting project number (RSP2025R30). This research was supported by the BK21 FOUR (Fostering Outstanding Universities for Research), funded by the Ministry of Education (MOE, Korea) and the National Research Foundation of Korea (NRF) (No: 5199990314245).
Supporting Information
Additional supporting information can be found online in the Supporting Information section.
Open Research
Data Availability Statement
The data that support the findings of this study are available upon request from the corresponding author.


