Techno-Economic Design of a Hybrid Photovoltaic–Wind System for a Residential Microgrid Considering Uncertainties Using Dynamic Parameters Bald Eagle Algorithm
Abstract
This paper presents a probabilistic cost-based model for grid-connected photovoltaic (PV)–wind hybrid system design, employing probability density functions (PDFs) and Monte Carlo simulation (MCS) to address renewable generation and load demand uncertainties. The proposed scenario-based approach features an innovative objective function incorporating weighted scenario costs, allowing controlled load shedding through energy not supplied (ENS) penalties while enforcing system reliability via a loss of power supply probability (LPSP) constraint. For optimization, we develop a dynamic parameter bald eagle search (DP-BES) algorithm, demonstrating through MATLAB simulations its superior performance over Whale Optimization Algorithm (WOA), Particle Swarm Optimization (PSO), and Grey Wolf Optimization (GWO) methods, with the hybrid PV–wind configuration achieving maximum cost reduction (41%) compared to standalone PV (33%) or wind (25%) systems.
1. Introduction
Renewable energy sources, particularly solar and wind power, have emerged as viable solutions to overcome the limitations of conventional distribution systems in microgrid applications [1]. Building on this potential, their distributed generation architecture offers two key advantages: (1) minimized ohmic losses through localized power production near consumption points and (2) increased feeder line capacity for meeting growing power demands [2]. Beyond these technical benefits, renewable integration demonstrates significant environmental and operational merits, including emission reduction, enhanced reliability during outages, improved voltage regulation, and economic viability, as established in recent studies [3].
Achieving optimal efficiency in hybrid microgrid systems presents complex challenges. The intermittent nature and spatiotemporal variability of renewable sources necessitate careful optimization of both quantity and capacity of generation units [4]. This optimization problem becomes particularly complex when considering three critical factors: power fluctuation profiles, load demand variability, and system reliability constraints [5]. In [6], a multi-objective optimization framework for designing hybrid PV/wind/battery systems that simultaneously addresses reliability, cost, and emissions for both stand-alone and grid-connected operations. The study demonstrates through case studies how this approach enables optimal system configurations balancing technical, economic, and environmental objectives, providing decision-makers with a practical tool for sustainable energy planning. A primary obstacle in this optimization process stems from inherent uncertainties in renewable systems. Photovoltaic (PV)–wind hybrids face three principal uncertainty sources: solar radiation intensity variations, wind speed fluctuations, and unpredictable microgrid load patterns [7]. These uncertainties underscore the need for robust modeling approaches in hybrid microgrid design.
Recent research has employed various methodologies to address these design challenges.
The lightning search algorithm in [8] optimizes PV/wind capacity and placement in grid-connected microgrids, accounting for bus voltage limits and generation uncertainties. Complementing this work, [9] presents a techno-economic analysis of PV–wind-battery systems, evaluating both grid-connected and off-grid configurations against constraints like land availability and resource complementarity. Further advancing the field, [10] combines particle swarm optimization (PSO) with fuzzy logic to enhance voltage stability and reduce power losses in distributed renewable systems. Notable hybrid approaches include the Dragonfly algorithm application in [11] for wind-PV-fuel cell systems with hydrogen storage and the teaching-learning-based optimization in [12] for grid-connected PV-battery configurations. Collectively, these studies demonstrate the critical importance of optimal design in achieving cost-effective, reliable hybrid microgrid systems.
Recent algorithmic developments continue to refine hybrid system optimization. In [13], the optimal capacity of distributed generation resources in a hybrid system is investigated with the aim of reducing costs and meeting reliability constraints, considering the balance between active and reactive power supply and demand. A modified particle swarm optimization (PSO) algorithm is proposed to solve the optimization problem, which has higher accuracy in solving the problem compared to the standard PSO algorithm. In [14], the optimal size of PV and wind resources along with battery storage in a microgrid is determined using the whale algorithm. The objective of the optimal design of the hybrid system is to reduce the operating cost of the microgrid, increase reliability, and reduce pollutant emissions. The broader context is provided by Soudagar et al. [15], which reviews optimization algorithms for both grid-tied and off-grid systems, highlighting cost reduction as a predominant objective. This perspective is reinforced by [16], where hybrid intelligent algorithms evaluate various renewable configurations, confirming that operating cost reductions depend critically on local conditions, load profiles, and precise system design.
In [17] an optimal design for an off-grid hybrid renewable energy system (HRES) in Zanjan, Iran, addressing uncertainties in both energy generation and load demand is proposed. The authors employ a robust optimization framework combining solar PV, wind turbines, and battery storage to minimize costs while ensuring reliability. Results demonstrate the cost-effectiveness and technical feasibility of the proposed HRES configuration for remote areas, offering insights applicable to regions with similar energy challenges. The work highlights the importance of uncertainty-aware planning in renewable energy system. In [18], a bi-level optimization framework is proposed for integrated energy systems, effectively coordinating renewable generation, energy conversion, storage technologies, and demand-side management. The approach enables synergistic operation of diverse energy components while addressing system-wide optimization challenges, demonstrating improved efficiency and cost-effectiveness in complex energy system design. In [19], a stochastic optimization model is developed for rural microgrids, incorporating hybrid hydrogen-electric vehicle storage with V2G capability. The design comprehensively considers multiple uncertainty sources in both renewable generation and load demand, with results showing enhanced system reliability alongside maintained economic viability for off-grid applications. In [20], a multi-level optimization and intelligent control framework is presented for fuel cell-based CHP systems. The hierarchical structure simultaneously addresses design optimization and real-time operational control challenges, significantly improving both system efficiency and dynamic performance across varying operating conditions.
- •
Novel stochastic framework: A scenario-based probabilistic model for hybrid solar-wind system design, integrating cost-weighted scenarios and controlled load shedding to optimize system cost.
- •
Enhanced optimization algorithm: Implementation of the DP-BES algorithm to solve the optimization problem, enhancing convergence and accuracy
- •
Reliability-cost balance: Introduction of the LPSP constraint to prevent excessive load shedding while accounting for ENS penalties, ensuring a trade-off between system reliability and cost-effectiveness.
In the following article, the problem formulation is presented in the second section. This section introduces the structure of the electrical system of the under study residential complex, followed by a description of its component models. Then the proposed objective function and design constraints are presented. The third section briefly introduces the DP-BES algorithm. In the fourth section, the results obtained from simulations conducted in MATLAB are analyzed and discussed in three parts. The article concludes with a summary and suggestions for future research in the fifth section.
2. Problem Formulation
In this article, a residential complex similar to Figure 1 is selected as a home microgrid for conducting studies and simulations. This microgrid is connected to the main power grid via a 20KV/0.4KV distribution transformer and has the capability of continuously exchanging electrical energy with it. Due to the high costs of purchasing and maintaining batteries, no energy storage is implemented in the studied microgrid. In the event of excess power production by the PV and wind sources, the electricity is directly sold to the upstream grid.

2.1. Load Model
2.2. PV Power Model
2.3. Wind Turbine Power Model
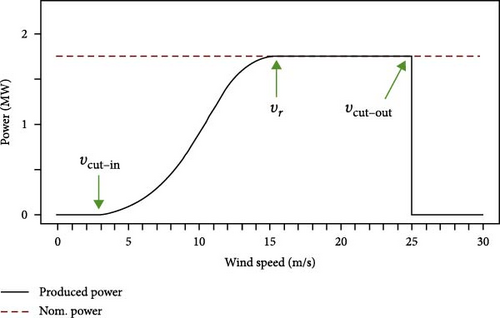
In the simulations conducted in this article, 1-kilowatt vertical-axis wind turbines were used. The area required for each turbine is ~3.14 square meters. The cut-in speed, cut-out speed, and rated speed for the turbine are 3, 25, and 11 m/s.
2.4. Uncertainties Modeling
The MCS technique can be applied to model and assess uncertainties in the optimal design of hybrid systems. As a probabilistic approach, MCS predicts the behavior of microgrid components. Steps for uncertainty calculation using the MCS method are:
Step 1: Establish the Mathematical Model of the Measurement System
Define the mathematical relationship between the output measurement quantity (Y) and the influencing input quantities (X1, X2, …, Xₙ).
Step 2: Assign PDFs to Input Quantities
Determine the appropriate PDFs for each input quantity (Xi), considering any dependencies or correlations between them.
- •
For each input quantity (Xi), generate a large number (M) of random values based on their respective PDFs.
- •
Input these random values into the mathematical model to compute corresponding output values (Y).
- •
Using the resulting Y values, derive the PDF of the output quantity.
Step 4: Determine the Measurement System Uncertainty
- •
The mathematical expectation (mean) of Y (estimated value).
- •
The standard deviation of Y (standard uncertainty).
- •
The confidence interval for Y at a specified probability level.
2.5. Objective Function and Constraints
3. DP-BES
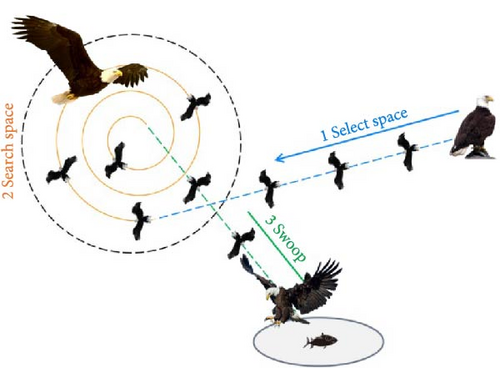
Inspired by the hunting strategies of bald eagles, the BES algorithm is a type of optimization technique that relies on populations. Bald eagles, known for their remarkable vision, can spot fish from afar while soaring at high altitudes. Despite the challenges of hunting from such a distance, they can strategically choose areas teeming with prey and plan their attack accordingly. Figure 3 showcases bald eagles in action during their hunt [25].
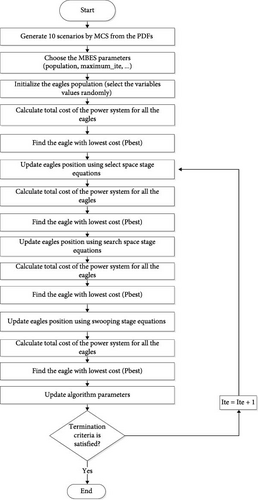
The algorithm determines the best values for α, ψ, and R in each iteration by considering several factors. αbest, ψbest, and Rbest represent the best values found for these parameters so far (up to iteration ite), αmin, ψmin, and Rmin define the minimum allowed values, ensuring they don’t fall below a certain threshold. Similarly, αmax, ψmax, and Rmax set the upper limit for each parameter. By considering these factors, the algorithm maintains a balance between exploring new areas and focusing on promising areas throughout the optimization process. Figure 4 illustrates the flowchart of this proposed DP-BES algorithm.
4. Simulation Results Analysis and Discussion
The simulation results are presented in three phases. In the first phase, the performance of the proposed DP-BES algorithm was evaluated through benchmark problem solutions and comparative analysis with other optimization algorithms. The second phase of simulations focused on optimal hybrid system design implementation using the DP-BES algorithm. This section aims to assess the performance of the proposed algorithm for hybrid system design through a comparison with the findings of the reference study. Finally, in the third section, the optimal design of the hybrid system using the proposed model in this paper has been carried out by the DP-BES algorithm and other algorithms. The simulations were conducted using MATLAB 2023 on an Acer laptop with an Intel Core i5-6200U CPU (2.3 GHz) and 8 GB of DDR3 RAM.
4.1. The DP-BES Performance Evaluation
The current analysis examines the computational efficacy of the DP-BES optimization technique through systematic evaluation using 10 benchmark functions, as specified in Table 1. These test functions have been carefully selected to represent varying levels of computational complexity: Functions f1 through f4 represent unimodal problems, f5 to f7 constitute multimodal challenges, while f8–f10 present fixed-dimension multimodal cases [26]. This comprehensive testing approach enables rigorous evaluation of the algorithm’s problem-solving capabilities, particularly in terms of solution precision and optimization performance across different function types.
| Function | Size | Constraints | Minimum value |
|---|---|---|---|
| 30 | [−100 100] | 0 | |
| 30 | [−10 10] | 0 | |
| 30 | [−100 100] | 0 | |
| f4(x) = maxi{|xi|, 1 ≤ i ≤ n} | 30 | [−100 100] | 0 |
| 30 | [−5.12 5.12] | 0 | |
| 30 | [−32 32] | 0 | |
| 30 | [−600 600] | 0 | |
| 4 | [0 10] | −10.1532 | |
| 4 | [0 10] | −10.4028 | |
| 4 | [0 10] | −10.5363 |
The computational performance metrics of the proposed DP-BES algorithm are quantitatively compared with three established metaheuristics in Table 2. The presented data includes statistical measures (mean and standard deviation) derived from 20 independent executions across benchmark functions. The comparative algorithms comprise: (i) PSO, (ii) Whale Optimization Algorithm (WOA), and (iii) the Adaptive Dynamic Self-Learning Grey Wolf Optimization variant (ASGWO) [26].
| PSO | WOA | ASGWO | DP-BES | ||||||||
|---|---|---|---|---|---|---|---|---|---|---|---|
| Mean | Std | Mean | Std | Mean | Std | Mean | Std | ||||
| f1 | 5.86 | 5.32 | — | 5.50e–07 | 1.72e–06 | — | 0 | 0 | — | 0 | 0 |
| f2 | 9.31 | 8.56 | — | 2.57e–10 | 7.13e–10 | — | 9.489e–243 | 6.68e–243 | — | 4.609e–132 | 5.55e–133 |
| f3 | 22.94 | 8.56 | — | 0.02275 | 0.0386 | — | 0 | 0 | — | 0 | 0 |
| f4 | 1.28 | 0.40 | — | 0.01333 | 0.0266 | — | 1.185e–201 | 6.19e–201 | — | 1.176e–143 | 5.85e–144 |
| f5 | 186.5 | 22.68 | — | 9.399e–12 | 2.839e–11 | — | 0 | 0 | — | 0 | 0 |
| f6 | 3.05 | 0.47 | — | 1.154e–08 | 3.020e–08 | — | 1.141e–14 | 3.103e–15 | — | 1.1003e–14 | 1.731e–15 |
| f7 | 0.70 | 0.17 | — | 2.285e–16 | 4.056e–13 | — | 0 | 0 | — | 0 | 0 |
| f8 | −8.33 | 1.75 | — | −2.4141 | 2.0658 | — | −9.22813 | 2.01878 | — | −10.3942 | 1.32954 |
| f9 | −6.19 | 1.91 | — | −1.9880 | 1.4711 | — | −9.0779 | 3.07231 | — | −10.7079 | 2.2599 |
| f10 | −7.15 | 1.37 | — | −1.81628 | 1.6834 | — | −10.2873 | 1.666e–05 | — | −10.6494 | 1.609e–05 |
The experimental results conclusively establish the enhanced optimization capability of the proposed DP-BES algorithm relative to conventional approaches including PSO, WOA, and ASGWO. Statistical analysis reveals DP-BES’s superior convergence characteristics, as evidenced by consistently minimized objective function values (mean) and reduced solution variability (standard deviation) across all benchmark evaluations. These findings substantiate DP-BES’s improved solution quality and algorithmic stability, suggesting its potential as a robust optimization tool for diverse engineering applications. The algorithm’s demonstrated performance advantages stem from its unique dynamic parameter adaptation mechanism, which enables more efficient exploration–exploitation balance throughout the search process.
4.2. Optimal Hybrid System Design
This section evaluates the performance of the proposed algorithm in designing a grid-connected solar-wind hybrid system through comparative analysis with the Modified Dragonfly Algorithm (MDA) [27, 28]. The optimization results of the hybrid system configuration are presented in Table 3.
| Algorithm | PV panel | WT | Energy purchased (kWh) | Energy cost ($) | Total cost ($) |
|---|---|---|---|---|---|
| MDA | 107 | 47 | 39,168 | 17,538 | 26,465 |
| DP-BES | 118 | 42 | 36,467 | 14,708 | 25,907 |
The comparative performance analysis between the MDA and the proposed DP-BES algorithm for hybrid PV-WT system design reveals significant cost and efficiency improvements. DP-BES favors a balanced configuration (42 WT units and 118 PV panels) compared to MDA’s 47 WT units and 107 PV panels, suggesting superior resource allocation. The DP-BES-optimized system achieves a lower total cost of 25,907 and substantially reduces energy costs to 14,708. This cost efficiency is achieved despite requiring less grid-purchased energy (36,467 vs. 39,168 kWh), demonstrating better renewable utilization. These results validate DP-BES as a more effective optimizer for hybrid renewable systems.
4.3. Optimal Design of the Proposed Hybrid System Model
The hybrid system simulation required collection of essential data, including network load variations, wind speed patterns, and solar radiation intensity in the study area. This data served as the basis for technical and economic design optimization through various algorithms. Alongside the proposed DP-BES algorithm, three additional well-established optimization techniques were implemented: PSO, WOA, and GWO, complemented by the standard BES algorithm. Table 4 summarizes the parameters used for each algorithm. Due to the stochastic nature of metaheuristic optimization algorithms, performance evaluation through multiple optimization cycles is essential. In this study, each algorithm was executed over multiple independent runs to assess its accuracy and robustness. The statistical results, including mean and standard deviation values, are reported to provide a comprehensive evaluation of algorithmic stability and convergence behavior. The statistical results, including mean and standard deviation values, are reported to provide a comprehensive evaluation of algorithmic stability and convergence behavior. Notably, all algorithms utilized a population size of 100 and a maximum of 50 iterations. Also, the optimization algorithms were executed 20 times, with the best-performing solution being reported in the results.
| WOA | Population | Iteration | Σ | ω | µ |
| 100 | 50 | 0.65 | 0.8 | 0.03 | |
| PSO | Population | Iteration | C1 = C2 | ωmin | ωmax |
| 100 | 50 | 2 | 0.7 | 0.95 | |
| GWO | Population | Iteration | A | β | — |
| 100 | 50 | 0.7 | 0.06 | — | |
| BES | Population | Iteration | A | ψ | R |
| 100 | 50 | 1.5 | 6 | 1.2 | |
| DP-BES | Population | Iteration | A | ψ | R |
| 100 | 50 | 1.8 | 8 | 1.5 |
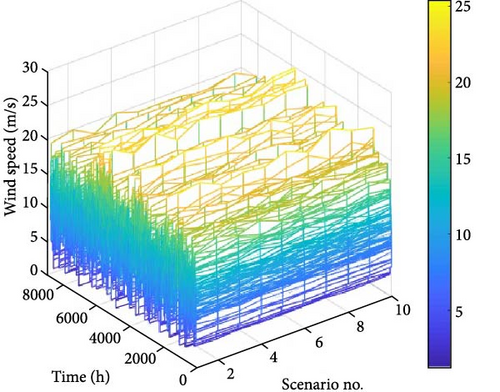
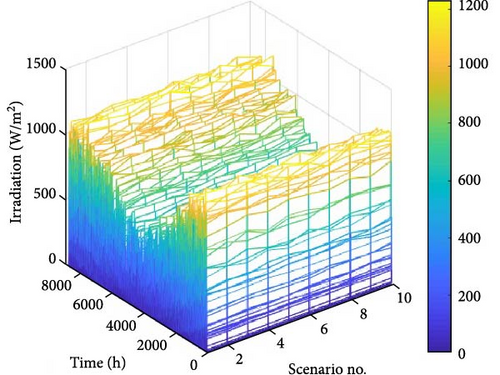
Figure 5 depicts the hourly variations in solar radiation intensity and wind speed throughout a year (8760 h) for 10 scenarios generated using MCS. These scenarios represent the uncertainties associated with renewable energy sources. The average wind speed in the study area is ~14.4 m/s, while the average solar radiation intensity is around 470 w/m2.
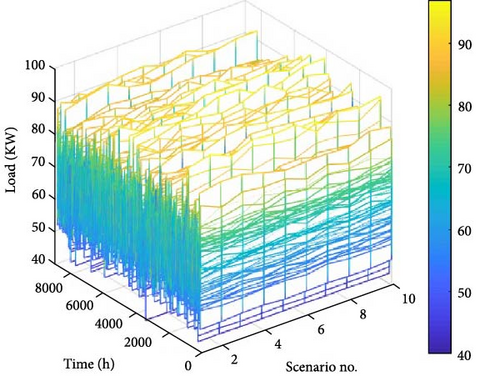
The energy consumption in the considered residential area over a 1-year period for 10 scenarios selected by MCS is shown in Figure 6. The normal PDF is used to generate these scenarios. The average electricity consumption in this area is considered to be 75 kW and its standard deviation is 20.
Initial simulations, assuming no hybrid system, estimated an annual electricity consumption of 42,714 kilowatt-hours from the national grid, resulting in an energy cost of $18,673. To assess the impact of renewable energy integration, three sections were investigated: optimizing a PV (solar) system (Section I), optimizing a wind energy system (Section II), and implementing a hybrid optimal design of solar and wind systems (Section III) for the residential microgrid.
4.4. Section I (PV System)
In the first part of the simulations, only the installation of PV panels in the residential microgrid under study is considered. Figure 7 presents the convergence behavior of the optimization algorithms.
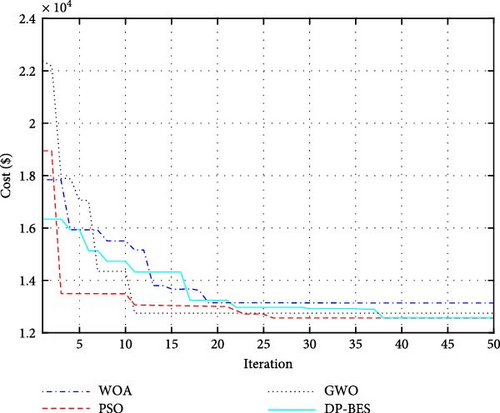
As observed, the DP-BES algorithm achieved the lowest cost ($12,563) after only 38 iterations, demonstrating superior efficiency compared to other algorithms. While PSO algorithm also reached $12,563, it required 26 iterations. The WOA algorithm converged to $13,135 after 19 iterations, and the GWO algorithm achieved $12,748 after 11 iterations. Both PSO and GWO exhibited slower convergence compared to DP-BES. The optimization results are accumulated in Table 5.
| Algorithm | Number of PV panels | PV system cost ($) | Energy purchased from grid (kWh) | Energy purchase cost ($) | ENS penalty ($) | Total cost ($) |
|---|---|---|---|---|---|---|
| WOA | 83 | 1707 | 33,541 | 10,589 | 839 | 13,135 |
| PSO | 86 | 1857 | 31,827 | 9843 | 863 | 12,563 |
| GWO | 91 | 2295 | 31,088 | 9670 | 783 | 12,748 |
| BES | 88 | 1900 | 32,500 | 10,100 | 850 | 12,650 |
| DP-BES | 86 | 1857 | 31,827 | 9843 | 863 | 12,563 |
The optimization algorithms identified distinct configurations for the PV system. Both PSO and DP-BES recommended installing 87 panels, incurring a cost of $1857. In contrast, WOA and GWO suggested 83 and 91 panels, with costs of $1707 and $2295. Following PV system installation, the annual energy purchased from the main grid varies depending on the chosen configuration. The PSO and DP-BES solution, with 86 panels, is estimated to require 31,827 kWh per year, resulting in an energy cost of $9843. The WOA solution necessitates slightly higher grid purchases (33,541 kWh) and a corresponding annual cost of $10,589. While the GWO solution achieves the lowest annual grid purchase (31,088 kWh), it translates to a slightly higher cost ($9670) due to the increased panel requirement.
4.5. Section II (Wind System)
Building upon the solar simulations, the next phase examined wind-based systems for the microgrid. Identical to the previous scenario, four optimization algorithms (WOA, PSO, GWO, and DP-BES) were employed to identify the optimal design. Figure 8 depicts the convergence behavior of these algorithms. The results showcase the effectiveness of DP-BES, achieving the lowest final objective function value of $14,127. PSO also performed well at $14,938. While WOA and GWO obtained results of $17,318 and $1493, DP-BES demonstrated superior optimization capability in this wind-based scenario.
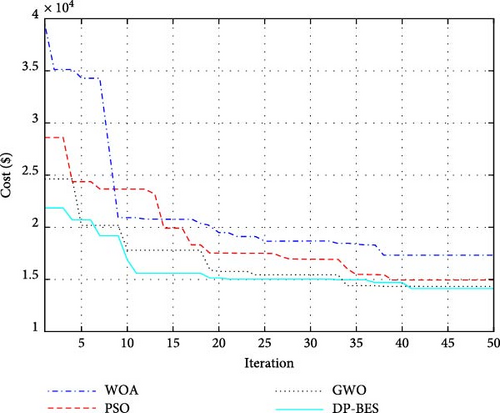
Table 6 summarizes the results obtained from the optimization by metaheuristic algorithms for the optimal design of the wind system for the residential microgrid under study. It is noteworthy that the LPSP in this scenario was also considered to be 5%.
| Algorithm | Number of WT | WT system cost ($) | Energy purchased from grid (kWh) | Energy purchase cost ($) | ENS penalty ($) | Total cost ($) |
|---|---|---|---|---|---|---|
| WOA | 63 | 1756 | 35,950 | 12,601 | 961 | 15,318 |
| PSO | 70 | 1938 | 35,498 | 12,074 | 926 | 14,938 |
| GWO | 75 | 1997 | 34,190 | 11,424 | 909 | 14,330 |
| BES | 76 | 2000 | 34,800 | 11,500 | 870 | 14,250 |
| DP-BES | 78 | 2078 | 34,355 | 11,201 | 848 | 14,127 |
The optimization algorithms identified varying configurations for the wind system. WOA, PSO, and GWO suggested installing 63, 70, and 75 wind turbines, with corresponding costs of $1756, $1938, and $1997 (including purchase, implementation, and maintenance). The proposed DP-BES algorithm achieved a lower system cost despite recommending a higher number of turbines (78 units at $2078). This is likely due to the optimization process prioritizing factors beyond just initial purchase cost. In terms of energy consumption, the 78-turbine solution from DP-BES requires slightly more energy from the main grid (34,355 kWh) compared to other configurations. The overall cost, including grid purchases, wind system costs, and a potential penalty for unmet energy, is minimized by DP-BES, reaching $14,312. This highlights the importance of considering all cost factors during optimization.
4.6. Section III (Hybrid System)
The final simulations explored the design of a hybrid PV–wind system under uncertainty conditions (LPSP < 5%). Similar to previous scenarios, all four optimization algorithms were employed. Figure 9 depicts their convergence behavior. DP-BES achieved the lowest final objective function value ($11,140), demonstrating its effectiveness in this complex scenario. PSO followed closely at $11,959. While WOA and GWO obtained results of $11,974 and $11,645, DP-BES again outperformed them.
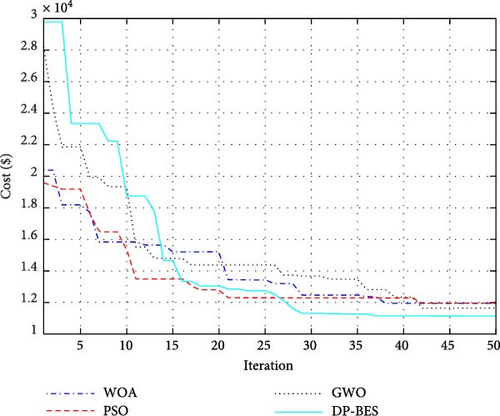
The results obtained from optimization in the third scenario indicate a considerable reduction in the energy supply cost in the residential microgrid compared to the previous two scenarios. Notably, Table 7 shows significant cost savings achieved through the hybrid PV-WT system design.
| Algorithm | Number of PV panel | Number of WT | Hybrid system cost ($) | Energy purchased from grid (kWh) | Energy purchase cost ($) | ENS penalty ($) | Total cost ($) |
|---|---|---|---|---|---|---|---|
| WOA | 37 | 36 | 1606 | 27,870 | 9667 | 701 | 11,974 |
| PSO | 40 | 37 | 1563 | 28,626 | 9701 | 695 | 11,959 |
| GWO | 46 | 33 | 1559 | 27,371 | 9410 | 676 | 11,645 |
| BES | 50 | 30 | 1500 | 27,000 | 9200 | 670 | 11,200 |
| DP-BES | 53 | 28 | 1433 | 26,601 | 9056 | 651 | 11,140 |
The hybrid PV–wind system design (section III) achieved significant cost reductions compared to individual solar and wind-only systems (sections I and II). As shown in Table 4, the DP-BES-designed system minimizes grid dependance, requiring only 26,601 kWh annually, at a cost of $9056. This is lower than the grid energy needs and costs identified for the WOA, PSO, and GWO algorithms (27,870, 28,626, and 27,371 kWh with $9667, $9701, and $9410). Overall, the hybrid renewable energy approach substantially reduces energy purchase costs and penalties in the microgrid.
4.7. Results Analysis
To evaluate the accuracy of the proposed DP-BES algorithm compared to other algorithms, the cost values were calculated for three simulation scenarios, and the percentage reductions in costs are presented in Table 8.
| Algorithm | Case 1 (only PV) |
Case 2 (only WT) |
Case 3 (PV and WT) |
|---|---|---|---|
| WOA | 32.10 | 20.47 | 38.10 |
| PSO | 35.05 | 22.78 | 38.18 |
| GWO | 34.10 | 25.92 | 39.80 |
| BES | 34.60 | 26.33 | 42.10 |
| DP-BES | 35.05 | 26.97 | 42.41 |
The analysis of optimization algorithms’ performance in reducing hybrid system costs demonstrates that the DP-BES algorithm has achieved superior performance across all scenarios. In the hybrid configuration (PV and WT), DP-BES showed significant advantage with 42.41% cost reduction compared to WOA (38.10%), PSO (38.18%), GWO (39.80%), and BES (42.10%) algorithms. This superiority persists in standalone systems as well, where DP-BES achieved better performance with 26.97% cost reduction in wind-only systems (only WT) and 35.05% in PV-only systems (only PV). Notably, in all cases, DP-BES shows ~0.3% to 0.6% improvement in cost reduction over its base version (BES), confirming the effectiveness of the implemented modifications in this algorithm. Furthermore, result comparisons reveal that hybrid systems (Case 3) demonstrate on average about 15% better cost reduction performance compared to standalone systems. Finally, the results obtained from the optimal designs performed by the proposed DP-BES algorithm in the three scenarios are depicted in Figure 10 as a bar chart.
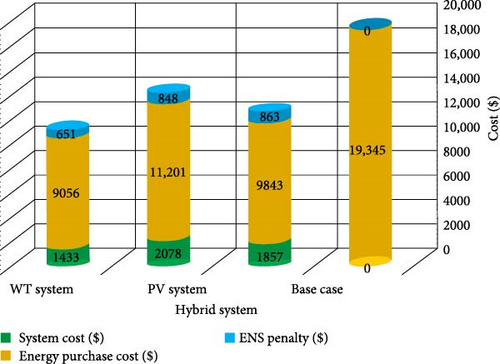
The results obtained from studies and simulations indicate that in the absence of utilizing distributed generation sources in the targeted residential microgrid, the cost of supplying electrical energy will exceed the overall cost in all scenarios. For reducing the costs of supplying electrical energy in this microgrid, it is essential to utilize PV and wind sources. Analysis of the results has shown that the total system cost when using only wind turbines exceeds that of the other two systems. The reason for this may include the high investment and maintenance costs of wind turbines as well as insufficient electricity production due to local wind conditions. The total energy supply cost in the residential microgrid when employing wind turbines has decreased by ~24.78% compared to the conditions where these sources are not utilized. When PV sources are used in the residential microgrid, the energy supply cost has decreased by ~33.41%. The lowest energy supply cost occurs when PV and wind sources simultaneously contribute to supplying part of the required electrical energy. In this case, the energy supply cost has decreased by ~41.35%.
5. Conclusion and Future Work
This paper presents a comprehensive optimization methodology for hybrid PV–wind residential microgrid systems using the novel DP-BES algorithm, demonstrating significant technical and economic improvements over conventional approaches. The research makes several key contributions to the field, beginning with a novel stochastic framework that integrates cost-weighted scenarios with controlled load shedding through a probabilistic model, enabling optimal system design under uncertainty. The developed enhanced optimization algorithm, DP-BES, shows superior convergence and accuracy compared to PSO, WOA, and GWO, achieving remarkable system cost reductions of 41% in hybrid configurations, 33% in PV-only, and 25% in wind-only systems. Furthermore, the study introduces an innovative reliability-cost balance mechanism incorporating LPSP constraints to prevent excessive load shedding while considering ENS penalties, ensuring optimal trade-offs between system reliability and cost-effectiveness. Through comparative analysis across three design scenarios—standalone PV, standalone wind, and hybrid PV-wind—the results consistently demonstrate DP-BES’s superior performance, with the hybrid configuration emerging as the most economically viable solution. These findings not only validate the effectiveness of the proposed methodology but also highlight the substantial economic advantages of renewable integration, particularly through optimized hybrid systems. Looking ahead, future research directions include extending this work to multi-objective optimization considering both economic and environmental factors, along with investigating real-world implementation challenges through case studies. The developed framework establishes a robust foundation for designing cost-effective and reliable HRESs, making a significant contribution to the global transition toward sustainable energy solutions.
Disclosure
All persons who have made substantial contributions to the work reported in the manuscript, but who are not contributors, that is, persons who do not fulfill all the ICMJE authorship criteria, are named in the Acknowledgment and have given me/us their written permission to be named. I/We hereby declare that I/We followed the guidelines provided by ICMJE (https://www.icmje.org/recommendations/browse/roles-and-responsibilities/defining-the-role-of-authors-and-contributors.html) while defining the authors and contributors in the manuscript.
Conflicts of Interest
The authors declare no conflicts of interest.
Author Contributions
Mehrdad Ahmadi Kamarposhti contributed to conceptualization, methodology/study design, software, validation, formal analysis, investigation, resources, data curation, writing – original draft, writing – review and editing, visualization, supervision, project administration. Hassan Shokouhandeh contributed to conceptualization, methodology/study design, validation, formal analysis, resources, data curation, writing – original draft, writing – review and editing, visualization, project administration. Rachid Outbib contributed to conceptualization, methodology/study design, software, validation, formal analysis, resources, data curation, writing – original draft, writing – review and editing, visualization, supervision, project administration. Ilhami Colak contributed to conceptualization, methodology/study design, software, validation, investigation, resources, data curation, writing – original draft, writing – review and editing, supervision, project administration. El Manaa Barhoumi contributed to conceptualization, methodology/study design, software, validation, investigation, resources, data curation, writing – original draft, writing – review and editing, supervision, project administration.
Funding
No funding was received for this manuscript.
Open Research
Data Availability Statement
The data that support the findings of this study are available from the corresponding author upon reasonable request.


