Development and Verification of a Spatial Dynamics Code RESTA-3D for Light Water Reactors
Abstract
A neutronics/thermal-hydraulics (TH) coupled spatial dynamics code, reactor system transient analysis-three dimensional (RESTA-3D), has been developed for both static and transient analysis of large advanced light water reactors (LWRs), with a focus on control rod (CR) ejection accidents. The code is based on a neutron diffusion model, employing the widely used “two-step” strategy in 3D Cartesian coordinates. A polynomial nodal expansion method (NEM) is used to handle spatial variables, while the neutron kinetics solver applies the exponential transformation technique. Additionally, the code integrates a single-channel TH module and a steam table set at 15.5 MPa. The accuracy of the code has been validated against three transient benchmarks: the 3D-LRA benchmark for boiling water reactors (BWRs), the NEACRP 3D benchmark, and the mixed oxide (MOX)/UO2 core benchmark for pressurized water reactors (PWRs). These benchmarks address both static and transient behaviors, and the results have been thoroughly analyzed. The close agreement between the RESTA-3D results and reference data, as well as other codes, confirms its reliability, making it a promising tool for future dynamic analyses of large-scale advanced PWRs.
1. Introduction
Reducing the volume of nuclear waste per unit of energy, extending reactor lifetimes, and achieving deeper burnup are three practical approaches for enhancing the economic competitiveness of existing light water reactors (LWRs), while maintaining nuclear safety [1]. However, these efforts face a range of industry challenges, including fuel clad creep and growth [2], Chalk River unidentified deposits (CRUD) formation, localized corrosion, and power shift [3], among others. These phenomena are expected [4–6], which enable coupled neutronics, thermal-hydraulics (TH), nuclides burnup, thermomechanics, and radiochemistry calculations. During the multiphysical simulations of nuclear reactors, spatial dynamics analysis based on neutronics/TH coupling [7] is a fundamental and crucial aspect [8].
With the continuous advancements in numerical reactor core physics models and state-of-the-art parallel computing, considerable attention has been directed towards integrating the “one-step” strategy for full-core neutron transport with high-fidelity TH models in recent years. In 2010, the U.S. Department of Energy launched the Consortium for the Advanced Simulation of Light Water Reactors (CASL), which resulted in the development of the full-core neutron transport code system MPACT and the TH module CTF, based on the subchannel model. These two tools were integrated to perform fully coupled neutronics/TH simulations for entire reactor cores [1]. The high-precision 3D neutronics/TH coupling code NECP-X/SUBSC [8], developed and validated by Xi’an Jiaotong University, is similar to MPACT/CTF and exhibits comparable accuracy. It includes a neutron transport module based on the one-dimensional (1D) SN method and the 2D method of characteristics (MOC), along with a subchannel TH model. Seoul National University combined the MATRA subchannel TH module with an enhanced version of the neutron transport code DeCART to perform core transient simulations [9]. Compared to computational fluid dynamics (CFD) software, the subchannel TH model is more efficient for neutronics/TH coupling. However, in terms of neutronics, the full-core neutron transport methods (e.g., MOC and SPn based on the finite element method) require large parallel computing resources, and their computational burden remains unacceptable in nuclear engineering practice. Instead, the fast-running, assembly-wise “two-step” approach, which involves fuel assembly homogenization followed by core diffusion, is still widely used in the global nuclear power industry. Recently, Zhang et al. [10] investigated the propagation of uncertainties from the fundamental nuclear library to key reactor startup parameters in CPR1000 with initial fuel loading. These parameters include temperature coefficients, critical boron concentrations, power distributions, and the integral worth of the rod cluster CA (RCCA). The analyses were performed using the “two-step” code system Bamboo-C [10]; Jeon et al. [11] developed the GPU-accelerated code system VANGARD, which integrated the source expansion nodal method (SENM) with a highly parallelized depletion simulation and solution model based on the Chebyshev rational approximation method (CRAM). The performance of the code was evaluated using realistic AP1000 core problems, demonstrating its excellent efficiency and accuracy [11]. Hegyi, Maráczy, and Temesvári [12] conducted transient simulations of xenon behavior in a VVER-type reactor using the enhanced “two-step” code system KARATE, with the results showing good agreement with experimental measurements.
TMSR3D [7] is a 3D spatial dynamics code system specifically designed for molten salt reactors (MSRs). It comprises four modules: (1) TMSR-LINK, a code for producing and functionalizing assembly few group parameters based on the lattice code DRAGON5 [13]; (2) a neutronics model utilizing the standard polynomial nodal expansion method (NEM) [14] for spatial variables and an exponential transformation model for time-dependent term discretization; (3) a time-dependent multichannel TH module for determining core temperature profiles, fuel velocity, and pressure drop distributions in molten salt; and (4) a postprocessing module for data collection, analysis, and visualization [15]. In this study, a simple single-channel module with an integrated steam table was newly developed to enhance the applicability of this code for simulating the dynamic behavior of LWRs. Using this model, together with the NEM neutronics module, a critical boron concentration search model, and a feedback model of macroscopic cross-sections distinct from those in MSRs, a spatial dynamics code reactor system transient analysis-three dimensional (RESTA-3D) was developed for LWR simulations. To validate the accuracy of the RESTA-3D code, three international benchmarks 3D-LRA [7], NEACRP 3D [16], and mixed oxide (MOX)/UO2 core [17] were modeled and simulated, to capture both static and transient behaviors of the benchmark cores. Detailed analyses of these characteristics revealed that the RESTA-3D code can reliably predict the dynamic responses of LWRs.
The structure of this paper is as follows: Section 2 reviews the methodology adopted in the RESTA-3D code. Section 3 presents the simulation results and discussions. Finally, Section 4 concludes the study.
2. Numerical Model and Solution Method
2.1. Brief Description of the Neutronics Model
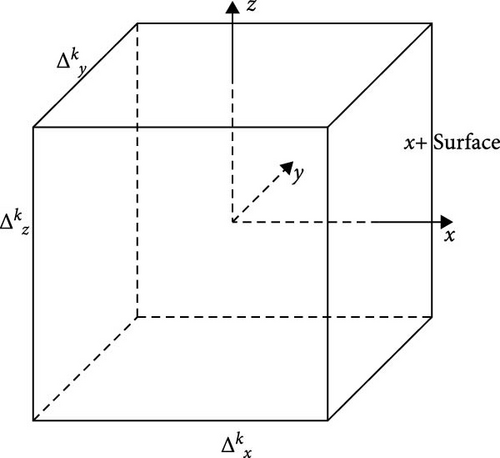
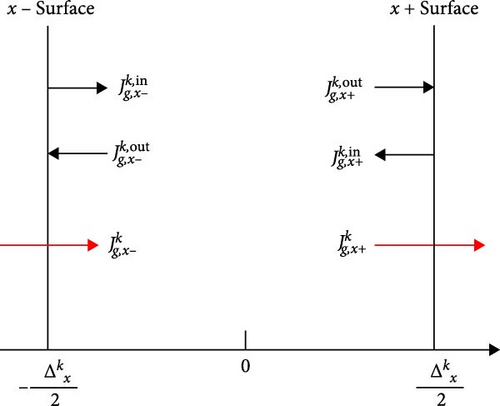
Here, represents the expansion coefficients of the 1D partial fluxes, and the orthogonal Legendre polynomials are chosen as basis functions [14].
The coefficients for the lower-order terms, and , can be determined based on the node-averaged neutron flux , and the incoming/outgoing partial neutron currents across the node boundaries, and , by applying corresponding neutronics boundary conditions at the edges of the nodes. To derive the higher-order coefficients, and , a weighted residual method is applied to Equation (2), ensuring that these terms are systematically obtained.
Here vg represents the average velocity of neutrons (cm⋅s−1) in energy group g; denotes the removal cross-section (cm−1). The index i identifies the DNP group; denotes the DNP concentration (cm−3); indicates the yield of prompt neutrons released in group g, while represents the probability of delayed neutrons decaying from the ith-group DNP and depositing in neutron energy group g; βi refers to the yield of delayed neutrons in group i, with β being the total yield across all groups. Finally, λi is the decay constant (s−1) of delayed neutrons in the ith-group.
The term () represents an intermediate variable in the exponential transformation method (ETM). It, evolves gradually over time, assuming that the exponential transformation factors, (t), are appropriately chosen.
It is important to note that Equation (10) shares a similar structure with the static nodal equation. In this formulation, all source terms, except the neutron fluxes from previous calculations, are updated in each neutronics/TH iteration based on the corresponding core parameters at a given time. Therefore, the static solver remains valid for solving transient problems.
2.2. Single-Channel TH Model
To model and simulate the transient phenomena, such as the reactivity-initiated accident (RIA), for LWRs with TH feedback, a simplified single-channel model has been newly implemented into the RESTA-3D code. This model is characterized by single-phase flow, no cross-flow between channels, constant mass flow rate, and constant pressure, with the steam table set at 15.5 MPa [22].
Subsequently, the coolant temperature and density at each node can be calculated from the steam table by linear interpolation based on the obtained specific enthalpy.

2.3. Coupling Scheme
In Equation (26), the subscript zero denotes the macroscopic cross sections generated at the reference point (ρ0, c0, TF0, and TM0).
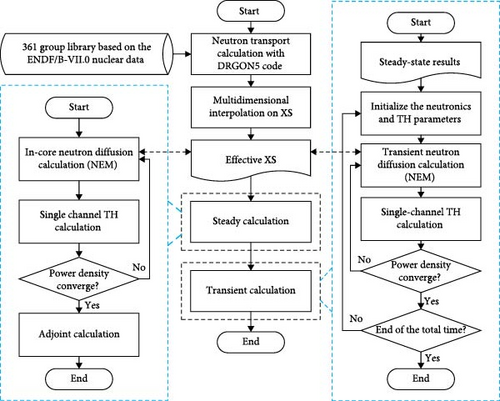
In addition to the abovementioned coupling scheme, RESTA-3D can also handle multidimensional tabular cross-section libraries, where the feedback parameters include boron concentration, moderator density, and core temperature. As shown in Figure 3, during static or transient simulations, the group constants and kinetics parameters are updated either according to Equation (26) or through multidimensional linear surface interpolation. This process accounts for the variation in cross sections caused by control rod (CR) movement during each time step or iteration, thereby, coupling the TH and neutronics modules and considering the local feedback of core variables on group constants and kinetic parameters.
3. Results and Discussion
3.1. 3D-LRA Benchmark
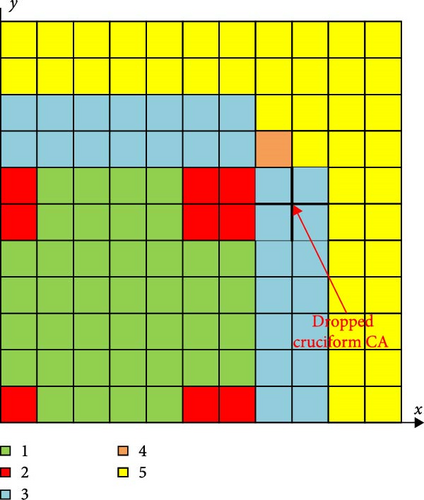
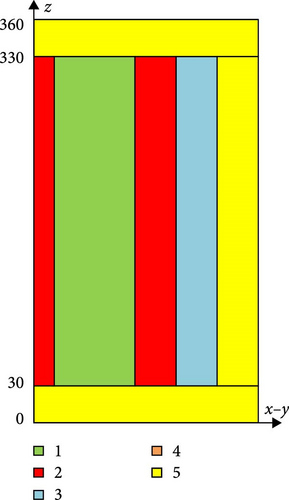
The 3D-LRA benchmark focuses on a prompt supercritical transient scenario, specifically modeling and simulating a cruciform control assembly (CA) drop accident in a boiling water reactor (BWR). This event involves a significant reactivity insertion and a marked negative temperature feedback. As shown in Figure 4, the active core contains four distinct types of fuel assemblies (materials 1, 2, 3, and 4), each measuring 15 cm × 15 cm × 300 cm. The axial and radial reflectors are modeled using material 5, with a width of 15 cm. Neutron energy and DNP are divided into two groups. At the beginning of the transient, the cruciform CA descends from the upper to the lower region of the reactor core over a 2-s period, with a velocity of 150 cm/s. Detailed information on the group constants and kinetic parameters for this problem can be found in the existing literature [25].
The parameters are α1 = 3.83 × 10⁻¹¹ K⋅cm3 and α2 = 3.034 × 10⁻³ K−0.5. t0 denotes the start time, and the original core average temperature is set to 300 K. During the calculation, the initial neutron fluxes are normalized based on a preset power density of 1.0 × 10⁻⁶ W⋅cm−3, and the energy released per fission is taken as 3.204 × 10⁻¹¹ J/fission. The flux–volume weighted method, used to calculate group constants and kinetics parameters in nodes with partially inserted CRs, reduces the CR cusping effect [7]. Additionally, Equation (28) is iteratively solved using the Crank–Nicholson semi-implicit scheme to determine the core-averaged temperature.
Figure 5 compares the power density and core temperature profiles simulated by RESTA-3D with those obtained from the reference code TNGFM [26]. Following the introduction of the perturbation, the normalized power density rapidly increases by a factor of 10 within a short time, peaking at 5717 W⋅cm−3 around 0.9 s, indicating the occurrence of a prompt supercritical event with minimal influence from delayed neutrons on reactivity. Almost simultaneously, negative temperature feedback from the Doppler effect begins to take effect as the core temperature starts to rise at 0.82 s, leading to a subsequent decrease in power density. As the CA continues to drop, its relatively large differential worth at the core center causes the inserted reactivity to surpass the negative temperature feedback, resulting in a second power density peak of 362 W⋅cm−3 at approximately 1.5 s. The CA is fully inserted after 2.0 s, making the reactor core subcritical. Consequently, the normalized power density gradually decreases, while the core temperature continues to rise, reaching around 1000 K at 3 s due to the absence of a heat sink.
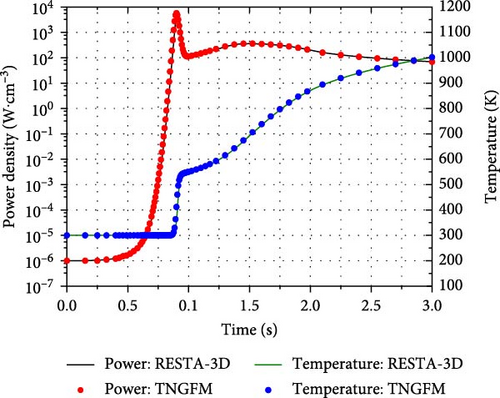
As shown in Figure 5, the maximal percent errors in power density and core temperature are 3.7% and 5.6%, respectively, both occurring near the first power peak. Despite these relatively small discrepancies, the RESTA-3D solutions during the RIA show good agreement with those from the reference code, indicating that the neutron kinetics model proposed in this paper is accurate and suitable for preliminary neutronics/TH calculations.
3.2. NEACRP 3D Pressurized Water Reactor (PWR) Benchmark
The core configuration and operational data of the NEACRP 3D PWR benchmark, including geometry, physical properties, and few-group parameters, are extracted from a realistic PWR. An additional CR is placed at the center of core to address the issue of single CR ejection with complete rotational symmetry during the verification process. As described in the benchmark, CR ejection events may result from the failure of the CR drive mechanism casing located above the reactor pressure vessel in a PWR. Such an event could cause a rapid, localized disturbance in core safety parameters, posing a significant challenge to the accuracy of any neutronics/TH coupling code based on the nodal method.
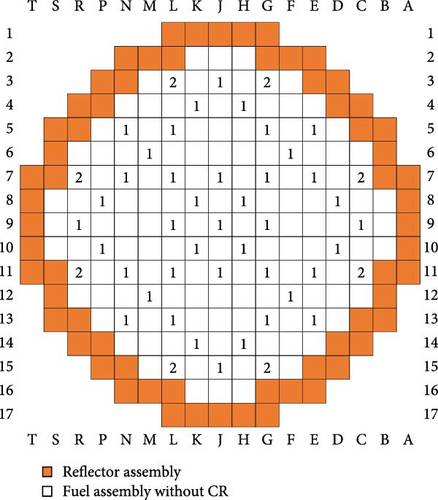
The radial core layout of the NEACRP 3D PWR benchmark is shown in Figure 6, where the size of each fuel assembly is 21.606 cm × 21.606 cm. In this study, a quarter core model is used in the radial direction, with each fuel assembly consisting of 2 × 2 nodes. Vertically, the reactor core is divided into 18 layers. The 1st and 18th layers, starting from the bottom, represent the axial reflector, each with a height of 30 cm. The remaining 16 layers form the reactor active core, which has a height of 367.3 cm. Table 1 lists the primary design parameters for the benchmark core. Detailed information on cross-section data, thermal relations, and properties can be found in the related literature [24]. The accident scenarios in this study are initiated by the rapid ejection of the CR at hot zero power (HZP) and hot full power (HFP). These scenarios include six cases, labeled A, B, and C under both HZP and HFP conditions, as summarized in Table 2.
| Parameters | Values |
|---|---|
| Steady state operation data | |
| Core power (MWth) | 2775 |
| Inlet temperature (°C) | 286 |
| Core pressure (MPa) | 15.5 |
| Inlet mass flow rate (kg·s−1) | 12,893 |
| Fraction of heat deposited in coolant (%) | 1.9 |
| Fuel assembly geometry | |
| Pellet diameter (mm) | 8.239 |
| Clad outer diameter (mm) | 9.517 |
| Clad wall thickness (mm) | 0.571 |
| Fuel rod pitch (mm) | 12.655 |
| Inner diameter of guide tube (mm) | 11.448 |
| Outer diameter of guide tube (mm) | 12.259 |
| Number of fuel pins | 264 |
| Number of guide tubes | 25 |
| Case | Condition | Number of ejected CR | Position of ejected rod (in steps) | |
|---|---|---|---|---|
| Initial | Final | |||
| A1 | HZP | 1 (central) | 0 | 228 |
| A2 | HFP | 1 (central) | 100 | 228 |
| B1 | HZP | 4 (peripheral) | 0 | 228 |
| B2 | HFP | 4 (peripheral) | 150 | 228 |
| C1 | HZP | 1 (Full core) | 0 | 228 |
| C2 | HFP | 1 (Full core) | 100 | 228 |
- Abbreviations: CR, control rod; HFP, hot full power; HZP, hot zero power.
- ∗The maximal number of steps is 228, 0 means the CR is fully inserted.
Table 3 lists the steady state results obtained by RESTA-3D including the maximal power peaking factor, critical boron concentration, and the reactivity introduced by rod ejection compared with the refined PANTHER solutions [27]. It shows that the maximum discrepancy in critical boron concentration is −0.119%, occurring in Case A1. This indicates that the critical boron concentration search model and the coupling scheme, which updates the few-group parameters using their derivatives, are effectively and correctly implemented in the respective modules. The maximum discrepancies in the maximum power peaking factor and reactivity introduced by rod ejection are −2.468% and −5.370%, respectively. These discrepancies may be attributed to the different spatial and temporal discretization schemes used in the two nodal methods. In general, the static results from the RESTA-3D align well with the revised reference solutions and can be used as initial conditions for further transient analyses.
| Cases | A1 | A2 | B1 | B2 | C1 | C2 |
|---|---|---|---|---|---|---|
| Core conditions | HZP | HFP | HZP | HFP | HZP | HFP |
| Critical boron concentration (ppm) | ||||||
| PANTHER | 561.20 | 1156.63 | 1247.98 | 1183.83 | 1128.29 | 1156.63 |
| RESTA-3D | 560.53 | 1156.14 | 1247.38 | 1184.54 | 1127.69 | 1156.06 |
| Relative error (%) | −0.119 | −0.042 | −0.048 | 0.060 | −0.053 | −0.049 |
| Maximal power peaking factor | ||||||
| PANTHER | 2.8792 | 2.2073 | 1.9330 | 2.0954 | 2.1867 | 2.2073 |
| RESTA-3D | 2.8467 | 2.2171 | 1.8853 | 2.0688 | 2.1729 | 2.2690 |
| Relative error (%) | −1.129 | 0.444 | −2.468 | −1.269 | −0.631 | 2.795 |
| Reactivity introduced by CR ejection (pcm) | ||||||
| PANTHER | 824.31 | 91.58 | 826.18 | 99.45 | 949.09 | 79.23 |
| RESTA-3D | 820.12 | 91.32 | 822.97 | 94.11 | 944.10 | 80.93 |
| Relative error (%) | −0.508 | −0.284 | −0.389 | −5.370 | −0.526 | 2.146 |
- Abbreviations: CR, control rod; HFP, hot full power; HZP, hot zero power; PWR, pressurized water reactor; RESTA-3D, reactor system transient analysis-three dimensional.
For Cases A2 and B2, before the transient processes begin, the reactor operates under static conditions with a full power of 2775 MWth, and the average fuel and coolant temperatures are 538°C and 310°C, respectively. As shown in Figure 7b,d, with reactivities of 91.58 and 99.45 pcm inserted into the core over 0.1 s for Cases A2 and B2, respectively, the relative power increases for both cases are less than 10%. This suggests that delayed-critical transient conditions occur, and the effect of delayed neutrons on core reactivity is significant.
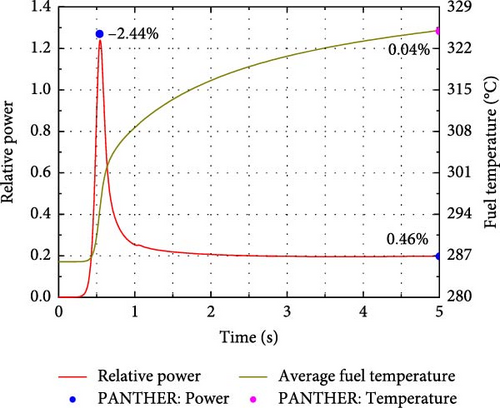
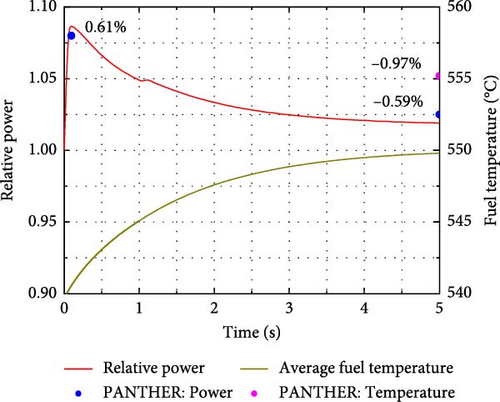
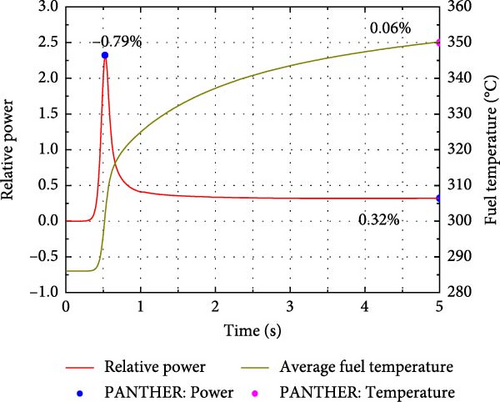
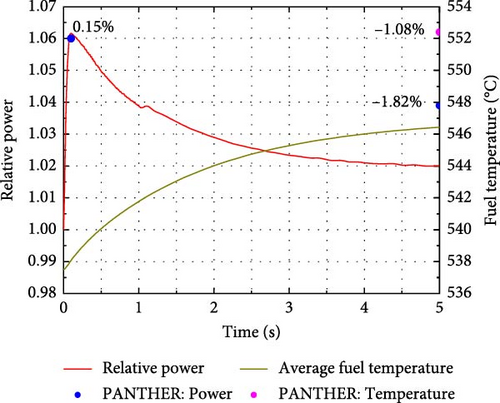
Compared to Cases A1 and B1, the core parameters, including relative power and average fuel temperature, in Cases A2 and B2 exhibit a faster response to the perturbation. This is because the initial relative power in Cases A1 and B1 is 10−6, and the fuel temperature is uniformly distributed, equal to the inlet coolant temperature of 286°C. A significant increase in power is observed after 0.3 s, while the delayed rise in fuel temperature results from the lag effect of heat transfer. In Cases A2 and B2, the timely increases in fuel and coolant temperatures lead to a balance between the induced negative reactivities and inserted reactivity. As a result, the relative power drops sharply after reaching its peak within 0.1 s. Eventually, the reactor core reaches a new steady state without the implementation of any safety strategy. As shown in Figure 7, the solutions obtained from the RESTA-3D, including peak power, final power, and fuel temperature, are compared with those from the PANTHER code for all four cases. The maximum deviations of the calculated power peak, final power, and final fuel temperature are −2.44%, −1.82%, and 1.08%, respectively, indicating good agreement. Therefore, the developed scheme for handling the neutronics/TH coupling problem in the RESTA-3D code is both correct and effective. These benchmark problems are likely to be particularly sensitive, especially with regard to CR reactivity. Thus, a sensitivity analysis should be conducted to better understand the source of the deviations.
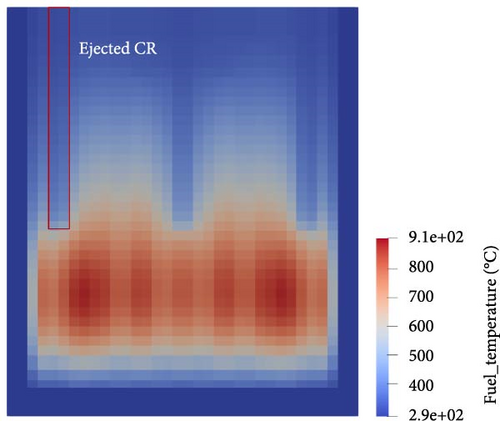
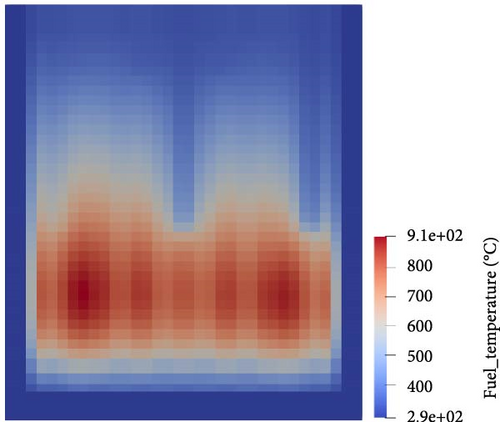
To provide a more intuitive representation of the localized perturbations in core parameters, the initial and final fuel temperature distributions for Case C2 are shown in Figure 8. As observed in Figure 8a, under the HFP condition, the static fuel temperature distribution is axisymmetric, and the peak temperature values shift to the lower half of the reactor core with coolant cooling and the insertion of different types of CRs. The transient is perturbed by a 128 cm CR ejection during the first 0.1 s, which introduces a 79.23 pcm reactivity into the core. Similar to Cases A2 and B2, reactor self-regulation at HFP is much more effective than that at HZP. A stable state is reached within 5 s, with the average fuel temperature increasing by only 8.81°C. The localized perturbations are clearly visible in Figure 8b. In the region near the assembly where the CR is ejected, the local fuel temperature increases significantly during the transient, and the peak temperature on the left side of the reactor core also rises sharply. This results in an asymmetric fuel temperature distribution.
3.3. PWR MOX/UO2 Core Benchmark
In this section, the PWR MOX/UO2 core benchmark [28] is selected to assess the precision and stability of the RESTA-3D code. This benchmark is based on a realistic Westinghouse PWR with four thermal loops, featuring partial loading of weapons-grade MOX fuel. The use of MOX, a blend of Pu and U in oxide form, along with burnup variations within the core, results in a substantial neutron flux gradient across the fuel assemblies [19]. This presents challenges for neutronics/TH coupling codes that employ nodal methods.
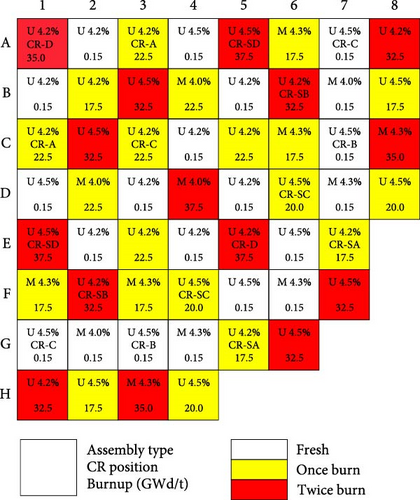
The quarter-core configuration of this benchmark problem is shown in Figure 9, and the primary design and TH parameters of the active core are displayed in Table 4. Detailed neutronics and TH parameters can be found in the literature [28]. This benchmark consists of four parts: (1) 2D steady-state neutronics calculations with fixed TH parameters; (2) 3D boron concentration search under HFP condition with TH feedback; (3) 3D boron concentration search under HZP condition with TH feedback; (4) CR ejection accident simulation under HZP conditions. In this study, Part 3 is omitted for brevity, while the remaining three parts are simulated and analyzed in detail to validate the RESTA-3D code. The two-group assembly homogenization parameters for this benchmark, including macroscopic cross-sections, neutron diffusion coefficients, assembly discontinuity factors (ADFs), kinetic parameters at different burnup points, moderator density, fuel and moderator temperatures, and boron concentrations, are generated using DRAGON5 [13], leveraging the nuclear library in SHEM-361 format based on the ENDF/B-VII.0 data.
| Parameters | Values |
|---|---|
| Core power (MWth) | 3565 |
| Inlet temperature (°C) | 286.85 |
| Core pressure (MPa) | 15.5 |
| Inlet mass flow rate (kg/s) | 15,849.4 |
| Number of fuel assemblies | 193 |
| Fuel lattice, fuel rods per assembly | 17 × 17 square, 264 |
| Guide tubes per assembly | 25 |
| Active fuel length (cm) | 365.76 |
| Assembly pitch (cm) | 21.42 |
| Pin pitch (cm) | 1.26 |
In Part 1, the fuel temperature, moderator density, and boron concentration are set to 560 K, 752.06 kg/m3, and 1000 ppm, respectively. During the calculation, two layers of nodes are modeled along the axial direction to simulate a 2D problem. In the radial direction, a 2 × 2 node division is applied for each fuel assembly to improve the solution accuracy. The values of keff in both all rods out (ARO) and all rods in (ARI) conditions, along with the total CR worth calculated using the RESTA-3D, are shown in Table 5. These results are compared with those from the reference codes DeCART [29], PARCS [30], and CITATION [31], as stored in the benchmark book [28]. Among the three codes, DeCART, a heterogeneous high-order multigroup neutron transport code using the MOC, is selected as the reference. PARCS employs both the analytic nodal method (ANM) and the NEM, while CITATION utilizes the finite difference method (FDM). Table 5 indicates that, compared to DeCART, keff values obtained from the RESTA-3D in ARO and ARI conditions differ by 0.5% and 0.42%, respectively. The relative error in the total CR worth is only 0.706%, which is in good agreement with the reference solutions. Additionally, the solutions from PARCS are closer to those from the RESTA-3D than those from the other two codes, as both use nodal methods.
| Code | keff | Total rod worth (pcm) | Error (%) | |
|---|---|---|---|---|
| ARO | ARI | |||
| DeCART | 1.058520 | 0.987430 | 6801 | — |
| PARCS 2G | 1.063786 | 0.991536 | 6850 | 0.710 |
| CITATION | 1.060337 | 0.988785 | 6825 | 0.339 |
| RESTA-3D | 1.063782 | 0.991535 | 6849 | 0.706 |
- Abbreviations: ARI, all rods in; ARO, all rods out; CR, control rod; RESTA-3D, reactor system transient analysis-three dimensional.
- ∗PARCS 2G means PARCS code with 2 neutron energy groups, similarly hereinafter.
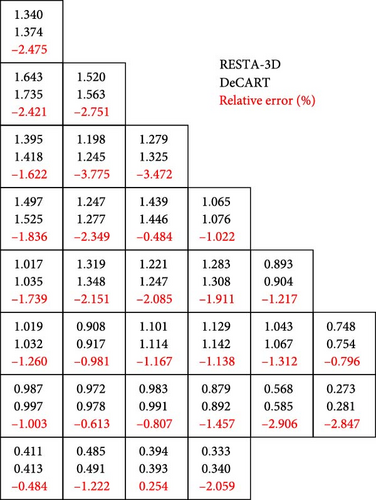
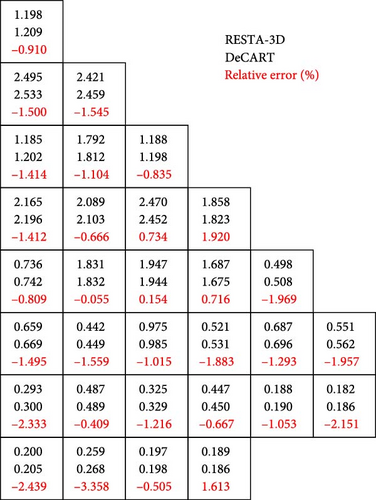
The radial power peaking factor is an important reactor variable that characterizes the intensity and profile of heat production. It is defined as the ratio of the maximum heat production within a fuel assembly to the average heat production throughout the reactor core in the radial plane. Figures 10 and 11 present the power profile normalized by the average value in the radial direction, along with the relative deviation between the RESTA-3D and DeCART under ARO and ARI conditions, respectively. For the ARO condition, the maximal difference of −3.755% occurs at position (C, 2), while for the assembly with the highest radial power peaking factor, (B, 1), the relative error is −2.421%. For the ARI condition, the maximal difference of −3.358% occurs at position (H, 2), while the highest radial power peaking factor of 2.495 is still located at (B, 1), with a difference of −1.5%. Overall, the static solutions from RESTA-3D static solutions are very close to the heterogeneous solution from the DeCART neutron transport code, despite the slightly higher errors in local areas, mainly due to the loading of MOX fuel, CR insertion, and the burnup variation of the fuel assemblies.
In Part 2, critical boron concentration search is conducted under HFP conditions with TH feedback. In this section, the SKETCH code utilizing ANM is incorporated into the reference codes. After obtaining the critical boron concentration, a coupled neutronics/TH steady-state calculation is performed. Table 6 indicates that the final critical boron concentration and core-averaged TH parameters are in good agreement with the results from reference codes, further validating the accuracy and applicability of the proposed boron concentration search model as well as the single-channel TH model, including the steam table at 15.5 MPa, implemented in the RESTA-3D.
| Code | Critical boron concent. (ppm) | Core average T/H properties | ||||
|---|---|---|---|---|---|---|
| Fuel temp. (°C) | Coolant density (g/cm3) | Coolant temp. (°C) | Outlet cool. density (g/cm3) | Outlet cool. temp. (°C) | ||
| PARCS 2G | 1679 | 562.9 | 0.7061 | 308.2 | 0.6621 | 325.7 |
| PARCS 4G | 1674 | 563.0 | 0.7061 | 308.2 | 0.6621 | 325.7 |
| PARCS 8G | 1672 | 563.1 | 0.7061 | 308.2 | 0.6621 | 325.7 |
| SKETCH | 1675 | 563.5 | 0.7055 | 307.8 | 0.6596 | 325.8 |
| RESTA-3D | 1673 | 562.8 | 0.7057 | 308.1 | 0.6615 | 325.5 |
- Abbreviations: RESTA-3D, reactor system transient analysis-three dimensional; TH, thermal-hydraulics.
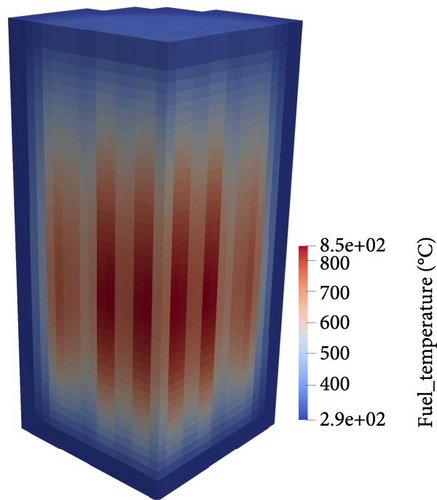
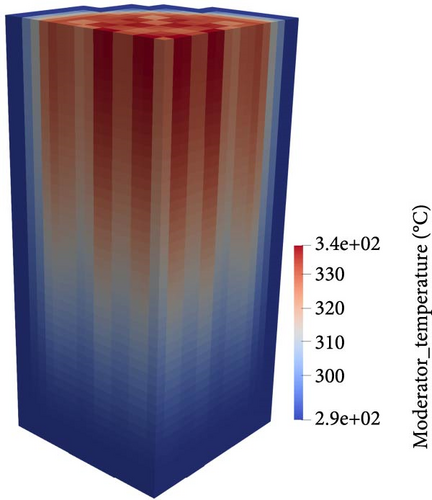
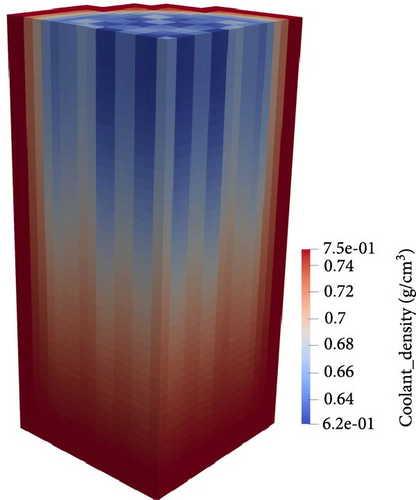
Additionally, the 3D steady-state distributions of fuel temperature, moderator temperature, and moderator density under HFP conditions, calculated by the RESTA-3D, are shown in Figure 12. From these, the effect of CR insertion on core parameters is clearly observed. The fuel temperature profile exhibits a symmetrical distribution, similar to the nuclear heat distribution in fuel pins. The moderator (water) enters the reactor core with an average temperature of 286.85°C and gradually heats up as it flows through the active core, due to heat convection from the fuel pins and the deposition of a small amount of nuclear heat in the moderator. Ultimately, the moderator exits the active core with an average temperature of 308.1°C. In contrast, the moderator density decreases as it flows from the reactor core inlet to the outlet, with the mean outlet density of the moderator being 0.6615 g/cm3. Multi-phase flow may occur during this process, which will be further investigated in future work using a subchannel TH model.
In Part 4, the reactor is operated under steady-state HZP condition with a critical boron concentration of 1341 ppm. A perturbation is then introduced by ejecting (E, 5) from the bottom to the top of the reactor core within 0.1 s. A comparison of the calculated βeff, peak time, peak power, and peak reactivity during the transient between the RESTA-3D and the reference codes is displayed in Table 7. The results show that the peak time, peak reactivity, and βeff from these codes are consistent. However, significant discrepancies are observed in the peak power. Notably, the PARCS 8G solution results in a 30% increase in transient peak power compared to the 2G solution, while the group effect in PARCS has minimal influence on the other parameters. Overall, since the PARCS 8G solution is closer to the results from RESTA-3D, it is selected as the reference code in the subsequent verification process.
| Code | Peak time (s) | Peak power (%) | Peak reactivity ($) | βeff (pcm) |
|---|---|---|---|---|
| PARCS 2G | 0.34 | 142 | 1.12 | 579 |
| PARCS 4G | 0.33 | 152 | 1.12 | 579 |
| PARCS 8G | 0.32 | 172 | 1.14 | 580 |
| SKETCH | 0.34 | 144 | 1.12 | 579 |
| RESTA-3D | 0.35 | 173 | 1.12 | 580 |
The power profile and reactivity evolution from the RESTA-3D compared to the reference are depicted in Figure 13. It can be observed that, with the introduction of CR ejection, the reactivity rises to 1.12$ (649.6 pcm) in the first 0.1 s, leading to a prompt supercritical state. The core power initially increases sharply from 0.0001% to 173% of the full power (3565 MWth) and then rapidly decreases as negative reactivity from the rising coolant and fuel temperatures is gradually introduced into the core, as seen in Figure 14. Eventually, the core power stabilizes at 20% of full power, with the corresponding reactivity at 0.57$. Therefore, the moderator and fuel temperatures increase slowly over 1 s.
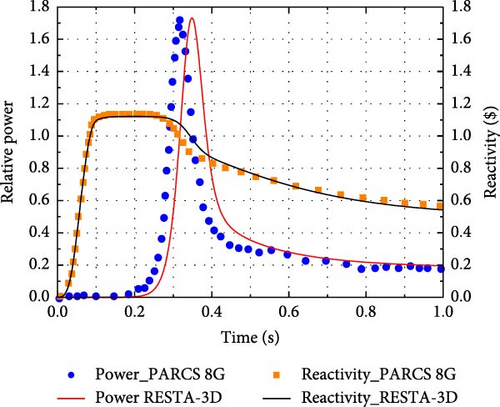
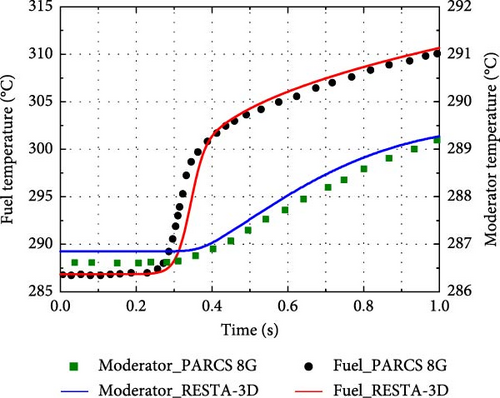
The RESTA-3D results agree well with the reference in terms of curve trends and values at special points, such as the start, peak, and end points. However, there are still some nonnegligible discrepancies. For example, the relative power peak from RESTA-3D occurs 0.02 s later than that from PARCS 8G, and the moderator temperature from RESTA-3D is consistently higher than the reference result throughout the transient. In fact, while the 8G solution is expected to reduce energy discretization errors in PARCS, it introduces a more significant spatial discretization error due to the more complex spatial distribution of neutron flux. This is especially noticeable in the low-energy groups, where interactions between groups are more pronounced. The impact of increasing neutron energy groups on core parameters under both static and transient conditions depends on the competing effects of group and spatial discretization [28]. Furthermore, the use of different discretization methods for spatial and time-dependent terms, node sizes, time steps, and TH properties may also contribute to the discrepancies. Within acceptable computational errors, the RESTA-3D results are in good agreement with those from PARCS 8G, further validating the correctness and availability of the kinetics and TH models implemented in the RESTA-3D.
4. Conclusions
In this study, the 3D spatial dynamics code TMSR3D, originally designed for MSRs using the neutronics/TH method, has been extended to a new code RESTA-3D for simulating LWRs. The neutronics module incorporates the 4th-order NEM for spatial discretization and the ETM to handle the time derivative terms in the 3D neutron kinetics equations, both of which are adopted from the original TMSR3D without DNP flow. A simplified single-channel TH model, including a steam table at 15.5 MPa, has been newly developed to account for thermal feedback. Additionally, a critical boron concentration search model has been introduced specifically for LWRs. A comprehensive discussion of the numerical models and solution methods adopted in the extended code is provided.
To verify the theoretical models and solution methods implemented in the RESTA-3D code, the 3D-LRA benchmark problem is first used to test its performance in addressing BWR problems. Subsequently, two PWR benchmarks, NEACRP 3D and MOX/UO2 cores, are simulated, with both steady-state characteristics and transient behaviors thoroughly analyzed. The numerical solutions demonstrate that the RESTA-3D code is an effective tool for the dynamic analysis of large-scale advanced PWRs, such as the CPR1000, CAP1400, and HPR1000 (Hualong Pressurized Reactor).
Future developments for the code aim to replace the current NEM neutronics module with a more advanced nodal method, such as the semi-ANM (SANM), incorporating nonlinear iterations and GPU acceleration. Additionally, further extensions could include a subchannel TH model that accounts for cross-flow, multiphase flow, and flow distribution at the core inlet.
Conflicts of Interest
The authors declare no conflicts of interest.
Author Contributions
Yong Cui: writing–original draft preparation, software, conceptualization, validation. Jing Shang: writing–review and editing, supervision. Longwei Mei: methodology, data curation, project administration. Jianfei Tong: validation, formal analysis. All authors have read and agreed to the published version of the manuscript.
Funding
This work is supported by the Young Potential Program of Shanghai Institute of Applied Physics, Chinese Academy of Sciences (Grant SINAP-YXJH-202204), National Natural Science Foundation of China (Grant 11805033), and State Key Laboratory of Nuclear Power Safety Monitoring Technology and Equipment (Grant K-A2019.418).
Acknowledgments
The first author would like to acknowledge Dr. Muhammad Imron from Abu Dhabi Polytechnic for his helpful remarks and suggestions.
Open Research
Data Availability Statement
The data used to support the findings of this study are available from the corresponding author upon request.


