Optimizing Solar Drying Chamber Performance: Taguchi Analysis of Uniformity Enhancement Methods
Abstract
Solar drying is an ancient yet sustainable method for preserving agricultural products. However, a key challenge in this process is achieving uniform airflow distribution, as uneven airflow can result in inconsistent drying and reduced product quality. To address this issue, the study incorporates flow enhancement tools such as baffles and swirlers to the plenum of the drying chamber. The result revealed that the presence of baffles and a swirler significantly enhances drying uniformity and temperature distribution in solar dryers. Thus, the rectangular baffles significantly enhance drying rate and uniformity, reducing temperature gradients from 4.2–8.7°C to 1.2–6.8°C. Triangular baffles also improved moisture removal and thermal distribution, with temperature differences narrowing to 1.0–3.3°C. Swirlers optimized drying uniformity across trays and enhanced heat distribution, lowering temperature gradients from 5.0–7.3°C to 2.0–4.8°C. The study also employed Taguchi analysis to determine the optimal enhancement method and identify the ideal operational parameters. Solar intensity and the temperature entering the drying chamber are the primary factors influencing drying process. Furthermore, the implementation of enhancement methods showed a notable improvement in drying uniformity, as confirmed by the Taguchi analysis results.
1. Introduction
Significant portion of agricultural products, including grains, vegetables, fruits, marine, and herbal items, face losses during postharvest stages. Many of these goods deteriorate due to inadequate drying and storage practices. Reports indicate substantial losses, with fruits experiencing 50%–70% spoilage and grains suffering 10%–30% losses, largely because of inefficient drying and preservation methods [1]. Solar drying stands as one of the most traditional yet effective methods for minimizing postharvest losses. Solar-powered drying systems provide a cost-efficient approach to food preservation [2]. With fossil fuels becoming scarcer and more expensive, along with uncertainty about their future costs and availability, the use of solar energy for drying agricultural products is expected to rise and could become a highly economical solution in the future [3]. Solar dryers are among the most effective systems for dehydrating fresh crops. These thermal systems are highly favored because they utilize a free, safe, and sustainable energy source [4]. Numerous prominent researchers have emphasized the benefits of solar drying over other drying methods, particularly in terms of cost-effectiveness and environmental sustainability, positioning it as a viable solution to address food wastage. However, as noted in Kumar and Kumar [5], solar dryers have some draw backs such as inadequate design and limited performance.
Another challenge associated with solar drying systems is uneven airflow within the drying chamber, which results in nonuniform drying, diminished product quality. To mitigate this issue, various authors have proposed and implemented methods to enhance airflow uniformity. Additionally, the design and components of solar dryers have been optimized using diverse approaches, as documented in various studies. Optimization techniques can be employed to modify the design of the solar dryers, improve airflow distribution, enhance thermal efficiency, and so on.
Several research studies have been conducted on optimizing indirect solar drying systems. Various types of optimizations have been outlined in the literature.
Advanced techniques, such as artificial neural networks (ANNs), genetic algorithms (GAs), response surface methodology (RSM), particle swarm optimization (PSO), and the Taguchi method, have been utilized to model solar drying processes and equipment, enabling precise prediction of optimal configurations [6]. Taguchi method is a highly regarded approach for design of experiment (DOE) and optimization, extensively applied across diverse industries and engineering disciplines. It systematically analyzes various design factors and parameters, identifying the optimal combination to achieve desired performance targets. By selecting the most effective control factors, the method minimizes the number of experimental trials while maximizing efficiency [7]. Taguchi method is an effective approach in experimental design that reduces the number of experiments required based on the given control factors. Each experiment consists of a specific level for each control factor, and the combinations of these levels are determined using predefined orthogonal arrays (OAs). Afterward, each experiment is repeated several times, with the result from each replication referred to as the process response. The responses from all experiments are then converted into a signal-to-noise (S/N) ratio for comparison. The experiment with the highest S/N ratio identifies the optimal levels of the control factors [8]. Taguchi method employs OAs from experimental design theory to efficiently analyze a large number of variables with fewer experiments [9].
The Taguchi method involves the creation of OAs to systematically evaluate a set of parameters, including certain input variables. The experimental results are then converted into S/N ratios to assess performance. The S/N ratio is categorized into three types: larger-the-better, smaller-the-better, and nominal-the-best [10]. The higher-the-better approach is used when the objective is to maximize a parameter, while the lower-the-better approach is applied when minimizing a parameter is desired. In contrast, the nominal-the-best approach is suitable for scenarios where the objective must be maintained at a specific target value to achieve optimal performance [11].
Various studies have focused on optimizing different aspects of solar energy systems, utilizing the Taguchi method to optimize solar drying systems and their parameters. For example, Christopher [12] used the method to optimize flow parameters of solar air heaters (SAHs); Badaoui et al. [13] employed the Taguchi method to select the optimal configuration for a SAH; Midili and Kucuk [14] focused on optimizing the design of an impinging jet solar thermal collector; Aghaie et al. [15] applied the method to optimize the thermo-hydraulic behavior of air flow in a SAH, improving its efficiency; Kolioak et al. [16] used it to determine the optimal heat energy characteristics of a solar box collector; Gupta and Rana [17] employed the Taguchi method to enhance the performance parameters of solar air systems; Jibhakate et al. [18] used it to optimize the performance of solar tunnels; Hussein et al. [19] applied it to refine the processing parameters for drying tomatoes; Padmanaban et al. [20] utilized this approach to identify the best drying parameters for solar drying of copra; Osodo et al. [21] employed it to refine the basic parameters of a forced convection grain dryer; and Al-Hajji et al. [22] employed it to optimize the performance of SAHs. These studies highlight the versatility and effectiveness of the Taguchi method in improving the design and performance of various solar energy systems. The details of these studies are summarized in Table 1.
| Author/s | Level factor | Response parameters | Controlled parameters | Type of S/N ratio used |
|---|---|---|---|---|
| [7] | 6 |
|
|
|
| [8] | 5 | Change in temperature and performance | Solar collector, mass flow rate, and cover type | LB |
| [11] | 3 |
|
Jet diameter ratio, streamwise pitch ratio, and the spanwise pitch ratio | SB for Fr and LB for the Nu and TOP |
| [15] | 4 | hc and FF | P/H, e/H, a/H, s/H-a | LB for hc and SB for Fr |
| [16] | 3 | Solar box collector heat energy | Type of PCM, solar radiation, ambient temperature, and time | LB |
| [17] | 3 | Pressure drops and thermal efficiency | Mass flow rate (kg/s), heat flux (W/m2), streamwise pitch (mm), cross-stream, pitch (mm), angle ( °), and height (mm) | SB and NB for the pressure drop and LB for the thermal efficiency |
| [18] | 3 | Performance | Absorbing material, cover thickness (μm), air velocity (m/s), and drying bed thickness (mm) | — |
| [19] | 3 | Effective moisture diffusivity | Pretreatment, thickness, and temperature | LB |
| [20] | 3 | WRR and Mc | Initial mass (g), inclination angle (°), and time period | For WRR, LB, and for Mc, SB |
| [21] | 3 | Performance of a forced convection grain dryer | Air velocity, grain layer thickness, and drying air temperature | — |
| [22] | 2 | Change in temperature and efficiency of the SAH | Inlet velocity, absorber plate material, and tilt angle | LB |
A critical challenge in multitray solar drying systems as noted in Abdulmalek et al. [23] is the nonuniform distribution of airflow within the drying chamber, which leads to uneven moisture removal, reduced product quality, and nutritional degradation. Researchers have attempted various methods to improve flow uniformity in the drying system. For example, Al-Kayiem and Gitan [24] made an inclination of the trays into 0°, 10°, 20°, 30°, and 35°. Christopher [12] used vertical V-shaped air distribution channels to achieve uniform airflow and temperature distribution across the drying chamber. Abdulmalek et al. [25] suggested that solar drying uniformity could be enhanced through dehumidification systems or structural design optimizations in the dryer.
The novelty of this study lies in its pioneering use of the Taguchi method to evaluate and compare different airflow uniformity enhancement mechanisms (e.g., triangular baffles, rectangular deflectors, and swirlers) in solar drying applications. While the Taguchi approach has been widely applied to optimize thermal performance parameters such as heat transfer efficiency and pressure drop in solar dryers, its potential for improving airflow uniformity a critical factor for drying consistency and product quality remains unexplored. Additionally, previous studies have not investigated the integration of swirl-inducing structures or strategically placed baffles to enhance uniform air distribution within the drying chamber. This study addresses these gaps by employing Taguchi analysis, which was employed to identify the most effective airflow modification strategy while considering both energy efficiency and drying performance. The objective of the study is to investigate the performance of a solar dryer with different airflow enhancement methods and to identify the optimal configuration using Taguchi analysis for achieving uniform drying efficiency. The study aims to evaluate the effectiveness of the solar dryer in terms of different performance indicators like thermal analysis, drying rate, and so on. The findings will aid in the development of high-performance solar dryers and provide insights for future research on advanced airflow control strategies, including the optimal placement and integration of multiple uniformity-enhancing features.
2. Materials and Methods
2.1. Study Area
The experiment was conducted in the Mechanical Engineering Laboratory of the Hungarian University of Agriculture and Life Sciences (MATE), formerly Szent István University, located in Gödöllő, Hungary (47°35′39″N, 19°34′58″E). The experiment was carried out between July and September 2024.
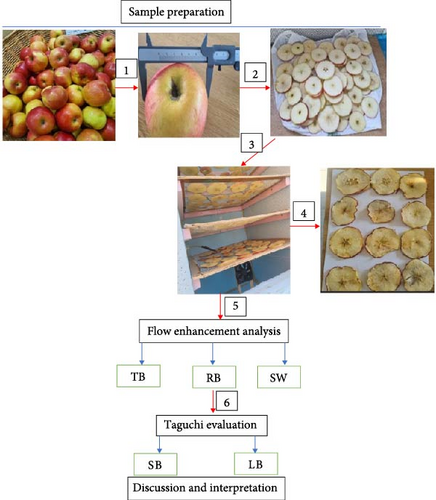
Four kilograms of apples were purchased from Coop in Gödöllő, Hungary (Egyetem tér 17, 2100) during the experiment. The apples were selected based on uniform size, and their diameters were measured to ensure consistency. Using a manual knife, the apples were sliced into pieces of standardized thickness. These sliced samples were then placed in the drying chamber for processing. To enhance airflow efficiency, three different flow-enhancer methods (triangular baffles, rectangular baffles, and a spiral design) were integrated into the plenum of the drying chamber. A Taguchi analysis was subsequently conducted to determine the optimal enhancement method and identify the ideal operational parameters. A summary of the experimental procedure is illustrated in Figure 1.
2.2. Basic Material and Instruments Used
In the present study, an indirect type, forced convection solar dryer consisting of a flat plate SAH coupled to a drying chamber is constructed and investigated experimentally for drying of golden apple slices. The detail of the drying system is shown in Table 2.
| Component | Description |
|---|---|
| Solar air heater |
|
| Connector pipe |
|
| Drying chamber |
|
| Trays |
|
| Auxiliary equipment |
|
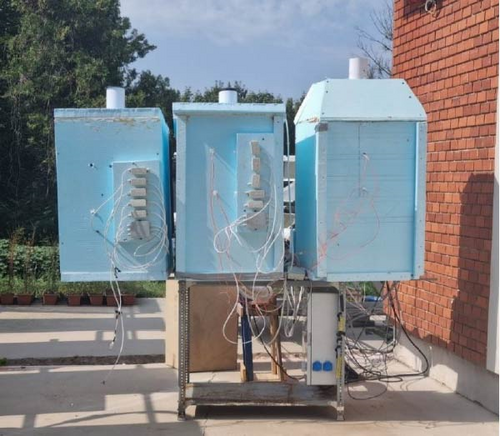
The fabricated dryers are shown in Figure 2. Two similar-sized and similarly shaped dryers were fabricated, with one serving as the benchmark.
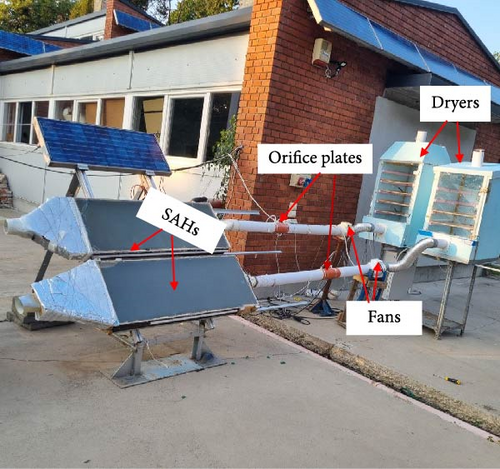
The fully integrated solar dryer, equipped with a SAH, fans, and a flow measuring device, is shown in Figure 3.
2.3. Data Collection
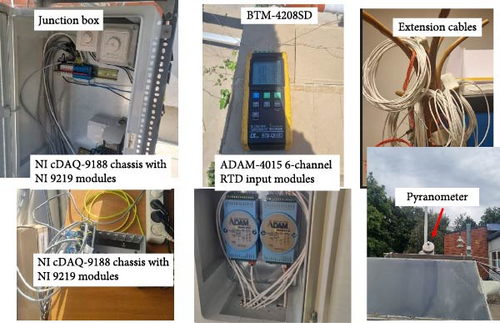
The sensors and instruments used for collecting the experimental data are detailed in Table 3 and Figure 4.
| Instrument | Model | Accuracy | Operational range | Purpose |
|---|---|---|---|---|
| Humidity sensor | HIH-40000-004 | ±3.5% | 0%–100% RH | To measure the humidity level |
| Pressure sensor | SDP816-500Pa | ±5 millibar | −500–500 Pa | To measure the pressure, drop, and flow rates with the help of orifice meter |
| RTD sensor | PT-100 | ±0.1°C at 0°C | −75°C–250°C | To measure temperature |
| Temperature recorder | BTM-4208SD | ±0.5°C | −200°C to +400°C | Served as data logger and connected to T-type of thermocouples |
| Digital anemometer | MS6252A | ±0.01 m/s | 0.40−30.00 m/s | To measure the ambient wind speed and used to calibrate the flow rates |
| Digital weighing machine | Lutron GM-500 | 0.1% + 2 | 0–500 g | To measure the weight of samples |
| Pyranometer | Kipp and Zonen CM11 | ±0.1 W/m2 | 1–4000 W/m2 | To measure the solar intensity |
The cDAQ chassis was served as the central data acquisition system, linking multiple sensors via extension cables to the ADAM module.
2.4. Uncertainty of the Experiment
A comprehensive understanding of the method’s performance and the measurement range must be rooted in a detailed analysis of experimental uncertainty. It is crucial to account for all key factors that contribute to this uncertainty [13]. The errors and uncertainties in the experiments originated from factors such as instrument selection, conditions, calibration, environmental influences, observations, readings, and test planning [26].
Uncertainty represents the degree of doubt regarding the result of any measurement and is determined using Equation (5) [27].
Thus, the combined total uncertainty of all instruments is ~3.59%, which is acceptable to conduct our experiment.
2.5. Performance Evaluation of Solar Drying Systems
Numerous researchers have extensively evaluated the efficiency and performance of solar dryers based on a wide range of criteria. These criteria typically include drying rate, energy efficiency, moisture removal rate, product quality, energy consumption, environmental impact, and cost-effectiveness, among others. These evaluation methods are primarily grounded in the principles of the first law of thermodynamics, which focuses on the conservation and flow of energy.
2.6. Energy Analysis of Drying Chambers
The air conditioning process during solar drying of agricultural products includes heating, cooling, and humidification. These processes are modeled as steady-flow systems, with analysis based on mass and energy conservation principles for both air and moisture [14].
2.7. Material Used to Uniform the Flow Behavior
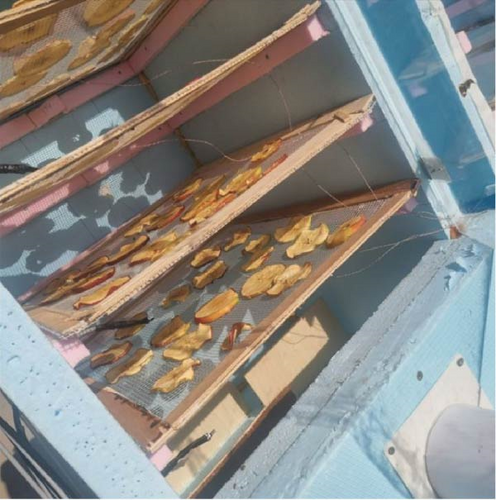
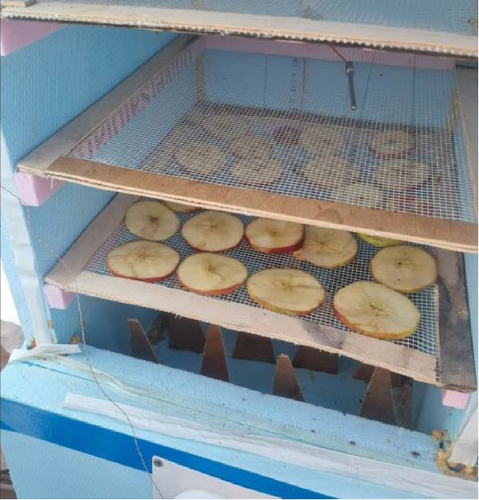
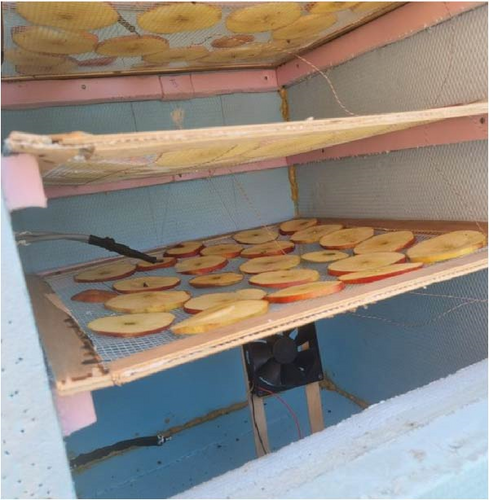
Rectangular baffles, triangular baffles, and a swirler were used to improve the airflow distribution. Additionally, Taguchi analysis was used to identify the optimal configuration, ensuring the best performance in terms of uniform drying efficiency. The triangular baffles measuring 0.18 m by 0.18 m with a base of 0.06 m and rectangular baffles measuring 0.12 m in height by 0.23 m in length and swirler were integrated into the plenum of the drying chamber. Curved metal shaped was also incorporated into the side walls of the drying chamber. The enhancement materials integrated within the drying chamber are illustrated in Figure 5.
2.8. Procedures in Taguchi Approach
The Taguchi method employs a structured approach to performance optimization, as documented in Khan Kamaruddin and Foong [37]. The process begins by defining a target performance metric, which may involve maximizing, minimizing, or achieving a specific value. Key design parameters and their variation levels are then identified. Using OAs, an experimental design is created to ensure efficient and balanced testing. Experiments are conducted according to this design, and the resulting data are analyzed to assess parameter effects and determine optimal settings. Finally, confirmation experiments are performed to validate the results, unless the optimal parameter combination was already tested in the original array.
In our study, we selected four key control parameters: SR, ambient temperature (Tam), inlet temperature to the dryer (Tin), and the enhancement configuration (Type-C) of the drying chamber. The configurations examined included triangular baffles, rectangular baffles, and swirlers. To evaluate the performance of the drying chamber and its flow uniformity, we focused on critical responses such as pressure drop and uniformity in mass reduction. We analyzed three distinct configurations of equipment to ascertain their effectiveness in achieving optimal drying conditions and efficiency. Our approach followed the principle that smaller values are better (smaller is better [SB]) for all the specified response variables. The analysis of the Taguchi method was conducted using Minitab-22.2.2 software. The input parameters utilized in the study are presented in Table 4.
| S/N | Parameter | Units | Level 1 | Level 2 | Level 3 |
|---|---|---|---|---|---|
| 1 | Average solar radiation (SR) | W/m2 | 810 | 830 | 850 |
| 2 | Average ambient temperature (Tam) | °C | 27 | 30 | 33 |
| 3 | Average inlet tempreture (Tin) | °C | 40 | 41 | 42 |
| 4 | Type of configuration (Type-C) | — | RB | TB | SW |
- Abbreviations: RB, rectangular baffles; SW, swirler; TB, triangular baffles..
3. Result and Discussion
3.1. SR and Ambient Temperature the Experiment
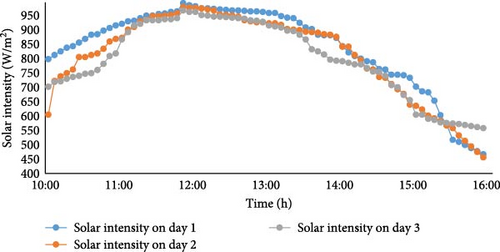
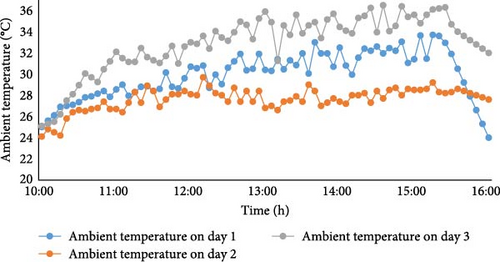
The solar intensity and the ambient temperature are shown in Figure 6. The SR typically increases during the morning, peaks around midday (12:00–13:00), and gradually decreases in the afternoon. The average SR values were recorded as 830 W/m2 on day 1 (with triangular baffles), 810 W/m2 on day 2 (with the rectangular baffles integrated), and 850 W/m2 on day 3 (with swirler baffles). The corresponding average ambient temperatures (Figure 7) for these days were 30°C, 27°C, and 33°C, respectively.
3.2. Performance Analysis of the Solar Drying System
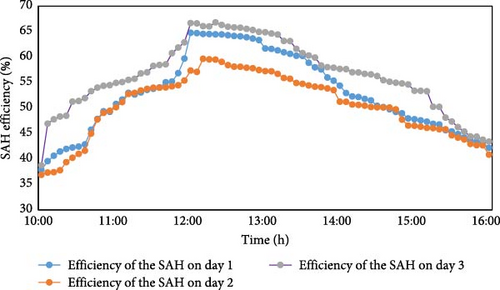
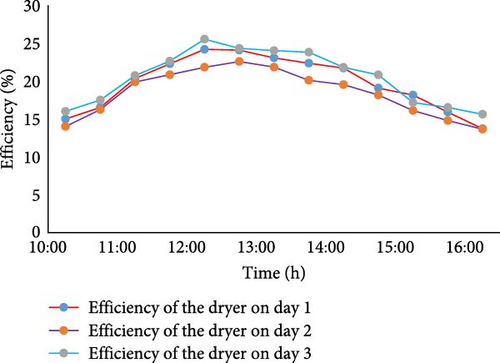
The efficiency of the SAH and corresponding dryer is shown in Figure 8. The SAH’s efficiency starts low in the morning, rises rapidly, and stabilizes by late morning. It reaches peak performance around midday when sunlight is strongest and then gradually declines through the afternoon. The efficiency of dryer (Figure 9) also follows the same pattern with day 3 demonstrating the highest efficiency compared to days 1 and 2. In the afternoon, efficiency gradually declined as SR diminished, highlighting the system’s strong dependence on sunlight availability.
3.2.1. Comparison of the Results
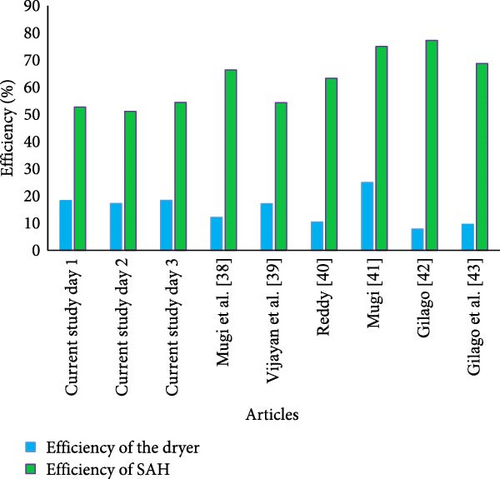
The comparison of dryer efficiency and SAH efficiency of the current study with study is presented in Figure 10. In the current investigation, the dryer efficiencies were recorded as 18.25%, 17.19%, and 19.10% for days 1, 2, and 3, respectively, while the SAH efficiencies were 52.67%, 51.11%, and 54.41% for the corresponding days.
3.3. Mass Reduction of the Three Enhancement Methods
3.3.1. Integrating Triangular Baffles
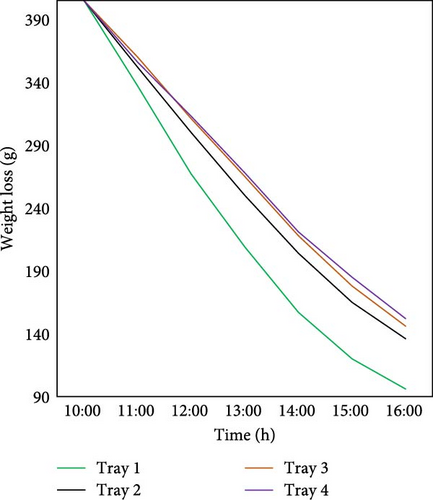
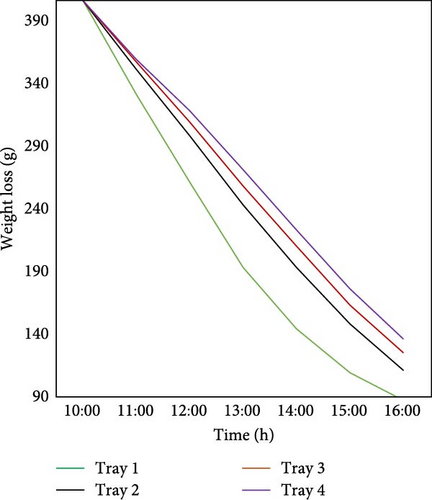
The weight loss of the samples with and without triangular baffles is shown in Figure 11. The dryer without baffles showed greater moisture variation between trays compared to the one with triangular baffles. The triangular baffles likely improved airflow consistency, promoting more uniform drying. During weight loss, the average coefficient of variation (Cv) was 10.26% with triangular baffles and 11.16% without them.
3.3.2. Adding Rectangular Baffles
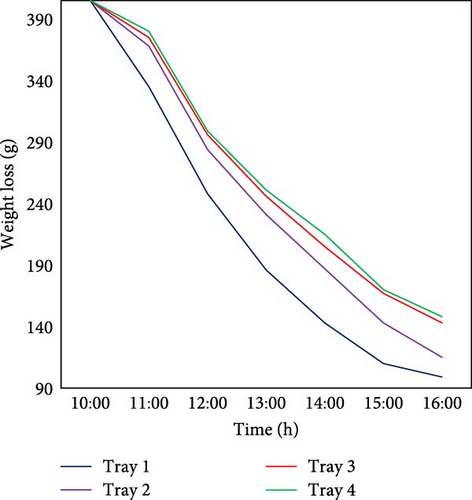
The weight loss of sample in the drying chamber with rectangular baffles and without rectangular baffle is shown in Figure 12. The implementation of rectangular baffles was observed to modulate the drying kinetics, producing a more uniform weight reduction gradient across all trays compared to nonbaffled configurations. Integrating rectangular baffles into drying systems significantly improves process uniformity, as evidenced by a 14.5% reduction in the coefficient of variation (Cv) from 12.55% (unbaffled) to 10.96% (baffled). This enhancement demonstrates that baffle design can optimize drying homogeneity, offering potential benefits for industrial efficiency, product quality, and energy savings.
3.3.3. Adding Swirler
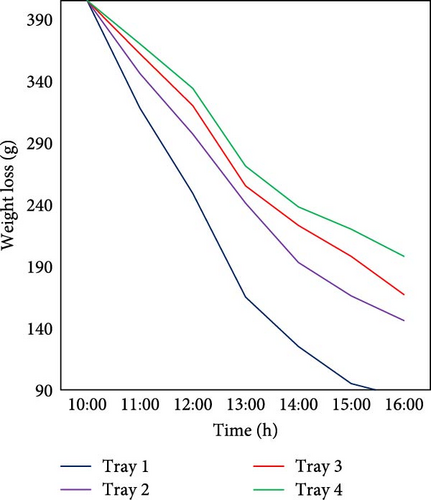
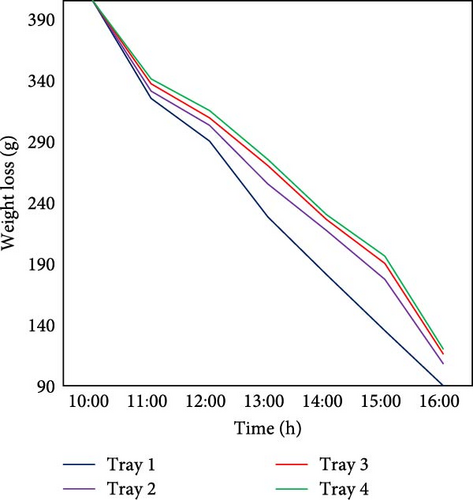
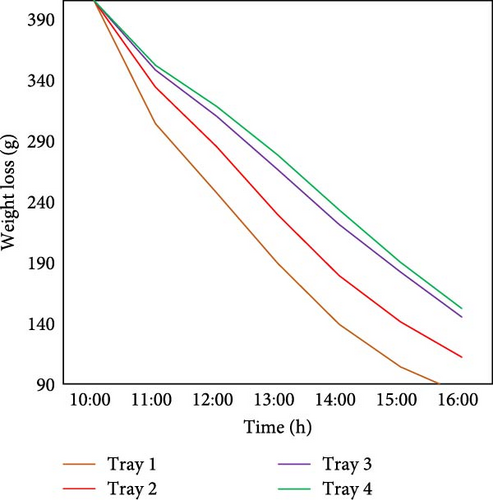
Figure 13 shows drying characteristics between systems employing swirlers and with no swirler. With a swirler, drying is more uniform, with controlled moisture removal and tighter mass differentials. It also creates a unique reverse drying pattern, where upper trays dry slower than some middle trays. Without a swirler, drying is faster in lower trays but less consistent, with greater variability and more aggressive moisture loss early on. The swirler enhances airflow dynamics by creating controlled turbulence, improving heat distribution, reducing uneven drying, and preventing case hardening, leading to better intertray consistency at a steady drying rate. The system incorporating the swirler demonstrated significantly improved uniformity, evidenced by a 39.3% reduction in the average coefficient of variation (Cv = 8.86%) compared to the nonswirler configuration (Cv = 14.95%).
3.4. Tempreture Distribution of the Three Enhancement Methods
3.4.1. Adding the Triangular Baffles
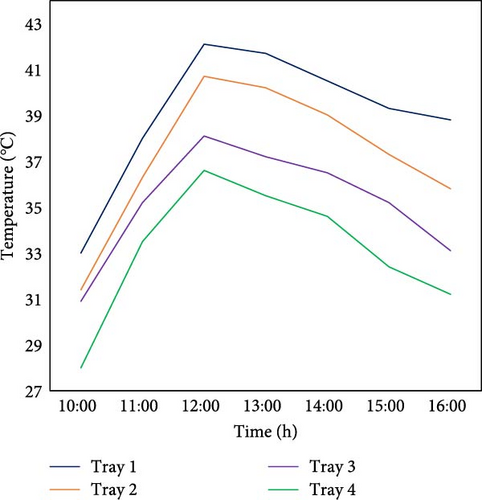
The temperature distribution with triangular baffles is significantly more uniform compared to without baffles as depicted in Figure 14a,b,). In the case of triangular baffles, the temperature differences range from 1.0 to 3.3°C, indicating a relatively uniform distribution across the trays. On the other hand, without the triangular baffles, the temperature differences are much larger, ranging from 3.8 to 7.6°C, which suggests a less uniform distribution. This demonstrates that the presence of triangular baffles helps to improve heat distribution by reducing temperature gradients, resulting in a more uniform temperature profile across the trays.

3.4.2. Adding the Rectangular Baffles
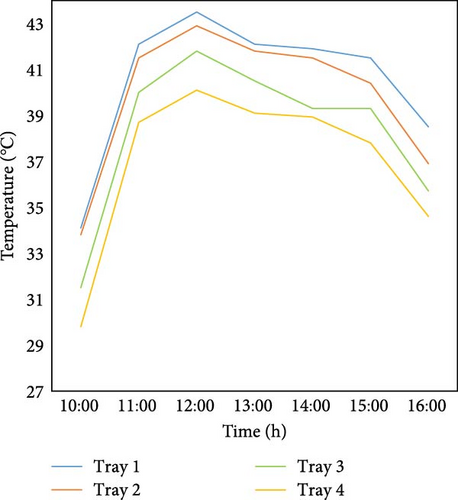
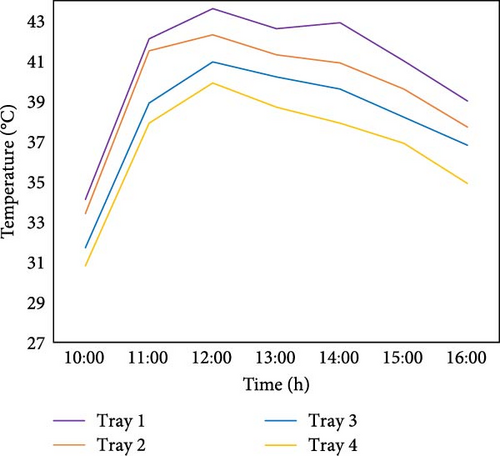
The temperature distribution with rectangular baffles shows generally uniform results as illustrated in Figure 15a,b, with temperature differences ranging from 1.2 to 6.8°C. The largest variation occurs at the beginning of the day, but this difference progressively decreases as the day continues. In contrast, without rectangular baffles, the temperature differences are larger, ranging from 4.2 to 8.7°C, indicating a less uniform distribution. Overall, the temperature distribution with rectangular baffles is more uniform compared to without them.
3.4.3. Integrating Swirler
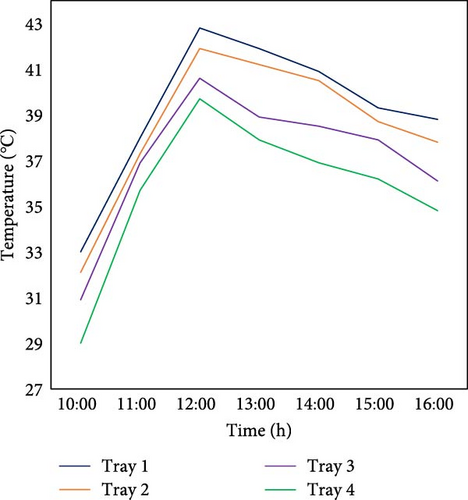
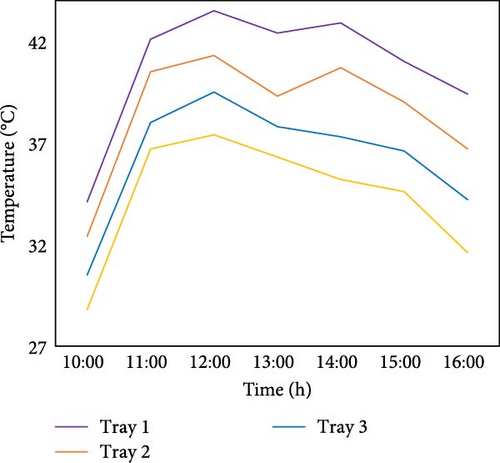
The temperature distribution with the swirler shows a generally uniform pattern, with temperature differences ranging from 2.0 to 4.8°C. The largest variation occurs at 12:00, but overall, the temperature differences are smaller compared to those observed without the swirler as shown in Figure 16a,b. In contrast, without the swirler, the temperature differences are larger, ranging from 5.0 to 7.3°C, indicating a less uniform distribution. In general, the temperature distribution with the swirler is more uniform than without it, in which the swirler enhances heat distribution, reduces temperature gradients, and promotes better thermal uniformity across the trays.
3.5. Taguchi Analysis
The calculated results for the coefficient of variation in temperature distribution, weight loss reduction, and the measured pressure drop were used as response variables. The coefficient of variation for mass reduction across the trays or the drying chamber as a whole, along with the pressure drop in dryers utilizing flow-enhancing designs such as triangular baffles, rectangular baffles, or swirl-type designs, is presented in Table 5. The coefficient of variation for temperature distribution is not displayed here.
| EX no. | Parameters/levels | CV of the mass as response variables | Pressure drops as response variables | |||||||
|---|---|---|---|---|---|---|---|---|---|---|
| SR | Tam | Tin | Type-C | RB | TB | SW | DPRB | DPTB | DPSW | |
| 1 | 810 | 33 | 40 | TB | 0 | 0.00 | 0.00 | 2.80 | 2.66 | 2.63 |
| 2 | 810 | 27 | 41 | SW | 4.77 | 3.92 | 2.13 | 3.12 | 24.200 | 23.24 |
| 3 | 810 | 30 | 42 | RB | 7.58 | 7.47 | 3.27 | 28.23 | 23.79 | 24.200 |
| 4 | 830 | 33 | 41 | RB | 12.41 | 11.73 | 7.90 | 27.18 | 23.31 | 23.79 |
| 5 | 830 | 27 | 42 | TB | 13.94 | 14.46 | 10.38 | 28.67 | 23.59 | 23.31 |
| 6 | 830 | 30 | 40 | SW | 18.68 | 16.80 | 15.47 | 27.36 | 23.03 | 23.594 |
| 7 | 850 | 33 | 42 | SW | 19.38 | 17.44 | 22.90 | 27.86 | 22.740 | 23.03 |
| 8 | 850 | 27 | 40 | RB | 0 | 0 | 0 | 28.40 | 22.59 | 22.74 |
| 9 | 850 | 30 | 41 | TB | 0 | 0 | 0 | 26.86 | 23.29 | 22.59 |
- Note: DP is pressure drop.
3.5.1. Coefficient of Variance as Response Parameter
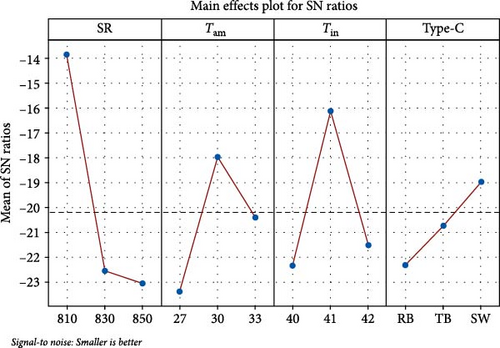
Table 6 presents Taguchi analysis results, highlighting the impact of different factors like SR, temperature in (Tin), ambient temperature (Tam), and type of the enhancement methods (Type-C) of the drying uniformity. Among these factors, Tin was identified as the most influential, indicating that fluctuations in inlet temperature significantly affect moisture removal rates. Precise control of Tin is essential to ensuring stable heat distribution and minimizing drying in consistencies. The second most influential factor was Type-C, highlighting the importance baffles, swirlers, and other configurations influence turbulence and moisture distribution, meaning an optimized configuration can reduce drying variability. SR) ranked third suggesting that while it plays a role in drying uniformity, its impact is moderate compared to Tin and Type-C. The least influential factor was Tam, indicating that ambient temperature and humidity have minimal impact on drying uniformity. While external conditions can contribute to slight variations, their effect is much smaller than that of heat input factors like Tin and SR. Overall, optimizing Tin and Type-C should be prioritized to enhance drying uniformity, while managing SR exposure can further improve stability. Controlling ambient conditions may offer minor benefits but is not as critical as adjusting the primary heat and airflow parameters. The best combinations are SR level 3, Tam level 1, Tin level 1, and Type-C level 1 as shown in Figure 17.
| Level | SR | Tam | Tin | Type-C |
|---|---|---|---|---|
| 1 | 1.2683 | 1.7331 | 0.8941 | 0.7403 |
| 2 | 2.0883 | 1.5459 | 1.2597 | 1.9094 |
| 3 | 1.2791 | 1.3567 | 2.4819 | 1.9860 |
| Delta | 0.8201 | 0.3764 | 1.5879 | 1.2458 |
| Rank | 3 | 4 | 1 | 2 |
3.5.2. Pressure as Response Variable
The Taguchi analysis results considered the pressured drop of the flow enhancement materials used within the dryer as response variables are depicted in Figure 18. SR was the most influential factor as shown in Table 7. Variations in SR significantly impact temperature gradients and airflow behavior, leading to fluctuations in pressure resistance within the system. The second most significant factor was Tin. Maintaining a stable Tin is essential to ensure a balanced pressure profile, preventing excessive resistance buildup or inefficiencies in the drying chamber. Type-C ranks third indicating that the design of baffles, swirlers, or duct systems influences airflow resistance. Poorly designed configurations can create air stagnation zones or excessive turbulence, leading to uneven pressure distribution. Optimizing these components by fine-tuning baffles or swirlers can enhance airflow uniformity and reduce pressure drop variations. Finally, Tam have the least impact. The optimal combination is SR level 2, Tam level 3, Tin level 3, and Type-C level 3 (swirler) (Figure 18).
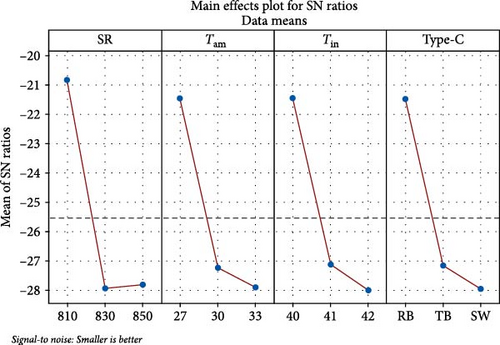
| Level | SR | Tam | Tin | Type-C |
|---|---|---|---|---|
| 1 | −20.85 | −21.46 | −21.46 | −21.47 |
| 2 | −27.94 | −27.24 | −27.13 | −27.16 |
| 3 | −27.81 | −27.90 | −28.01 | −27.96 |
| Delta | 7.10 | 6.45 | 6.55 | 6.49 |
| Rank | 1 | 4 | 2 | 3 |
4. Conclusion
The study investigates the impact of selected factors on the solar drying system and explores methods to improve the uniform distribution of air within the system. To address these issues, enhancement tools such as triangular and rectangular baffles and a swirler were employed to improve drying uniformity within the dryer. The findings indicate that the integration of these airflow enhancers significantly improves moisture uniformity during the drying process of golden apple slices in a solar dryer.
Taguchi optimization analysis was to evaluate the performance of the flow enhancement tools used and to select the optimal combination and its flow uniformity. Four critical control parameters are varied during the experiments: SR, ambient temperature, inlet temperature to the drying chamber, and integration of baffles. The response parameters measured include mass uniformity, temperature distribution, and pressure drop. The Taguchi analysis focuses on minimizing the S/N ratio, adhering to the principle that SB. The heated temperature entering the dryer (Tin) and solar intensity (SR) are the most dominant factors influencing the drying process. These parameters also play a crucial role in drying uniformity. The enhancement methods have a significant impact on drying uniformity, as indicated by the Taguchi results.
5. Limitations and Future Directions
5.1. Limitations
- •
Seasonal constraints: The study was conducted under specific seasonal conditions, which may not fully represent year-round drying performance.
- •
Configuration scope: Only three flow-enhancing methods (rectangular baffles, triangular baffles, and swirlers) were tested. Other geometries (e.g., curved deflectors and perforated plates) or hybrid designs might improve outcomes.
- •
Combination effects: The interaction of multiple enhancements (e.g., baffles + swirlers) remains unexplored.
- •
Installation positioning: Enhancements were limited to the plume area; integrating them in other chamber zones could yield further benefits.
- •
Product quality metrics: Postdrying attributes (color, texture, and nutritional retention) were not assessed, which are critical for commercial viability.
- •
Economic and environmental gaps: The economic feasibility and environmental impact assessment was not conducted.
5.2. Future Directions
- •
Conduct multiseason trials to evaluate performance under varying climatic conditions.
- •
Test novel geometries (e.g., perforated plates) and hybrid configurations (e.g., baffles with angled swirlers).
- •
Investigate synergistic effects of combined enhancements across different chamber zones.
- •
Assess postdrying product quality (color and texture) to align with industry standards.
- •
Perform economic feasibility studies, including lifecycle cost analysis and environmental impact quantification.
Nomenclature
Abbreviations
-
- a/H:
-
- rib relative tip width (m)
-
- AOUT:
-
- radiometric analog voltage output
-
- Asah:
-
- area of the solar dryer (m2)
-
- Ad:
-
- area of the dryer (m2)
-
- Cd:
-
- discharge coefficient ranges 0.6 to 0.9 for most orifices
-
- cDAQ:
-
- compact data acquisition
-
- Cp:
-
- specific heat capacity (kJ/kg/K)
-
- CH:
-
- drying chamber
-
- e/H:
-
- rib relative height (m)
-
- Fr:
-
- friction factor
-
- hc:
-
- heat transfer coefficient (W/m2·K)
-
- h:
-
- hour
-
- g:
-
- gram
-
- Ir:
-
- the amount of radiation striking collector’s plane (W/m2)
-
- IR:
-
- inertia resistance factor (kg/m2)
-
- Iav:
-
- average solar intensity (W/m2)
-
- LB:
-
- larger is better
-
- :
-
- mass flow rate (kg/s)
-
- mf:
-
- final mass of the sample at the end of the time (g)
-
- mi:
-
- initial mass of the sample (g)
-
- md:
-
- mass of the dried sample at time t (g)
-
- Mc:
-
- moisture content (%)
-
- mw:
-
- mass of the wet sample at time t (g)
-
- NB:
-
- nominal the better
-
- Nu:
-
- Nusselt number
-
- P/H:
-
- rib relative pitch rib
-
- Psat:
-
- saturated vapor pressure (N/m2)
-
- RB:
-
- rectangular baffles
-
- RH:
-
- relative humidity (%)
-
- RTD:
-
- resistance temperature detector
-
- s/(H-a):
-
- rib front projection
-
- SAH:
-
- solar air heater
-
- SB:
-
- smaller is better
-
- SW:
-
- swirler
-
- t, T:
-
- time (s), temperature (°C)
-
- Tam:
-
- ambient temperature (°C)
-
- TB:
-
- triangular baffles
-
- td:
-
- total drying time (h)
-
- VDD:
-
- power supply voltage
-
- WO:
-
- without
-
- WRR:
-
- weight reduction rate
Subscript
-
- a:
-
- air
-
- am:
-
- ambient
-
- i:
-
- in, initial position
-
- o:
-
- out, final position
Conflicts of Interest
The authors declare no conflicts of interest.
Author Contributions
Halefom Kidane: writing – original draft, review and editing, visualization, validation, data curation, conceptualization. Istvan Farkas: supervision, editing. Janos Buzas: editing, supervision.
Funding
The authors received no specific funding for this work.
Acknowledgments
This work was supported by the Stipendium Hungaricum Program and by the Doctoral School of Mechanical Engineering, Hungarian University of Agriculture and Life Sciences, Gödöllő, Hungary.
Open Research
Data Availability Statement
The data supporting the findings of this study are available from the corresponding author upon request.


