Karst Hydrocarbon Reservoir Characterization and Sweet Spot Prediction in the Western Tazhong Oilfield, China
Abstract
The Ordovician carbonates in the Tarim Basin’s central uplift zone are crucial for oil and gas exploration. A comprehensive analysis has been conducted utilizing 3D seismic imaging, logging, core samples, and production tests to explore its potential. The results indicate that dissolution within the Ordovician reservoir, attributed to an intricate fault system involving karstification and faulting, enhances hydrocarbon storage. Both structural and dissolution-induced fractures are vital for efficient hydrocarbon flow. NE-SW strike-slip faults significantly impact the distribution of carbonate reservoirs, particularly in early karst strata with higher porosity. Seismic sections reveal three distinct reflection patterns: full, single peak, and chaotic. The forward seismic model shows that oil/gas saturation influences seismic energy. High-yielding wells are located in formations with full-waveform patterns and high energy, indicating high porosity. A strong correlation exists between Class I seismic phases and high-porosity zones. Daily production in these zones ranges from 30 to 70 tons, validating the evaluation methods. The Yijianfang formation excels in oil storage due to its karst features and numerous unfilled tectonic and dissolution fractures, offering ample storage and permeability. High production is seen in strata with porosity >4.5%, but fractures alone do not ensure high production. Structural activity, occurring mainly during the meso-deep burial stage, allows acidic solutions to permeate structural fractures, leading to further dissolution. Karstification is confined to depths within 80 m of the Yijianfang formation top, indicating significant exploration potential.
Summary
- •
High-yield wells correlate with full-waveform seismic patterns indicating porous layers.
- •
Seismic data and inversion techniques effectively pinpoint high-porosity oil reservoirs.
- •
The karst-rich Fm. O2y stratum offers exceptional oil storage capacity.
1. Introduction
Carbonate, a sedimentary rock abundant in hydrocarbons, serves as a crucial reservoir for hydrocarbon exploration and extraction, ~47.5% of the world’s recoverable hydrocarbon reserves (about 200 × 109 t) originate from carbonates [1–3]. Carbonate hydrocarbon exploration targets deeper fields, with geological variations leading to diverse “deep” definitions globally. In China’s petroleum industry, strata deeper than 4500 and 6000 m are considered deep and ultra-deep, respectively. Proven rates for these reservoirs are low, at 3.9% and 5.7%, despite exploration progress [4–8]. Deep carbonate oil and gas is now a prime focus in China’s hydrocarbon exploration. The Tarim Basin, located in southern Xinjiang, China, stands out as the country’s largest hydrocarbon-bearing basin [9]. The average oil resource abundance in the basin is 15.99 × 10⁴ t/km2, with carbonate oil resources averaging 25.31 × 10⁴ t/km2 [10]. The Tarim Basin currently produces 30.8 × 10⁶ t of oil and gas annually, with a yearly increase of 1 × 10⁶ t, cumulative production exceeding 30 × 109 t, and ranks third in China. Over 40 significant hydrocarbon fields have been discovered, holding proven reserves of ~17.8 × 10⁹ t. Notably, Paleozoic carbonate reservoirs, buried deeper than 4500 m, constitute one-third of these reserves (>5 × 10⁹ t) and possess substantial development potential.
The Paleozoic giant carbonate deposit in the central uplift of the Tarim Basin provides a good reservoir space for hydrocarbon resources [7, 11–13]. Large cavernous reservoirs are prime targets for oil and gas drilling due to their ample storage capacity. Small pores and fractures, hard to detect in seismic data, enable fluid communication between reservoirs, ensuring efficient hydrocarbon transport [14–18]. Exploratory wells in northwest Tazhong have confirmed highly productive oil and gas flows, establishing the Lower Paleozoic formation as a key target for Tazhong’s hydrocarbon exploration. However, locating the sweet spot remains challenging, primarily due to the strong reservoir inhomogeneity [19–23]. The inhomogeneity inherent in carbonate reservoirs manifests in the discontinuous distribution of hydrocarbons, characterized by consistent oil–water contacts within individual strata but displaying variations across neighboring layers. This inhomogeneity gives rise to intermittently distributed sweet spots, complicating the identification of optimal reservoirs. The significant depth of the formation (>6000 m) has led to substantial compaction of the tuff, resulting in poorly formed primary pore fractures, yields low porosity (ranging from 0.5% to 4.5%), and limited permeability (0.1–1 mD) [24–26]. Nonetheless, tectonic shifts have induced weathering and dissolution processes, locally augmenting porosity and permeability, thereby enabling efficient hydrocarbon migration and accumulation. Therefore, the meticulous delineation and evaluation of high-quality reservoirs are of paramount significance, necessitating a profound understanding of hydrocarbon distribution patterns within these geological strata.
The research primarily focuses on the deep Paleozoic Ordovician Lianglitage Formation (Fm. O3l) and Yijianfang Formation (Fm. O2y). By conducting core physical property tests and employing FMI logging analysis (Fullbore Formation Micro-Imager), the study precisely identifies the physical attributes and vertical pore-fracture distribution patterns within high-quality reservoirs. Through a comprehensive analysis of data from successful exploration wells, coupled with seismic response evaluations, the regional distribution traits of fractured carbonate oil and gas sweet spots within the study area are revealed. The results will offer substantial theoretical backing for future explorations into deep-sea carbonate oil and gas geology and engineering endeavors.
2. Geological Setting
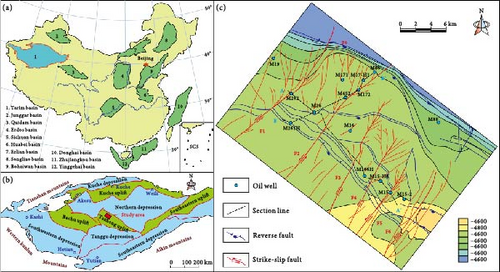
The Tarim Basin is situated in northwest China (Figure 1a), and the Tazhong oil and gas field is located in its central tectonic uplift zone (Figure 1b). The formation and evolution of the Tazhong uplift are originated from the Precambrian basement, initially shaped during the Caledonian period and further refined by the middle Caledonian episodes I and II and the Hercynian transformation [27–29]. In the study area, the F0 fault serves as the key controlling structure for petroleum reservoirs. It ruptures the basement in the middle Caledonian, with fault displacement increasing westward. F0 penetrates downward through the Cambrian system to the basement and terminates in the Upper Ordovician Santamu Formation (O3s). Additionally, two distinct groups of secondary faulting zones are developed: one comprises reverse faults that run parallel to the F0 and mainly formed towards the last Caledonian, closely associated with the Cambrian-Ordovician formation; the other consists of strike-slip faults that are perpendicular to F0 and primarily developed during the early Hercynian, affecting layers at the base of the Cambrian-Carboniferous system. These fault systems exert a crucial role in shaping the tectonic and reservoir characteristics within this region, thereby exerting a significant influence on the accumulation and transportation of oil and gas.
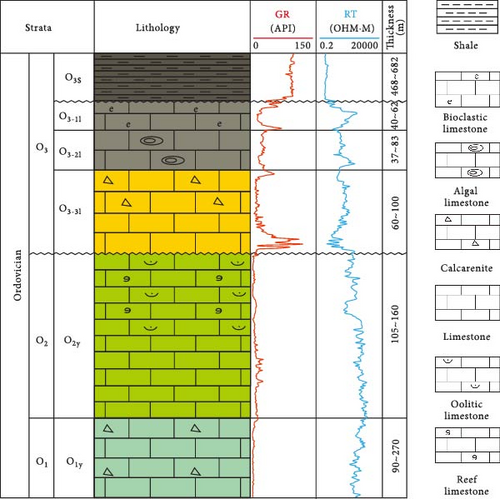
The study area is a shelf region with gentle tectonics, featuring strata dipping at about 1°, steepening near the F0 fault. The target reservoir, Ordovician tight carbonate, consists of the Upper Ordovician Santamu (O3s), Lianglitag (O3l), Middle Ordovician Yijianfang (O2y), and Lower Ordovician Yingshan (O1y) Formations, the Middle Ordovician Tumushuk Formation (O3t) is absent. Fm. O1y and Fm. O2y are composed of thick-bedded limestones containing bioclastic and reef fragments, exhibiting a conformable contact. Fm. O3t has been completely eroded, while Fm. O2y has undergone partial erosion. Fm. O3l consists of gray, thick-bedded limestones with bioclastic, reef and algal fragments, showing an unconformable contact with both the overlying Fm. O3s and the underlying Fm. O2y. serving as the cap rock of the study area, Fm. O3s comprises a thick sequence of dark gray calcareous shales (Figure 2).
3. Methodology
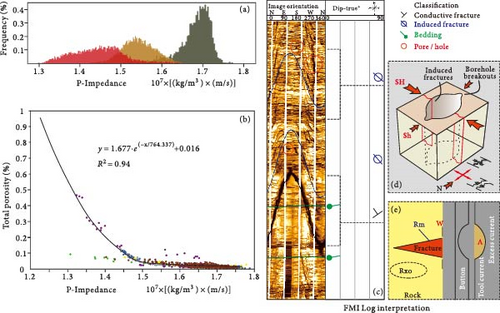
Inversion can be thought of as the process of determining the reflection coefficient rj for a given seismic tract Ti. The reflection coefficient is related to the acoustic impedance Ij of a series of layers. Consequently, inversion can also be thought of as the process of determining the acoustic impedance of the bottom layer when the acoustic impedance of the top layer is known. Here, we use the wave impedance-to-porosity transformation technique to predict and quantify the presence of reservoir communities of carbonate rock suture cavities and to predict the longitudinal location of the reservoir (Figure 3b).
- a.
Fracture aperture (Wi, mm) typically denotes the average width of multiple fracture pathways within a specified length segment (Figure 3e). The empirical formula is as follows:
- b.
Fracture average width (Faw) essentially averaging over the different apertures on the fracture surfaces. The empirical formula is as follows:
- c.
Fracture porosity (ϕ, %) is defined as the proportion of the fracture area on the wellbore wall to the total wellbore area, measured per unit length interval. The calculation formula is as follows:
4. Petrologic and Geophysics Features
4.1. Petrology and Petrophysics
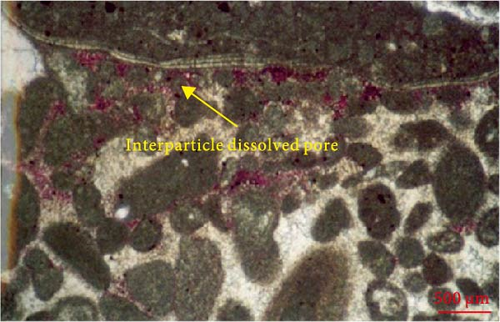
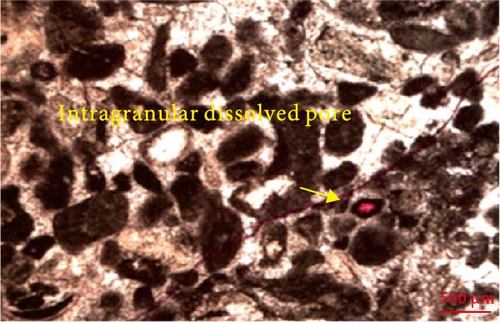
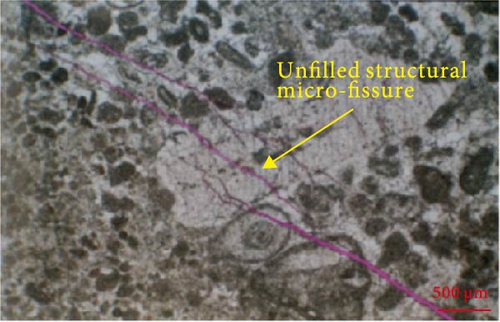
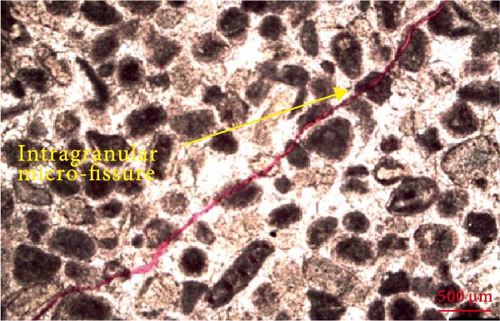
Microscopic storage spaces primarily consist of fractures and pores, with pores further classified as intergranular, intragranular, and some dissolved pores. Based on plane porosity calculation, intragranular pores dominate, making up 60.4% of samples, followed by interparticle dissolved pores, which serve as the main effective storage spaces (Figure 4a,b). Slices reveal the presence of numerous micro-fissures, ~60% of which are structural fissures (Figure 4c,d). The slices further suggest that carbonate rocks do not inherently possess high-quality reservoir attributes. Moderate tectonic activities and solution stripping facilitate their development into favorable reservoirs by preserving pore spaces and creating fractures.
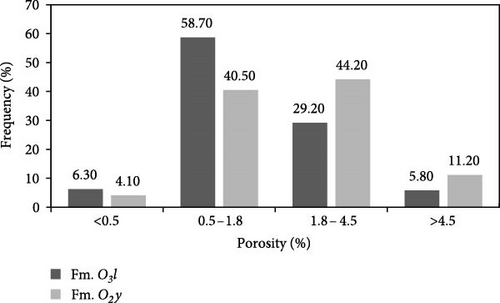
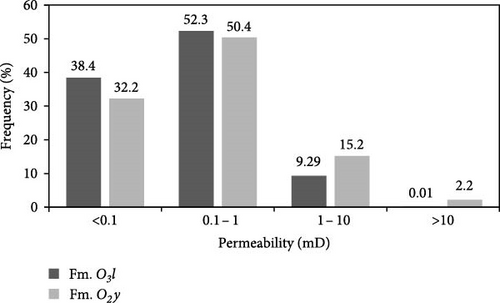
Fm. O3l consists of interlayered sediments with varying thicknesses, including granular limestone, micritic limestone, and aphanitic limestone. In contrast, Fm. O2y shows the most favorable lithofacies for reservoir accumulation in the studied region, primarily characterized by thick beach-phase deposits dominated by bright crystal sand (gravel) limestone and micritic limestone. According to actual porosity and permeability measurements, Fm. O3l’s porosity ranges from 0.09% to 5.21%, with an average of 1.45%. Meanwhile, Fm. O2y’s porosity varies between 0.22% and 6.74%, averaging at 1.97% (Figure 5a). In terms of permeability, Fm. O3l demonstrates values ranging from 0.011 μm2 to 5.8 × 10⁻³ μm2, averaging at 0.33 × 10⁻³ μm2. On the other hand, Fm. O2y’s permeability spans from 0.015 μm2 to 5.32 × 10⁻³ μm2, with a mean of 0.53 × 10⁻³ μm2 (Figure 5b). In summary, both porosity and permeability metrics of Fm. O2y consistently outperform those of Fm. O3l, indicating its superior reservoir characteristics.
4.2. Logging Reservoir Characteristics
The Ordovician carbonate reservoirs in the study area can be classified into three types: cave, pore, and fracture pore. The cave-type reservoir, primarily featuring large caves (serious borehole expansion with C14, C25, C36 exceeding 500 mm) as the main storage space, is located at the top of Fm. O2y and controlled by interlayer unconformity karstification. Dissolved pores, weathered fractures, and structural fractures contribute to its formation, enabling high and stable production upon drilling (Figure 6a). In contrast, the pore-type reservoir, prevalent in various platforms and shelf edges, is formed by dissolution pores that may later recrystallize or fill, reducing their physical properties, although unmodified reservoirs maintain good properties and high capacity (Figure 6b). Lastly, the fracture pore-type reservoir, characterized by well-developed pores and fractures that complement each other as storage and permeable pathways, shows a quasi-layered distribution mainly in the granular limestone sections of Fm. O3l and Fm. O2y. With excellent storage capacity and hydrocarbon potential, it is deemed a crucial reservoir type in the study area (Figure 6b).
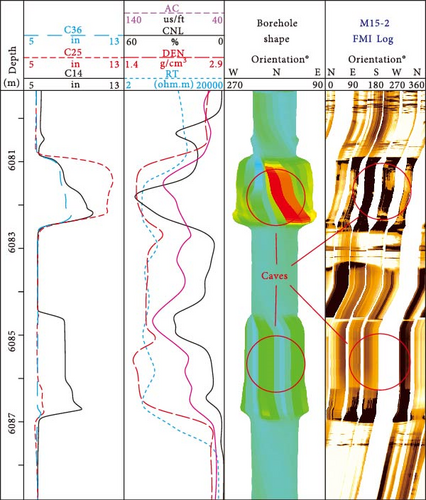
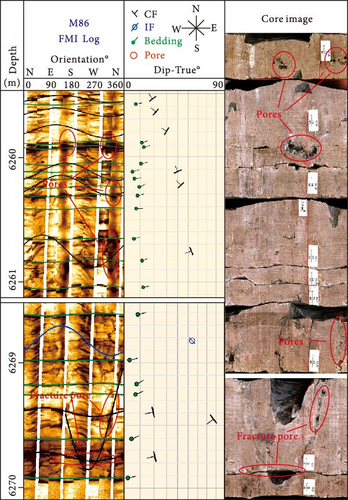
The classification of reservoir types is not merely based on mathematical statistics following image observation or on logging data intervals alone. Rather, it is a comprehensive determination that takes into account both the distinct image features of different reservoir types, as presented in Figure 6 and shown in Table 1, and the various logging values that have relatively distinguishable ranges at the data level. Both imaging and data play an equally crucial role in the actual geological exploration of this area, ensuring a more accurate and reliable classification of reservoir types. Table 1 outlines the conventional logging curve features for various reservoirs in the study zone. Carbonate bedrock has distinct properties: high density, resistivity, and low spacing transmission time, with curve changes reflecting minor lithological shifts. In fractured porous reservoirs, fluid content contrasts with the bedrock, leading to lower density and resistivity but higher acoustic travel time, wellbore diameter, and neutron porosity as pores multiply.
| Logging | Baseline | Pore | Fracture-pore | Cave | Muddy filled cave |
|---|---|---|---|---|---|
| RT, Ω•m | >4000 | 100–4000 | 60–4000 | <60 Ω•m | <100 |
| AC, us/ft | <48 | >48 | >48 | >80 | 60–80 |
| CNL, % | ≈0 | >2% | >2% | 10%–25%, seldom > 25% | 0–20% |
| DEN, g/cm3 | ≥2.71 | Fluctuation | <2.71 | <2.35 | ≈2.65 |
| GR, API | <15 | <15 | <15 | <60 | >90 |
| CAL, in | None | None or slight | None or slight | Serious | None |
- Note: RT~ture resistivity; AC~acoustic logging; CNL~Neutron porosity; DEN~density; GR~Gamma ray logging; CAL~Caliper, because wellbore diameter is not uniform, the data in the table are represented by borehole expansion degree.
Based on analysis and interpretation statistics of reservoirs in Fm. O3l and Fm. O2y within the study region, the reservoir types are mainly pore-type and fracture–pore-type reservoirs, with thin cave-type reservoirs developed locally, and pure fracture-type reservoirs are not developed (Figure 7a). The reservoir type of the Fm. O2y consists mainly of pore and fracture-type reservoirs, and fracture and cave-type reservoirs are developed locally.

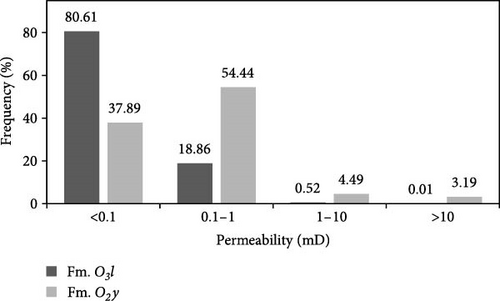
Data from 12 representative wells in the study region reveals that porosity values for Fm. O3l and Fm. O2y predominantly falls between 1.8% and 4.5%. However, Fm. O2y displays a notably higher proportion of porosity values exceeding 4.5% compared to Fm. O3l. Regarding permeability, Fm. O3l’s values are mostly in the 0.01–0.1 × 10⁻³ μm2 range, whereas Fm. O2y’s values cluster in the 0.1–3 × 10⁻³ μm2 range. Overall, Fm. O2y beads exhibit higher porosity and permeability values than those from Fm. O3l (Figure 7b).
4.3. Seismic Reservoir Characterization
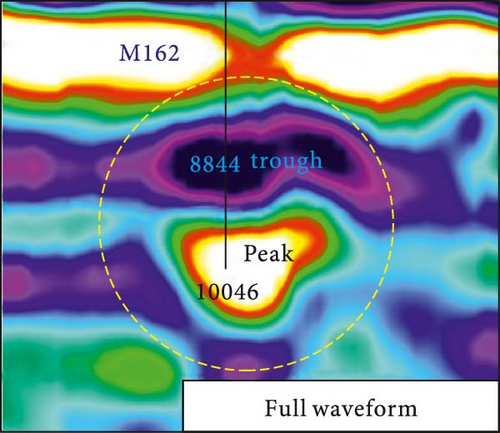
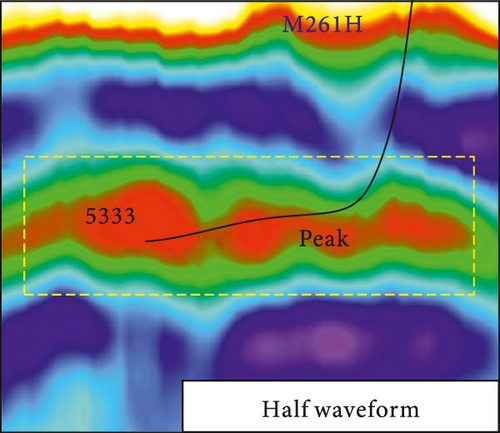
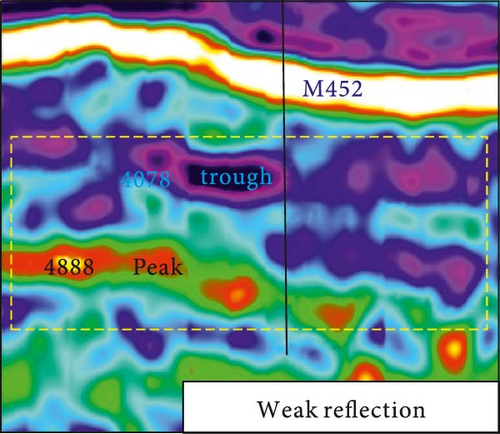
The degree of reservoir development in the study area is not only related to the seismic waveform morphology but also closely linked to the reflection intensity within the waveform. There are mainly three types of combinations of troughs and peaks in seismic data: the first is a full waveform with troughs and peaks appearing in pairs, both possessing strong amplitude energy (Figure 8a). The second is half waveform that the energy of the trough (peak) is strong, but the corresponding peak (trough) energy is weak, known as a single peak or single trough (Figure 8b). The third is weak reflection, also known as chaotic reflection, where both the energies of troughs and peaks are weak, and it is difficult to exhibit reflection characteristics (Figure 8c). The substantial difference in acoustic impedance between oil, gas, water, and carbonate rock results in significant heterogeneity. Increased difference amplifies reflection, signifying greater heterogeneity and more developed reservoirs. Actual drilling data verifies that paired troughs and peaks are indicative of reservoir development, with energy intensity reflecting its extent. Therefore, using waveform characteristics to predict reservoirs is a key aspect in dividing seismic facies.
In order to relate reservoir development to seismic reflection intensities, seismic forward modeling was used to design the geologic model, as shown in Figure 9a. The green region corresponds to the capping layer with a longitudinal wave speed of 4500 m/s and density of 2.425 g/cm3. The limestone layer has a longitudinal wave speed of 6000 m/s and a density of 2.65 g/cm3. A 20 m-edge cube cave geological body, with a filling degree of 0% to 90% (1–9 in Figure 9a), and a speed of 5400 m/s when the tunnel is unfilled. It can be seen from the forward modeling results (1–9 in Figure 9b) that the response characteristics of the unfilled hole are the strong wave valleys and the peaks of alternating waves, which result from reflection interference at the upper and lower interfaces of the hole. The magnitude of the seismic reflection does not change significantly with increasing degree of fill.
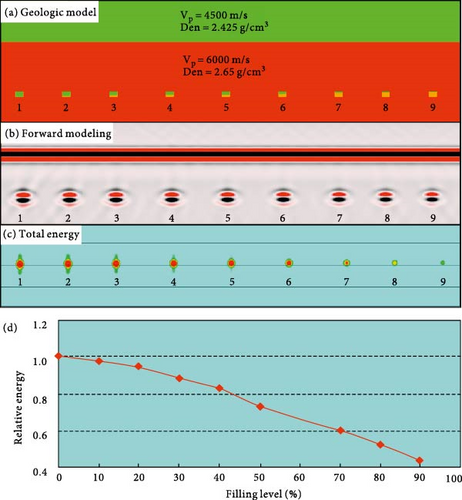
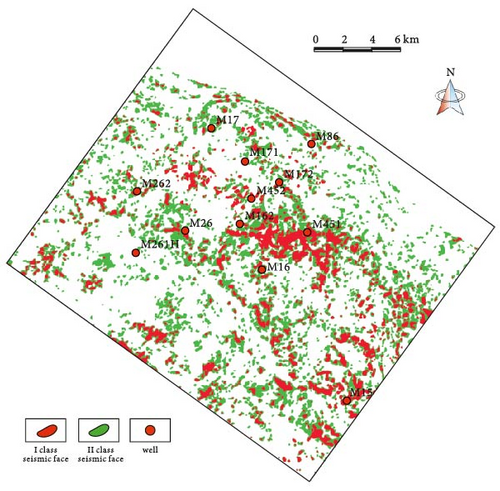
However, the variation in energy properties is more obvious (Figure 9c,d). The degree of fracture–pore reservoir development is related to its seismic reflection intensity. The more developed the reservoir, the higher its reflection energy, so the seismic reflection intensity can be used to characterize the degree of reservoir formation. According to the characteristic of complete waveform, the seismic phase distribution map of the Ordovician Fm. O2y in the study area was prepared based on the intensity of the seismic reflection energy, taken together with the results of seismic forward modeling of the total energy magnitude and other attribute data (Figure 10). In the figure, red is the Class I seismic phase and green is the Class II seismic phase. The complete strong-energy waveform is classified as Class I seismic phase, whereas the single high-energy peak and tough and the complete relative-strong-energy waveform are classified as Class II seismic phases.
4.4. Reservoir Hydrocarbon-Bearing Properties
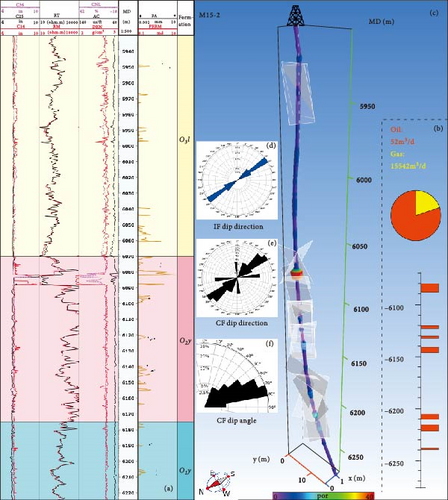
Figure 11a shows that while there is no obvious relationship between fracture aperture size (FA) and permeability (PERM), permeability is present in the intervals where natural fractures (CF) are developed, serving as the primary conduit for communication between caves and pores. The major production capacity of the well comes from seven sections (Figure 11b), and these sections of high porosity reservoir (average porosity around 15%, locally greater than 30%) can be seen in the 3D wellbore in Figure 11c, accompanied by the development of natural fractures. Of these, 6080–6090 m is a dissolution cave, with a diameter (C14, 25, 36) of more than 0.25 m (10 in.) and a cave length of about 10 m (Figure 11a). The remainder of the producing formation has a porosity between 10% and 15% and permeability between 0.4 and 3 md, which is a good property reservoir to achieve high yield oil flow. As a result, higher porosity and permeability reservoirs can be seen to be of good quality and high capacity. Furthermore, on the basis of the IF pick-up and judgement (Figure 11d), a maximum horizontal principal stress (σH) of 52° east of north was applied to the well, which is roughly parallel to adjacent F5 and F6 strike-slip fault zones (Figure 1c). The major development orientation of the fractures is, at the same time, fundamentally consistent with the direction of σH (Figure 11e), indicating that crustal stress generated by tectonic motion plays a significant role in modifying the reservoir of this wellbore. Moreover, there is little difference between the three fracture elements (tendency, strike, and dip angle), and the formation is dominated by mid-to high-angle (>45°) tectonic fractures (Figure 11f).
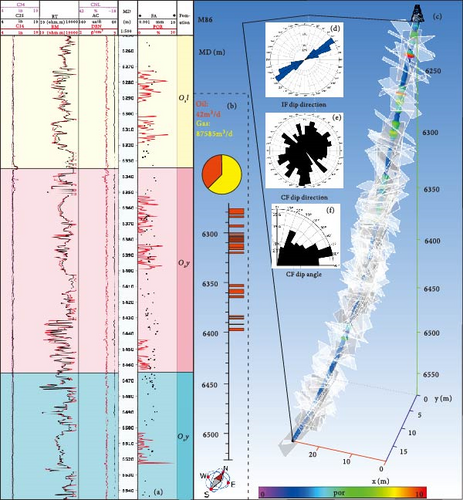
As can be seen from the imaging log, the fractures are extremely developed throughout the M86 section (Figure 12a) as well as the 3D wellbore (Figure 12c). While, many of the major producing formations in this well are concentrated in the high-porosity (POR) section (Figure 12a, b). Although the low porosity section has developed fractures, which increase the permeability of the formation, the pores are the primary gathering place for hydrocarbon-bearing gas, and the section without better porosity is not highly oil-bearing and it is difficult to obtain industrial oil flow. At early times, the σH direction (Figure 12d) of the well is expected to be affected by the main thrust fault at Tazhong, and a large number of fractures in the north by west direction (305°) were generated in the first place. At late times, due to the influence of adjacent strike-slip faults, at present, the σH direction is nearly parallel to the main strike-slip fault F2 (Figure 1c), and large numbers of fractures around 50° north by east are generated as well (Figure 12e). Under the action of the combined force, the process of mutual transformation of two kinds of stress also causes structural fractures with different orientations and angles to develop one after the other. The well is simultaneously developed with a large number of dissolution fractures formed as a result of dissolution of the formation water, and there are two kinds of dissolution fractures: one is a tectonic fracture generated prior to the dissolution of the formation water, and all three of the elements of this type of dissolution fracture (dip, tendency, and direction) of the formation are in agreement with the original tectonic fracture, which is a type of secondary structure and is affected by tectonic stresses; A type of stylolite is also present caused by forming pressure solution. Such stylolites are unaffected by crustal stress, tending to form fractures with a small angle (mainly 10°–30°) and no fixed strike in azimuth (Figure 12e, f). The intricate azimuth of natural fractures within the wellbore can also be attributed to these factors.
5. Discussion
The reservoir in the study area is mainly developed in the top strata of Fm. O2y. Comprehensive studies show that reservoir development in this reach is influenced by a variety of factors, in which weathering and stripping due to intermittent settling caused by stratigraphic uplift are the dominant drivers, followed by retrograde tectonic action and multiperiod strike-slip faulting as the most important controlling factor.
5.1. Favorable Conditions for Reservoir Formation
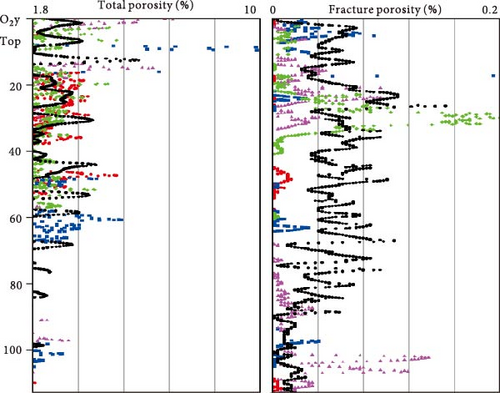
The development of massive cave type reservoirs within the Fm. O2y layer is a result of the synergistic effects of Karstification and Tectonization. Karstification, driven by meteoric water infiltration during uplift and exposure of Fm. O3t to surface conditions, creates dissolution fissures and cavities, significantly enhancing the storage space. This process is closely related to structural activity, which predominantly occurs during the meso-deep burial stage. Structural movements cause acidic solutions enriched with organic acids and carbon dioxide to exploit structural fractures, leading to further dissolution of the rock matrix. The resulting reservoirs are concentrated within a 0–80 m range beneath the top of the Fm. O2y layer (Figure 13).
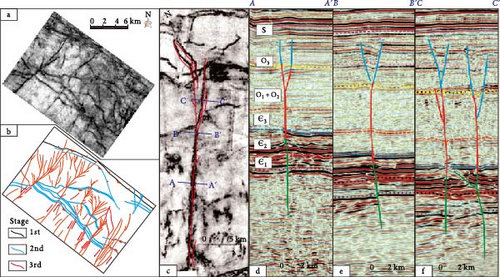
The interaction between Karstification and structural impacts is conspicuous in the fault development within the Paleozoic carbonates. The ant body image (Figure 14a) reveals that the development of faults in Paleozoic carbonates can be divided into three phases. Faults formed during the Middle Caledonian (Black faults in Figure 14b) have been influenced by subsequent multiple tectonic events, giving rise to a complex fault network. The subsequent formation of thrust faults (Blue faults in Figure 14b) in response to compressive stress from the southeast led to a series of arc-shaped thrust belts. As the regional compressive stress increased during the Silurian-Devonian, the arc-shaped thrust belts were incapable of absorbing the stress, resulting in the fracturing of the entire formation and the generation of the third-phase northeast-trending strike-slip fault system (Red faults in Figure 14b). These strike-slip faults are generally steep and upright with upward-developing branching faults (Figure 14c) and bifurcate from Fm. O1y, primarily developing in Fm. O2y (Figure 14d), Fm. O3l (Figure 14e) and Fm. O3s (Figure 14f). Thus, Karstification and structural impacts are not independent processes, but rather they interact and reinforce each other to create favorable conditions for reservoir formation.
5.2. Wildcat Production Analysis and Sweet Spot Prediction
5.2.1. Trial Production Characteristics and Productivity Analysis
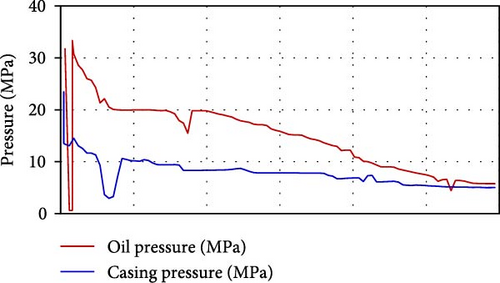
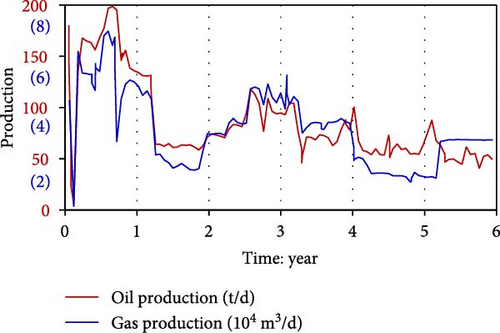
Current average daily oil production and gas production per well in the study area are 73 t and 3.0 × 10⁴ m3 respectively, accompanied by a comprehensive water cut of 13.6% and a gas–oil ratio of 414 m3/t. Well testing can be categorized into three groups based on variations in oil pressure, production, and water cut. (1) Group I wells are characterized by high and stable production, absence of water production, and gradual decline in productivity. These wells contribute to 80.0% of the total production in the study area, with an average cumulative oil production per well reaching 5.4 × 10⁴ t (Figure 15a); (2) Group II wells are characterized by simultaneous oil and water production along with fluctuating water output. These wells contributed to 17.5% of the overall well area’s total production, averaging a cumulative oil output per well at 1.2 × 10⁴ t; (3) Group III wells exhibit a rapid increase in water production. They accounted for only 2.5% of the total production in the well area, with an average cumulative oil production per well at 0.35 × 10⁴ t (Table 2).
| Group | Oil-gas production (t/d) | Cumulative production (t) | Production contribute ratio (%) |
|---|---|---|---|
| Ⅰ | 5.4 × 10⁴ | 48.4 × 10⁴ | 80.0 |
| Ⅱ | 1.2 × 10⁴ | 10.6 × 10⁴ | 17.5 |
| Ⅲ | 0.35 × 10⁴ | 1.5 × 10⁴ | 2.5 |
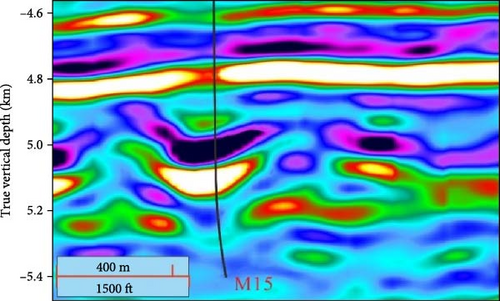
This article analyzes the significant contribution of Group I oil wells to overall production in the study area, using M15 as a prime example. With an initial oil pressure of 32 MPa (Figure 15a), daily oil output of 180 t, and gas production of 57,370 m3 (no water content) (Figure 15b), M15 exemplifies these wells’ productivity. The test production curve shows a steady decline in oil pressure at 0.014 MPa per day, while Figure 15c highlights the surrounding fracture cavities’ robust energy replenishment.
5.2.2. Geostatistical Reservoir Characterization
In the near east-west section of the wave impedance of the well zone (Figure 2c for the connected well profile), the red-yellow clumps are more concentrated in the range 0–27 ms below the upper surface of Fm. O2y (between the two dashed lines), which exhibits relatively low wave impedance characteristics and a more continuous near-laminar distribution laterally (Figure 16a). The remainder of the strata are dominated by the large blue-green high impedance sets, and the red-yellow areas are sparsely distributed and poorly connected to one another; at the same time, in the near north-south section of the well zone (Figure 16b), the reservoir is similar to the east-west section along the longitudinal direction, and the low-impedance values are primarily concentrated in the 0–27 ms range below the upper surface of Fm. O2y.
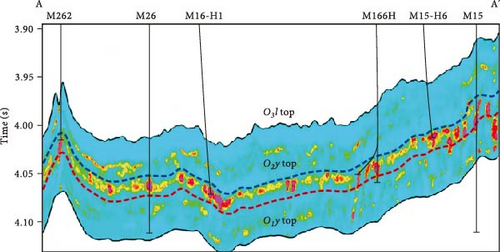
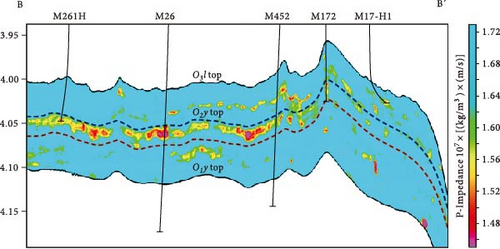
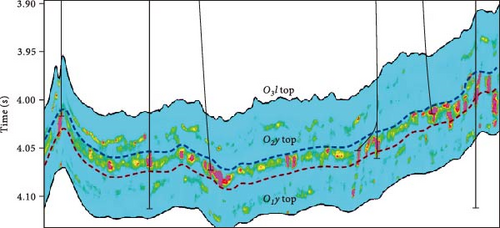
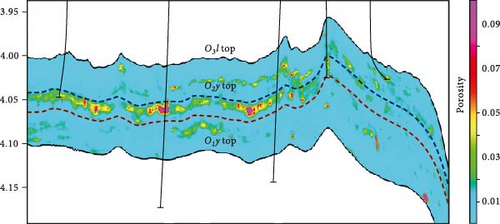
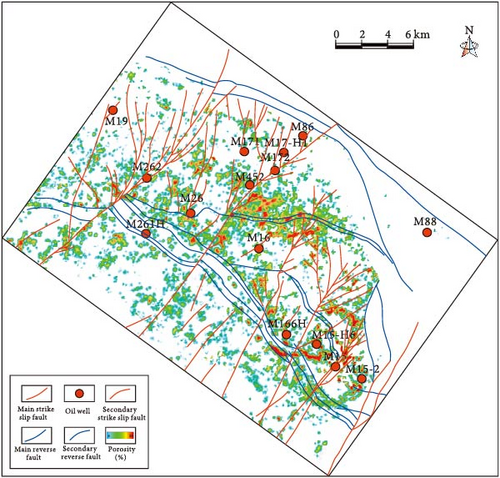
After classifying reservoir types based on wave impedance, we analyzed the porosity distribution of each type using logging porosity data. This analysis established the relationship between porosity and wave impedance for every reservoir type (Figure 3b), effectively transforming the wave impedance data into a more intuitive porous body representation (Figure 16c,d). The pink distribution in the northeastern section of the M172 well in the O2y study area is notably lower, indicating low porosity. Consequently, the O2y reservoir is less developed in this part of the work area. However, the overlying O3l and underlying O1y occasionally exhibit high-porosity reservoirs interspersed within the pink phases. Based on current exploration and development findings, the effective reservoir section of O2y in this area is generally believed to span 80 m below the upper surface of O2y. Figure 16a,b reveal numerous high-porosity reservoirs around the M15 well, potentially linked to sustained oil pressure stability and high cumulative oil and gas production (Figure 13a). A scarcity of high-porosity reservoirs in the vicinity can hinder the rapid replenishment of extracted oil and gas, leading to increased water content over time due to reduced casing pressure. Using logging porosity as a foundation and employing the seismic wave impedance model as spatial constraints, we constructed a porosity model for each reservoir type via the kriging synergistic simulation method. This approach yielded a continuous porosity model for fractures and caves, aligned with the continuous structural model. The porosity plane closely resembles the seismic phase reservoir classification plane (Figure 10), indicating that seismic phase I reservoirs boast relatively high porosities, making them prime locations for oil and gas storage.
According to the model, the effective pore thickness of Fm. O2y in the study area has an obvious nonuniform distribution in the plane (Figure 17), mainly along the sides of the strike-slip fault, with the largest thickness of nearly 50 m in the southeast of the well area, followed by the central part of the well area. This methodology is specifically tailored to scenarios characterized by pronounced fault development and carbonate reservoir layers that have undergone weathering and modification as a result of stratigraphic uplift. To ascertain its general applicability, we intend to implement this method across multiple regions for validation purposes. Additionally, we will embark on a more comprehensive investigation to assess the precision of this approach in predicting oil and gas sweet spots.
6. Conclusion
- 1.
Microfractures, intergranular dissolution pores, and intragranular pores are evident under the microscope, pores, and fractures are frequently observed in FMI imaging logs. The seismic section exhibits three distinct reflection patterns: full waveform, single peak waveform and chaos type. The forward seismic model proves that the degree of oil and gas filling in the cavity body will affect the relative energy and total energy. Significantly, high-yielding Wells are located in full-waveform geological bodies with high total and relative energy, which indicate high porosity layers.
- 2.
The current NE-SW trending strike-slip faults are influenced by σH in the NNE direction, thereby affecting the distribution of carbonate reservoirs, especially in early karst strata where higher porosity layers are prevalent. Class I seismic phase and high porosity zones predicted by seismic inversion exhibit strong similarity in their spatial distribution, especially in some zones with porosity exceeding 4.5%, the daily production consistently varies between 30 and 70 tons, thereby validating the practicality and efficacy of the two evaluation methods.
- 3.
The Fm. O2y stratum is superior to the Fm. O3l stratum in terms of oil storage performance. The Fm. O2y stratum is dominated by karst landforms, within which a large number of unfilled tectonic fractures, dissolution fractures, and pores have developed, providing storage space for the reservoir and enhancing permeability. High oil production can be observed in strata with a porosity exceeding 4.5%, but the mere presence of fractures does not guarantee high production. Karstification is mainly controlled within 80 m below the top of the Fm. O2y stratum and is distributed in a quasi-sequential and relatively continuous manner. Therefore, this reservoir holds tremendous potential for exploration and development.
Ethics Statement
This article does not contain any studies with animals performed by any of the authors.
Conflicts of Interest
The authors declare that they have no known competing financial interests or personal relationships that could have appeared to influence the work reported in this paper. Coauthor Jiangyong Wu, employed at Petrochina Tarim Oilfield Company, kindly shared a subset of the research data with the approval of his organization and actively contributed to the statistical analysis and data interpretation. It is important to note that the authors declare no conflicts of interest.
Author Contributions
Yingjin Wang was responsible for the overall research design, scientific illustration, data analysis, and manuscript writing. Siyu Chen contributed to the creation of figures and collected key data. Jiangyong Wu supplemented regional geological data and participated in the analysis. Yujing Qian refined the text and format and polished the grammar. Xiaowei Hou provided suggestions during the revision process, enhancing the article’s coherence. Collectively, all authors ensured the accurate communication of the research results.
Funding
This research was supported by the Fundamental Research Funds for the Central Universities JZ2023HGTA0177 and JZ2023HGQA0146; National Natural Science Foundation of China 42002189 and 42102208.
Acknowledgments
This research was supported by the Fundamental Research Funds for the Central Universities JZ2023HGTA0177 and JZ2023HGQA0146; National Natural Science Foundation of China (10.13039/501100001809) ∗ 42002189 ∗ 42102208.
Open Research
Data Availability Statement
The data that support the findings of this study are available on request from the corresponding author. The data are not publicly available due to privacy or ethical restrictions.


