Optimization Scheduling Method for Integrated Energy System Considering Weight Sensitivity and Flexible Load
Abstract
The multiobjective optimization problem in the integrated energy system (IES) is crucial for achieving optimal scheduling of the system. This paper proposes a weight optimization method for IES scheduling based on the weight sensitivity (WS) index. First, an IES coupling network model is established, considering the network structure of the power grid, natural gas network, and heating network. The time-of-use price is determined based on generation resources to guide the demand for flexible load (FXL). Next, the weights of the multiobjective function are optimized using the coefficient of variation of the WS index. The analytic hierarchy process (AHP) is utilized to achieve multiobjective function weight optimization, considering environmental friendliness and installed capacity. The optimal scheduling model is solved using CPLEX, and the results of different weight optimization methods are compared. The change in the carbon emission (CE) index under the increasing permeability trend is analyzed, and the guiding effect of intraday prices based on power generation resources on FXL is studied. The simulation results demonstrate that: (1) Single-objective weight optimization based on the WS index reduces the objective function value by 0.47%, and the objective function value based on AHP, considering multiobjective weight optimization, decreases by 10.31%, indicating that the WS index is suitable for comprehensive weight optimization. (2) As the IES permeability increases by 46.31%, the IES CE decreases by 94.69%, and the demand for energy storage increases by 7.32%. (3) Under the guidance of time-of-use prices based on power generation resources, 51.47% of FXL autonomously shifts power consumption time, reducing electricity purchase fees by 24.61%. This paper provides valuable insights for utilizing the WS index to optimize IES scheduling.
1. Introduction
The integrated energy system (IES) has garnered significant attention for its capacity to efficiently utilize various forms of energy and capitalize on their complementary characteristics [1, 2], the complexity of scheduling tasks within the energy network stems from diverse energy sources, and adaptable energy conversion processes [3]. In this competitive landscape, the effectiveness and efficiency of IES optimal scheduling outcomes hinge on successfully optimizing multiobjective functions involving multiple stakeholders.
In the context of the IES, integrating power generation, consumption, and various energy service providers necessitates the consideration of an increasingly diverse range of factors during the scheduling optimization process [4]. These factors add complexity to the task and underscore the necessity of comprehensive consideration when devising optimal scheduling strategies for IES. Addressing the fluctuations in power generation due to the rise in renewable energy (RE) penetration rate, attention has been drawn to the scheduling of energy storage power stations. Sun et al. [5] considers fuel cells, batteries, thermal storage, and heat pumps, composing a micro combined heat and power (CHP) system. It leverages the advantages of energy storage to enhance the overall efficiency and sustainability performance of the system. Chen et al. [6] studied an electric gas thermal IES system that includes integrated demand response (IDR), virtual energy storage (VES), and RE. By establishing VES, the operational efficiency and RE penetration level of power plants were improved. Chen et al. [7] explores the application and scheduling methods of shared energy storage (SES) in IES systems, utilizing ES to reduce IES operating costs and improve RE consumption. But the working mode of ES is not limited to this. Due to the flexible characteristics of charging and discharging of ES, ES can not only serve as a flexible resource to improve the operational efficiency of energy networks, but also participate in energy trading as an important profit-making entity. On the other hand, with the advancement of low-carbon energy networks, carbon emission (CE) indicators have gradually become an important factor that IES needs to consider [8]. Xu et al. [9] proposed an integrated scheduling study for low-carbon park IES, which improved the overall reliability and energy efficiency of the system. Huang et al. [10] studied a multi-energy complementary model based on conditional value at risk (CVaR), and studied the optimal scheduling results of IES under different conditions when considering demand response and CEs. Liu et al. [11] established a two-level scheduling model based on the CE flow model to study the incentive effect of IES carbon trading.
Due to the multi-agent architecture in IES, the selection of optimization methods in IES scheduling work will affect the rationality and accuracy of scheduling results [12]. The swarm intelligence optimization algorithm is a typical type of optimization algorithm that achieves optimization iteration by imitating biological behavior [13]. Nemati, Braun, and Tenbohlen [14] studies the economic scheduling problem in microgrids based on genetic algorithms and mixed integer linear programming (MILP), improving the limitations of MILP network topology. Yang et al. [15] established a cogeneration system based on a typical industrial park and solved the model using chaotic particle swarm optimization algorithm. However, in research, it was found that due to the multiobjective nonlinear characteristics of IES, swarm intelligence optimization algorithms are prone to dimensional disasters [16]. In order to solve multiobjective optimization problems, pareto frontier methods have received widespread attention. Deb et al. [17] proposed a sorting principle for pareto frontiers, and the proposed pareto frontiers improvement scheme focuses more on the optimal solution neighborhood. Wang et al. [18] proposes multiobjective cross entropy (MOCE) by combining cross entropy and importance sampling techniques, transforming uncertainty into deterministic constraints, and the method has universality for multiobjective algorithms. However, the pareto frontier method places more emphasis on the ideal situation in the process of seeking the optimal solution [19]. In order to consider the competition and rational choices of different entities in the actual operation of the network, game theory has received extensive research [20, 21]. Ma et al. [22] used an optimization model based on Stackelberg game to establish a cogeneration microgrid model and implemented microgrid electricity pricing based on differential evolution heuristic algorithm. Chen et al. [23] uses noncooperative games to achieve the optimal operational strategy of a comprehensive energy system and uses the characteristics of noncooperative games to depict the interest relationships between multiple regions. The above methods have shown good results in scheduling optimization between different agents and can depict the cooperation and competition relationships between different agents. Sun and You [24] discusses the application of machine learning and data-driven control in the context of increasing system scale and uncertainty, demonstrating the advantages and future development potential of machine learning and data-driven over traditional model–based approaches in terms of flexibility, economy, and other aspects. However, they do not pay attention to the relationship between the weight of multiobjective function indicators and the value of the objective function. On the other hand, the increasing complexity of the IES network structure also makes the solution of the IES scheduling problem more challenging.
- 1.
Based on the IES optimal scheduling model of the electricity–gas–heat node coupling network, the CE model considering RE CE, thermal power generation (TPG) CE, ES CE, and IES CE in construction and operation is established. The CE index is added to the IES multiobjective function optimization weight, and the change of CE and the growth of ES demand in the process of RE permeability improvement are studied.
- 2.
This paper proposes an IES multiobjective function weight optimization method based on WS index, analyzes the advantages and disadvantages of WS index in the process of optimizing the objective function, optimizes the multiobjective function weight based on a single WS index, further uses analytic hierarchy process (AHP) to optimize the multiobjective function weight combined with environmental friendliness and installed capacity, compares the differences between the two methods in the optimization of the objective function value, and gives suggestions and potential research directions for further study of WS index in multiobjective function optimization work.
- 3.
The guiding mechanism of FXL power purchase behavior based on time-of-use price is established to simulate the trading scenario in which power users choose their own time-of-use and power demand. The time-of-use price based on the fluctuation of power generation is used to realize the time sequence transfer of the peak energy demand of IES, and the significant role of FXL in alleviating the pressure of IES power supply and reducing the power purchase fee of users is analyzed.
The remaining chapters of this paper are arranged as follows: The second section introduces the IES coupling network model and equipment model, providing the mathematical model for the IES network, objective function, and constraint conditions. The third section analyzes the influencing factors of multiobjective function optimization, defines the WS index, presents objective function optimization ideas, and outlines the research methods for index comparison. The fourth section presents the simulation results of the IES coupling network, summarizes the application effects and potential areas of the WS index in optimizing the objective function weight, discusses the impact of permeability on the IES CE index, and analyzes the guiding effect of intraday power prices based on energy supply fluctuations on FXL behavior. The fifth section concludes by summarizing the contributions and findings of this paper. The variables used in this article are shown in Table A1.
2. IES Modeling
The IES model proposed in this article encompasses the integration of the power network, natural gas network, and heating network. These three energy networks are interconnected and mutually supportive, allowing for the efficient utilization of energy during peak or low-demand periods. Moreover, the IES model incorporates the use of ES and FXL, which play crucial roles in alleviating energy supply pressures during peak demand periods. The ES helps store excess energy during low-demand periods for later use, while the FXL enables the flexible adjustment of energy consumption patterns to match supply and demand. These features enhance the overall resilience and reliability of the IES model, ensuring a balanced and optimized energy supply.
2.1. IES Network Model
In IES, the energy characteristics of different networks make their complementarity more prominent. Energy is transmitted between multiple networks through CHP and electric boiler (EB). The architecture and interrelationships of each network are shown in Figure 1.
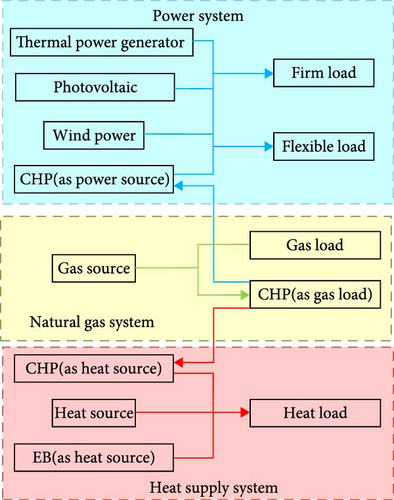
The IES architecture shown in Figure 1 is divided into three energy networks: electricity, natural gas, and heat. The power system includes TPG, photovoltaic (PV), wind power (WP), and CHP as power sources, with loads including field load (FML) and FXL. Gas source (GS) is used for gas supply in the natural gas system, while gas load (GL) and CHP are used as natural GLs. In the heating system, CHP, heat source (HS), and EB are used as HSs for heating, while heat load (HL) is the consumer of heat.
In the IES established in this article, mathematical models of each device are established to characterize their energy transmission behavior in different energy networks. CHP and EB are the main energy exchange devices, while ES and FXL mainly play a role in storing and transferring energy in a timely manner.
2.1.1. CHP
The CHP unit includes two parts: a gas turbine and a waste heat filter. While the gas turbine generates electricity, the waste heat boiler uses waste heat for heating, which can achieve simultaneous production of electricity and heat and improve gas utilization efficiency. In this article, the CHP unit is based on power generation and consumes natural gas to achieve power and heat supply.
2.1.2. ES
ES has diverse application scenarios in the comprehensive energy system model, such as suppressing the volatility of new energy generation, reducing load fluctuation pressure through peak shaving and valley filling processes, and considering low power grid prices for buying, selling, and arbitrage [25]. The ES model established in the article is an electrochemical ES. In order to achieve the research and optimization of the objective function weight in the article, the application mode of the ES is not limited, but is controlled through the setting of the objective function weight.
2.1.3. EB
2.1.4. Nature Gas Compressor
2.2. Objective Function
r1 to r8 represent the weights of different objective functions and are also the key to the multiobjective optimization problem discussed in this paper. fc,T, fc,E, fc,N, fC, fc,L, fm,T, fm,N, and fm,E are the TPG cost, ES cost, RE energy abandonment, CE, TPG profit, ES profit, RE profit, and FXL cost, respectively.
2.2.1. Cost and Benefits of TPG
2.2.2. Cost and Benefits of ES
2.2.3. Energy Abandonment Rate (AR) and Income of RE
2.2.4. Consumer Side Electricity Purchase Cost
This paper employs linear programming methods to allow the FXL to autonomously select electricity usage times throughout the day. The advantage of this approach is that it reduces the total electricity costs for the FXL, while enabling the IES to schedule the use of electrical energy during periods of energy redundancy for the FXL, thereby, enhancing the overall energy utilization efficiency of the system.
2.2.5. CE
2.3. IES Optimization Scheduling Constraints
2.3.1. Power Network Constraints
2.3.2. Natural Gas Network Constraints
The natural gas transportation model used in this paper includes natural GS, natural gas pipeline, compressor, and natural GL. Among them, the natural GS provides natural gas for the natural GL in the natural gas network, and the natural gas pipeline plays the role of transporting natural gas. Due to the pressure drop effect during natural gas transmission, compressors are installed along the natural gas pipeline to keep the gas node pressure within the allowable range and reduce the possibility of gas transmission blockage during peak GL [32]. Figure 2 show the relationship of each part as:

2.3.3. Heating Network Constraints
In the heating network, multiple HSs supply heat to the load at the same time, and the heating medium is the include heat supply pipe and water return pipe. The structure of the heating network is shown in Figure 3 [33].
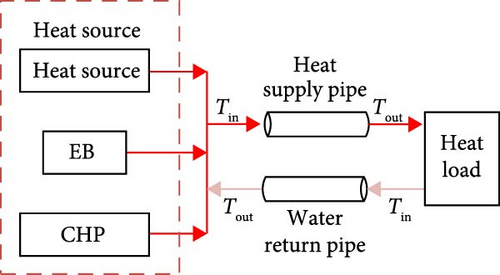
The power flow models of the electricity grid, natural gas grid, and heating network considered in this paper operate independently to supply energy. Energy conversion and mutual support are achieved through EB and CHP systems. Due to the differing peak demands and energy consumption characteristics of various types of energy, the three supply networks can complement each other to achieve efficient energy utilization.
2.3.4. Price Fluctuation Mechanism Based on Generation Resources
3. A Multiple Indicator Weight Optimization Model Considering WS
In the process of optimizing the objective function of the IES, there is a conflict of interest among different energy operators, users, and energy suppliers. Therefore, only considering the objective function index of an interest subject in the study will lead to the corresponding tendency of the results. In order to solve this problem, the cost and benefit indicators of multiple stakeholders are considered as the objective function, so that the benefit distribution in the power grid is more balanced. In this paper, the multi-index weight is optimized to realize the benefit distribution of multiple stakeholders. In the process of benefit distribution, the sensitivity of different stakeholders to the weight in the objective function, the status of CEs, the importance to the energy network, and the installed capacity are comprehensively considered.
3.1. The Influencing Factors of Objective Function Optimization
In IES optimization scheduling work, the diversity of objective functions also determines that their scheduling results are influenced by more factors, including objective function dimensions, physical meanings, operating modes, et cetera, which need to be considered when optimizing the weight of objective functions.
3.1.1. WS
Due to the existence of diversified indicators from the generation side, consumption side, and energy service providers in the objective function, the dimensions, physical meanings, and propensity towards energy allocation of each indicator are different. This also results in different degrees of improvement in the weight of different indicators by the comprehensive energy system. In order to take this WS into account in the comprehensive optimization of the objective function, a WS index is set, so that the sensitive index can obtain greater weight, thereby, improving the utilization efficiency of scheduling resources in the comprehensive energy system.
3.1.2. IES CE
In the optimal dispatch of IES, for example, power generation stations, energy service providers, and users have their own clear trading objectives, that is, to improve their own profits or reduce their own power purchase costs. Therefore, their objectives can be clearly modeled and solved in the optimal dispatch. However, although the CE index has no clear profit target, its impact on the environment is difficult to ignore [35], so the CE index should be considered as an important index for the weight optimization of the objective function in IES scheduling.
3.1.3. Installed Capacity
Due to differences in installed capacity among different power plants, such as TPG, PV, WP, et cetera, the cost and benefits in the objective function will also vary in order of magnitude. In order to avoid equipment such as ES that is relatively small in installed capacity being masked by equipment such as large power plants, small equipment cannot gain in the weight optimization of the objective function. Therefore, it is necessary to consider it as one of the factors in determining the weight of the objective function.
3.2. Weight Optimization Method Based on WS Index in IES
There is a variety of interest competition in IES, so when optimizing the objective function, we can not simply consider some indicators in IES, but need to optimize the comprehensive weight of the indicators involved in the competition, and WS is an important indicator in the weight optimization of the objective function. WS here means that when a single-objective is used as the objective function, the IES operation results under the single-objective optimal condition can be obtained through simulation. Therefore, multiple IES operation results under different index optimal conditions can be obtained by running different indexes as the single-objective function. At this time, comparing these results, it can be found that when different indicators are used as single-objective functions, the change range of the same indicator is not the same, that is, under the optimal operation conditions of other indicators, the indicator is greatly optimized, that is, the WS of the indicator is large, while some other indicators cannot be greatly optimized even under the optimal operation conditions, that is, the WS of the indicator is small. At this time, allocating too much weight of the objective function to the index with small WS for optimal scheduling will not achieve the desired optimization effect, which will cause a waste of IES resources. Therefore, it is necessary to optimize the weight of the objective function according to WS, so as to obtain more reasonable IES scheduling results.
3.3. Comprehensive Weight Optimization Based on AHP
In order to compare the effect of taking WS as a single-objective optimization weight and considering multiple indicators, AHP method is used to optimize the objective function combined with WS, environment friendly index and equipment installed capacity index in IES. In the process of AHP decision weight, the criteria layer indicators include WS, environmental friendliness, and equipment installed capacity. The scheme layer considers TPG cost, ES cost, RE power abandonment, IES CE, TPG profit, ES profit, RE profit, and user electricity purchase fee. The judgment matrices at different levels are set according to the calculation results and some expert experience. The process of AHP method is shown in Table 1.
| Step | Pseudocode |
|---|---|
| Step 1 | Initialize IES network data, intraday price, input Dv // initialize IES parameters and input the AHP check vector Dv. |
| Step 1 |
|
| Step 3 | Sort {wii = 1,2,…,n}, build Dp,jdg // the scheme layer judgment matrix Dp,jdg established according to WS index. |
| Step 4 | Sort {gii = 1,2,…,n} and {cii = 1,2,…,n}, build Dg,jdg and Dc,jdg // established the scheme layer judgment matrix Dg,jdg and Dc,jdg. |
| Step 5 | Sort R = {w g c}, build Dr. // the criterion level judgment matrix WS established according to criterion level index. |
| Step 6 |
|
| Step 7 |
|
| Step 8 | Output W = (w1,w2,…,wn). // output AHP weight optimization results. |
In this paper, the weight optimization process of single WS index and multi-index objective function based on AHP is shown in Figure 4.
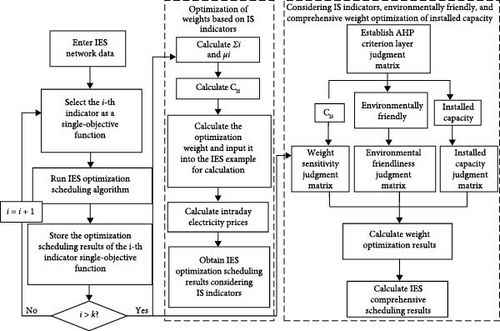
As shown in Figure 4, after two different weight optimization schemes, the comparison of the results can be used to analyze the role of WS index in the weight optimization process and the precautions when studying WS index.
4. Case Studies
The IES coupling network model in this article includes a tripartite coupling of the power grid, natural gas network, and heating network, and the interconnection between different energy networks is achieved through energy conversion equipment. In this paper, under the equality and inequality constraints of Equations (18)–(40), and with Equation (3) as the optimization objective, the proposed model is formulated as a linear programming problem, and the proposed model is solved on the Yalmip platform in Matlab 2020A with the CPLEX solver.
4.1. Data Input
The IES model used in this article includes the power grid (IEEE 39-bus system [36]), the heating network (6-node heating system [37]), and the natural gas network (Belgian high caloric 20-node natural gas system [38]). In order to conduct the research in this article, multiple ES, RE, and FXL were added on the basis of the original calculation examples, resulting in a RE penetration rate of 41.57% in the power grid. The RE data comes from the real data of a certain PV and WP station in a certain year. The impact of time-of-use electricity prices based on energy supply on IES energy architecture was considered, and IES optimization scheduling considering CE and FXL under high penetration rates was studied. In the calculation example, the power system includes a total of 10 generator units, with a total installed capacity of 6967 MW and a total power load of 5941.5 MW. There are a total of six GSs and nine GLs in the natural gas network. Seven conventional GLs and two gas turbine generator loads, total load 2.4608 Mm3. The heating network includes one CHP unit, one EB, and three heating loads, with a total load of 50 MW. The main power generation equipment data in IES is shown in Table 2.
| Node | Equipment | Power cap (MW) | Unit CE (t/MWh) | Operation cost (yuan/MWh) |
|---|---|---|---|---|
| 30 | CHP | 250 | 0.522 | 180 |
| 31 | TPG | 650 | 0.856 | 250 |
| 32 | WP | 650 | 0.0095 | 200 |
| 33 | CHP | 632 | 0.522 | 180 |
| 34 | TPG | 508 | 0.856 | 250 |
| 35 | PV | 650 | 0.086 | 160 |
| 36 | TPG | 560 | 0.856 | 250 |
| 37 | CHP | 540 | 0.522 | 180 |
| 38 | TPG | 830 | 0.856 | 250 |
| 39 | TPG | 1000 | 0.856 | 250 |
The simulation example architecture in this article is shown in Figure 5.
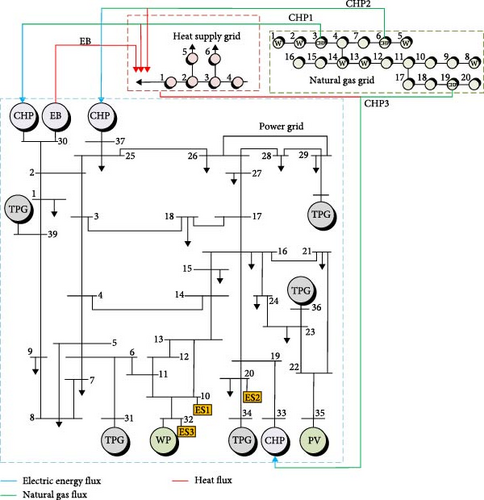
The ES in this example is constructed at nodes 10, 20, and 32, and the ES capacity is 50 MW/200 MWh. Node 32 is the WP node and node 35 is the PV node. The load at nodes 4, 8, 20, and 29 is FXL. The load fluctuation and RE fluctuation characteristic curve in this paper are shown in Figure 6.
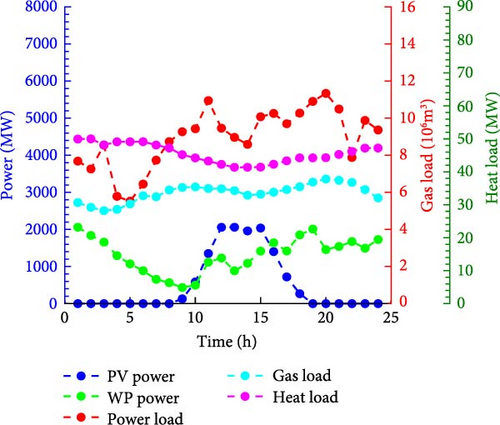
The RE characteristic curve in Figure 6 is the RE power generation fluctuation characteristic curve obtained by clustering the annual power generation data of a RE station. It can be seen that due to the influence of meteorological factors associated with time, PV generation is concentrated in the time period of [9,19], while WP generation has a certain output in 24 h, but more power is generated in the time period of [0,5] and [12,24]. RE generation shows the characteristics of irregular time series fluctuation. The load of power grid, natural gas network, and heating network fluctuated continuously within 24 h. Due to the office power consumption in the daytime and the household power consumption in the evening, the power demand of power grid was relatively large in [7,23] time period. Due to the fact that families cook at noon and night, the gas network has a large demand for natural gas in [7,13] and [17,23] periods. However, due to the greater demand for heat supply at night, the heat demand of the heat supply network in [23,24] and [0,4] is larger, and there is a complementary relationship between the energy demand of the three networks. The power flow characteristics of the three networks are independent of each other, but energy form conversion and interaction can be achieved through EB and CHP systems. To ensure the basic living needs of users, the natural GL and HL cannot be reduced, while the electricity load adopts a demand response mode.
4.2. Optimization of Weights for Multiple Indicator Objective Functions
In order to obtain the power generation cost of TPG, CHP power generation cost, ES operation and maintenance cost, RE power abandonment, CE, FXL electricity fee, ES profit, RE profit, and WS of TPG profit indicators, each indicator was operated as a single-objective function and the results shown in Table 3 were obtained.
| Single-objective function | TPG cost (10,000 yuan) | ES cost (10,000 yuan) | RE energy abandonment (%) | CE (t) | TPG profit (10,000 yuan) | ES profit (10,000 yuan) | RE profit (10,000 yuan) | FXL cost (10,000 yuan) |
|---|---|---|---|---|---|---|---|---|
| TPG cost | 207.40 | 7.20 | 0 | 9226.78 | 378.24 | 6.45 | 362.41 | 2842.29 |
| ES cost | 608.81 | 0 | 0 | 10056.24 | 415.52 | 32.44 | 362.41 | 2798.82 |
| RE energy abandonment | 779.30 | 5.89 | 0 | 16329.18 | 407.65 | 5.19 | 362.41 | 3058.88 |
| CE | 560.00 | 3.00 | 0 | 8593.41 | 555.68 | 2.50 | 362.41 | 3065.85 |
| TPG profit | 974.43 | 4.20 | 20.22 | 15202.89 | 800.01 | 3.56 | 75.85 | 3226.76 |
| ES profit | 535.36 | 36.00 | 0 | 9303.57 | 411.37 | 32.44 | 362.41 | 2757.37 |
| RE profit | 779.23 | 5.89 | 0 | 9806.19 | 407.65 | 5.19 | 362.41 | 3058.88 |
| FXL cost | 358.27 | 7.20 | 61.59 | 12513.86 | 348.69 | 6.45 | 298.70 | 2142.14 |
In Table 3, boldface values represent metrics functioning as individual optimization targets. When IES scheduling is carried out with a single-objective as the objective function, the index shows a better optimization effect than that not listed as the objective function. In order to compare the optimization effect of each index under different dimensions, each index is normalized to take out the influence of dimensions. The optimization range of each index is shown in Figure 7.
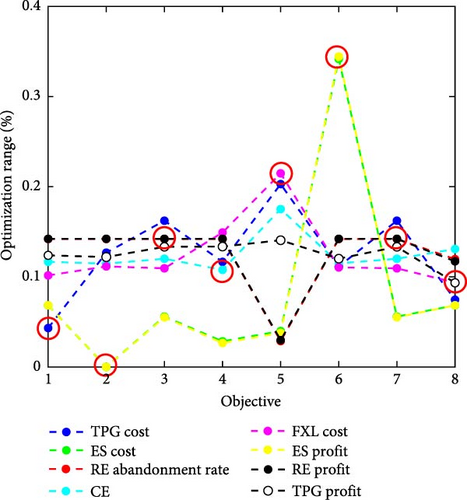
The pole in Figure 7 represents the index represented by the single-objective function. It can be clearly seen that the single-objective optimization has too obvious tendency. For example, TPG power generation tends to be minimized, while the power supply of TPG is mostly undertaken by RE, so the AR of RE generation is reduced to 0%. On the other hand, when TPG profit was taken as the optimization target, TPG profit was 80.012 million yuan, an increase of 2.12 times, so the RE power AR increased by 79.79%. The reason for this result is that there is a certain redundancy in generation resources in IES, but users’ power consumption does not lack the source of power, so the objective function weight is the main reason affecting the utilization rate of different types of generation resources. The ES dispatching results also show the same rule. This significant change reflects the serious tendency of single-objective optimization. Therefore, in the process of optimization, the participants of benefit distribution should be considered as a whole, and the results obtained can have application value. Comparing TPG profit, RE profit, and ES profit index, we can find that the WS volatility relationship of the three is ES (0.92) > RE (0.79) > TPG (0.53).
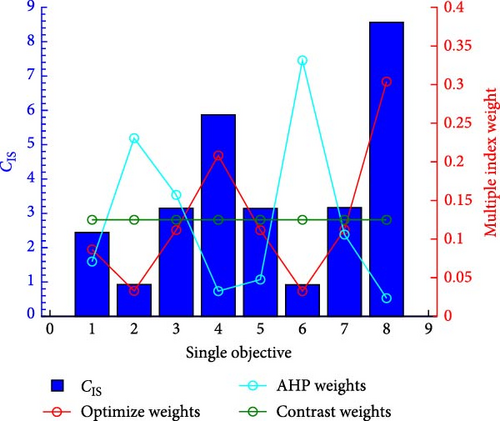
Based on the above WS index differences, the results shown in Table 4 can be obtained by using Equations 41–45 to optimize the weights of multiobjective functions. It is important to note that in certain extreme cases, if indicators are chosen improperly, there is a risk of excessive optimization of specific indicators, which can adversely affect the overall performance of the system. In such situations, it is necessary to perform single-objective calculations on the objective function and keep the sensitivity of the weights among the objective functions within acceptable limits to avoid excessive optimization of specific indicators. However, only considering WS will lead to the neglect of some indicators insensitive to weight. For example, when ES with small installed capacity is used as the objective function, its optimization range is larger than its own installed capacity, but the optimization range of TPG and RE at the generation side is smaller than its own installed capacity. On the other hand, since CE is a nonprofit indicator, insufficient consideration is given to CE in optimization. In order to reduce the difference of WS indicators among different indicators, further research is carried out in combination with the AHP. In order to consider WS while examining the environment friendly and avoid the poor optimization effect caused by small equipment capacity, WS, environment friendly index, and installed capacity index are optimized as the judgment indicators of AHP criterion layer. The WS index is used to enhance the utilization of weights in multiobjective optimization problems, while the environmental index promotes energy conservation and low-carbon operation of the IES. The installed capacity indicator is used to ensure consistency among devices with different installed capacities. It should be noted that the criteria-level indicators can be adjusted based on needs in different application scenarios. The AHP conducts a comprehensive evaluation of the single-objective weight schemes based on the criteria-level indicators, and subsequently optimizes the weights of multiple objective functions according to the differences in evaluations. The AHP optimization results are shown in Table 4 and Figure 8.
| Number | 1 | 2 | 3 | 4 |
|---|---|---|---|---|
| Index | TPG cost | ES cost | RE AR | CE |
| Nomalized w | 0.125 | 0.125 | 0.125 | 0.125 |
| WS optimization w | 0.107 | 0.282 | 0.083 | 0.045 |
| AHP optimization w | 0.071 | 0.231 | 0.157 | 0.033 |
| Number | 5 | 6 | 7 | 8 |
| Index | TPG profit | ES profit | RE profit | FXL |
| Nomalized w | 0.125 | 0.125 | 0.125 | 0.125 |
| WS optimization w | 0.083 | 0.286 | 0.083 | 0.031 |
| AHP optimization w | 0.048 | 0.331 | 0.106 | 0.024 |
The weight of the objective function shown in Table 4 is the weight optimization result after considering WS. At this time, the weight change of the objective function is shown in Figure 8. It can be seen that when only considering WS index, ES cost and profit weight decreased by 73.60% and 73.92%, respectively. The reason is that ES capacity is small, and the optimization effect of optimizing ES index weight on the function is poor for WS index. When AHP is used for comprehensive optimization, ES cost and profit weight are optimized by 5.99 times and 9.16 times, respectively. The reason for such a significant increase is that the installed capacity of ES is smaller than that of RE and TPG, so the weight decreases when only WS index is considered. When the weight of installed capacity optimization is additionally considered, the weight of ES is compensated. At the same time, because the operation of ES is conducive to the access operation of RE, when considering the environment friendly index, ES has also been optimized. On the other hand, because the FXL electricity tariff index was not the focus of optimization in the process of AHP optimization, the index weight was reduced by 92.23%. CE index and RE index are related to environment friendly index, but RE AR punishment is more closely related to environment friendly index. Less RE AR means higher utilization of RE, which reduces CE, so its weight increases by 40.73%, while CE includes TPG CE, ES CE, RE CE, et cetera, so CE index is not positively related to environment friendly index, which reduces the weight of CE index by 84.29%.
According to the weight calculation after optimization, the optimal scheduling objective function results of IES are obtained, and the data of each index value increase or decrease are calculated, as shown in Figure 9.
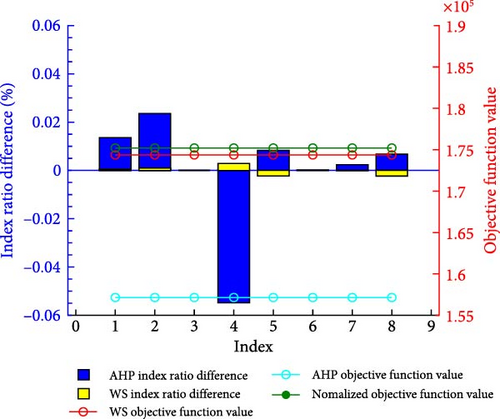
In Figure 9, the comparison of scheduling results after AHP comprehensive weight optimization and WS index weight optimization shows that the weight optimization results based on WS show that TPG profit and FXL power purchase fee increase by 0.22% and 0.23%, respectively, while CE decreases by 0.29%. At this time, the value of the objective function decreases by 0.47% without increasing any power generation or ES resources. This is because, in all the objective functions, due to their different dimensions and physical meanings, the optimization ranges of the objective functions that can be obtained under the premise of obtaining the same weight optimization are also different, and the WS index effectively enlarges the sensitivity to weight changes and tends to allocate more weight resources to the indicators with high sensitivity.
Comparing the WS index and the AHP considering WS with normalized weights, the sum of the percentage improvement in the numerical optimization of indicators was found to be 22.87% for WS index optimization alone, whereas it increased to 60.57% when AHP, incorporating WS, further optimized the indicators. After considering WS index, environment friendly index and installed capacity and using AHP method to optimize the weight, it is found that the weight of CE index in AHP optimization result is smaller, so the proportion of CE in the objective function increases by 5.48%, while the proportion of other indexes decreases by 5.46%. The scheduling results after AHP optimization weight show that the objective function value is reduced by 10.31% compared with the normalized weight. Although the CE proportion increases, the CE value decreases by 19,592.94 t, the IES CE value decreases instead. The reason is that the impact of environment friendly index on IES scheduling results lies in the increase of RE weight, but since CE includes TPG CE, the CE weight is reduced under the combined effect of environment friendly index and installed capacity index, but the scheduling results are significantly better, so all indexes have been optimized in all aspects, which is reflected in the reduction of the value of each index and the overall reduction of the objective function. Compared with the single-objective optimization weight of WS index, the IES scheduling results at this time not only comprehensively consider the environmental factors, installed capacity and WS index, but also the objective function is worth more optimization.
By comparing the reasons, it can be found that the optimization direction of weight optimization results when considering WS index is relatively single, and the optimization of objective function value is achieved only by increasing WS higher index weight. The AHP method additionally considers the environment friendly index and the installed capacity index, and its optimization results include the optimization of the scheduling results of RE, TPG, ES, and other equipment. While enlarging the WS index, the scheduling results initially have a certain degree of selectivity, and the optimization results can optimize the objective function value in all aspects compared with the single WS index optimization, so the IES scheduling results of AHP optimization weight are comprehensively optimal compared with the single WS index.
By comparing the normalized weight, the weight optimization based on WS index and the comprehensive weight optimization scheduling based on AHP method show that: (1) The weight optimization method based on WS index variation coefficient can reduce the objective function value without increasing the investment of IES planning, and the objective function value in this example is reduced by 0.47%. (2) By combining subjective and objective weighting methods such as AHP, comprehensive weight optimization can be achieved by combining WS indicators and other indicators (such as environment friendly index, installed capacity index, etc.). The value of the objective function in this example increases by 10.31%, and the IES scheduling results can selectively optimize the scheduling results of some key equipment in the system, with better optimization results and stronger selectivity. (3) Comparing the WS indicator with the AHP method, it is evident that WS represents a fully objective approach to weight optimization. AHP, on the other hand, generates the evaluation of multiobjective weights under expert guidance. When the interrelationships between multiple metrics are unclear, the WS indicator is more applicable, whereas, with rich expert experience, combining AHP with the WS indicator can enhance weight optimization.
4.3. Trends in CE Changes in High Permeability IES
Due to the inclusion of equipment such as TPG, RE, and ES in IES, the CO2 emissions generated cannot be ignored. In the objective function weight optimization of this article, CE indicators include emissions from IES power generation equipment, energy service providers, energy networks, et cetera. By comparing the IES scheduling results with and without considering CE indicators, the CE results shown in Table 5 can be obtained.
| Index | PV CE (t) | WP CE (t) | GS CE (t) |
|---|---|---|---|
| Considering CE | 17724.60 | 2066.25 | 626.69 |
| Not considering CE | 17724.60 | 2066.25 | 1177.63 |
| Difference | 0 | 0 | 550.94 |
| Index | IES operation CE (t) | TPG CE (t) | ES CE (t) |
| Considering CE | 34363.79 | 51338.76 | 403.20 |
| Not considering CE | 34771.63 | 51939.64 | 403.20 |
| Difference | 407.84 | 600.88 | 0 |
From Table 5, it can be seen that the consideration of CE indicators can have a significant effect on IES scheduling work, effectively reducing the system’s CE level. Among them, the most significant reduction effect is GS CE, IES running CE, and TPG CE. The portion of GS CE reduction is the energy supply from CHP units to the power grid and heating network. While TPG CE decreased, PV and WP did not increase power generation, indicating that FXL and ES reduced their demand for TPG power generation through temporal transfer of electricity demand.
By analyzing the composition of CE, it can be found that the CE in IES mainly come from RE power generation, TPG power generation, and CE generated during IES operation. Among them, TPG CE accounts for the largest proportion, and due to its nonrenewable nature and low efficiency in carbon resource utilization, TPG has gradually been replaced by RE in recent years. In order to study the impact of different RE permeability on IES CE, adjust RE permeability in the calculation example and make statistics on RE, TPG power generation and CE, and get the results shown in Figures 10 and 11.
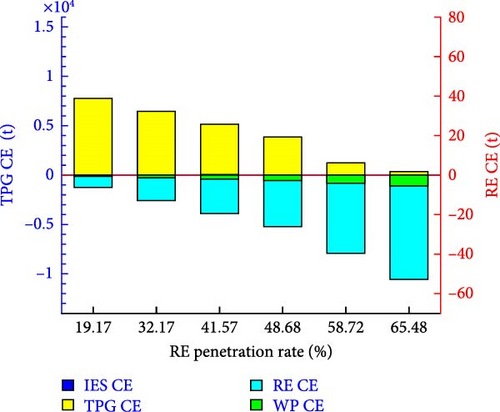
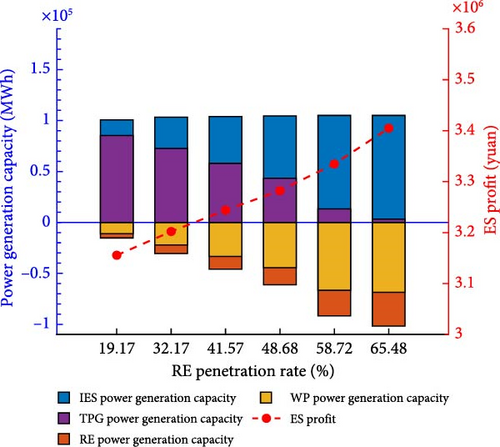
In Figure 10, it can be seen that as the penetration rate of RE increases from 19.17% to 65.48%, the main body of CE in IES gradually changes from TPG to RE. During this process, the total power generation of IES remains basically unchanged, while the total CE of IES decreases by 94.69%. The reason is that RE mainly focuses on construction CE, and this article ignores the small amount of CE generated during RE operation, while TPG generates a large amount of CE during operation. Figure 11 shows that, while the penetration rate of IES has increased by 46.31%, the total profit of ES has increased by 7.32%. This indicates that the increase in RE leads to an increase in IES power generation volatility and ES can provide support for RE’s power generation volatility. On the other hand, the intensified power generation fluctuations will increase the price fluctuations of the time-of-use electricity price and ES will gain more benefits through low-priced charging and high-priced discharge. From this, it can be seen that the increase in RE penetration rate has also increased the demand for ES by IES.
The research on the total power generation and CE of RE and TPG under different penetration rates shows that: (1) An increase in RE penetration rate can effectively reduce IES CE. (2) When building RE power plants with the goal of reducing CE, the operating CE of WP are lower than those of PV. (3) ES can serve as an important means of regulating fluctuations in RE power generation, and an increase in RE penetration rate is also beneficial for ES operators to increase ES profits.
4.4. The Regulatory Effect of FXL on Supply and Demand Balance Based on Electricity Price Guidance
For FXL, due to its self selected characteristics, it has a good regulatory effect. This article uses a price guidance mechanism to guide changes in electricity prices as a guide for FXL time series transfer. On the other hand, the transfer characteristics of FXL also benefit the flexible scheduling of IES. Therefore, this article establishes a price guided FXL demand transfer mechanism and compares the scheduling results of IES with and without FXL, as shown in Figure 12.
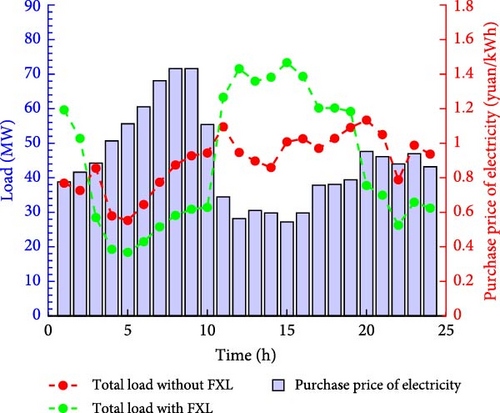
The red and green curves in Figure 12 represent the daily load demand without considering FXL and considering FXL, respectively, while the blue bar chart represents the time-of-use electricity price based on electricity generation. It can be seen that in the impression of time-of-use electricity prices [3,10] and [20,24] are high electricity price periods, while [11,19] is low electricity price period. It can be clearly observed that when considering FXL, FXL undergoes a significant transfer phenomenon, as FXL, under the influence of the time-of-use electricity price, utilizes its own temporal transfer characteristics to pursue cheaper electricity. By comparing the differences in daily power supply demand and electricity purchase fees between FXL and non FXL, Figure 13 is obtained.
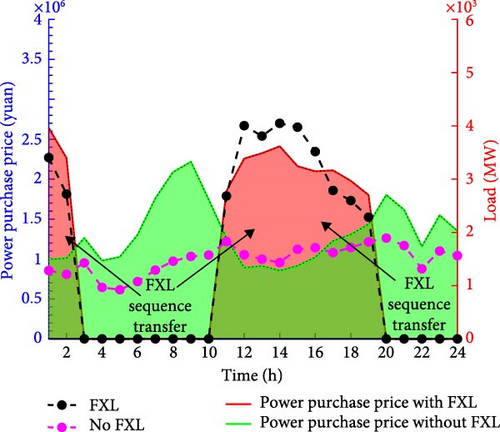
From Figure 13, it can be seen that FXL has shifted its electricity demand from high electricity price periods to low electricity price periods in order to reduce electricity purchase fees, thereby, achieving the goal of reducing electricity bills. Among all FXL, 51.47% of them transferred their own electricity usage period. At this time, the electricity purchase fees of FXL and no FXL were calculated, and it was found that the daily electricity bills of FXL were 239,000 yuan, while the daily electricity bills of no FXL were 317,000 yuan. Through FXL’s independent choice of electricity purchase time, the electricity bills were reduced by 24.61%. On the other hand, due to the fact that the fluctuation of the time-of-use electricity price is determined by the amount of power generation resources in the text, the load transfer behavior of FXL corresponding to the time-of-use electricity price can effectively regulate and alleviate the energy shortage caused by the fluctuation of IES power generation resources.
By establishing a time-of-use electricity price based on power generation resources, it was found that FXL, as a flexible user side scheduling resource, can achieve the goal of users spontaneously transferring electricity load peaks through price guidance. The strategy of establishing a price guidance mechanism will affect the scheduling results of FXL. The time-of-use electricity price based on generation resources used in this article is more effective in alleviating the power supply pressure during peak periods in the network.
5. Conclusion
- 1.
In this example, without increasing the planning and construction investment of the IES system, the objective function value is optimized by 0.47%. By incorporating the WS method and considering additional environment friendly and installed capacity indexes using AHP, the objective function of the scheduling result is further reduced by 10.31%. The multiobjective function optimization method based on the WS index is suitable for optimizing and scheduling complex systems with different dimensions and physical meaning indexes. Weight optimization based on the WS indicator is suitable for scenarios where the interrelationships between multiple objectives are unclear. However, when experts have extensive experience in the same problem, subjective and objective combined evaluation methods such as AHP can be used. By integrating WS indicators with other metrics to optimize weights, better results in objective function optimization can be achieved.
- 2.
As a green power generation mode, the volatility of RE will lead to further differences between peak and trough power supply and demand in IES. The calculation example in this paper demonstrates that when the IES permeability increases by 46.3%, the IES CE decreases by 94.69%, and the profit from energy storage increases by 7.32%. The construction of ES and the implementation of an electricity price guidance mechanism based on generation fluctuation on the load side to guide FXL’s power purchase behavior are two feasible supporting measures. How IES quantifies and encourages the supporting role of ES and FXL to ensure the sustainable and favorable development of the ES industry and energy market is the research goal for future studies.
- 3.
This paper guides the electricity purchase behavior of FXL through a time-of-use pricing mechanism based on generation capacity fluctuations. The simulation shows that 51.47% of FXL’s power demand exhibits time sequence transfer characteristics, reducing FXL’s power purchase price by 24.61%, and relieving the energy supply pressure of IES during peak energy demand periods. Although this time-of-use pricing strategy effectively transfers energy demand in the appropriate time sequence, the time-of-use pricing established in this paper solely based on power generation fluctuations does not consider the supply and demand balance of the actual energy market. Incorporating real-time supply and demand balance fluctuations in establishing TOU prices is the focus of future research endeavors.
Conflicts of Interest
The authors declare no conflicts of interest.
Funding
This work was supported by National Natural Science Foundation of China (Game control–based planning and simulation modeling of coupled optical storage hydrogen production system) (Grant 52277211) and Research Start-up Fund of North China University of Technology (Research on High Precision Simulation and Advanced Control Strategy of Optical Storage Green Hydrogen System) (Grant 110051360022XN107-03).
Acknowledgments
This work was supported by National Natural Science Foundation of China (Game control–based planning and simulation modeling of coupled optical storage hydrogen production system) (Grant 52277211) and Research Start-up Fund of North China University of Technology (Research on High Precision Simulation and Advanced Control Strategy of Optical Storage Green Hydrogen System) (Grant 110051360022XN107-03).
Appendix
| Nomenclature | |
|---|---|
| Indices | |
| fT | TPG cost |
| Cb,T | TPG construction cost |
| Co,T | TPG operation cost |
| fm,T | TPG profit |
| fc,E | ES cost |
| Cb,E | ES construction cost |
| Co,E | ES operation cost |
| fc,N | RE Power curtailment penalty |
| fp,N | RE cost |
| fm,N | Profit from RE power sales |
| RE construction cost | |
| Profit from RE power sales | |
| fc,L | Electricity purchase expenses of power users |
| fc | IES CE |
| TPG construction CE | |
| TPG operation CE | |
| Operation CE of natural gas system and thermal system | |
| PV construction CE | |
| WP construction CE | |
| ES operation CE | |
| IES operation CE | |
| Variables | |
| PEB | EB consumed electric power |
| TPG power in t period | |
| PV generation power in t period | |
| WP generation power in t period | |
| Power demand of FML in t period | |
| Power demand of FXL in t period | |
| HEB | EB thermogenesis |
| pj | Compressor outlet pressure |
| pn | Compressor inlet pressure |
| Line flow power from node i to node j | |
| Consumer power | |
| Charging power of ES in t period | |
| Total power generation in t period | |
| Daily historical maximum load | |
| Daily historical minimum load | |
| Hourly power consumption of power users | |
| FML power | |
| FXL power | |
| Node voltage in t period | |
| Line current in t period | |
| ES state of charge | |
| Natural gas load gas consumption | |
| CHP gas consumption | |
| Output of natural gas source | |
| Node input natural gas flow | |
| Nodal pressure in t period | |
| Natural gas flow of pipelines i to j in t period | |
| Heat source heating | |
| CHP heating | |
| EB heating | |
| Pipe heat loss | |
| Heat for heat load | |
| Inlet water temperature of pipeline | |
| Outlet water temperature of pipeline | |
| PCHP | CHP generation power |
| gCHP | Natural gas consumption by CHP |
| Ht | Waste heat generated by CHP |
| HCHP | CHP waste heat heating |
| σ | Mean value |
| μ | Standard deviation |
| CWS | Index variation coefficient |
| w | Index weight |
| Parameters | |
| ηEB | EB electric heat transfer efficiency |
| ρc | Compressor compression ratio |
| mc | TPG unit generation cost |
| Time-of-use price in t period | |
| mp | ES power unit price |
| ms | ES capacity unit price |
| r | Discount rate |
| L | ES payback period of investment |
| CR | Es operating cost conversion coefficient |
| SE,N | ES rated capacity |
| PE,N | ES rated power |
| nE | ES quantity |
| nPV | PV quantity |
| nWP | WP quantity |
| vmax | Upper limit of node voltage after relaxation |
| vmin | Lower limit of node voltage after relaxation |
| Imax | Upper limit of node current after relaxation |
| Imin | Lower limit of node current after relaxation |
| cmin | ES SOC Power cap |
| cmax | ES SOC lower power limit |
| cr | ES charge and discharge ratio |
| Pmax | ES power cap |
| PPV,max | PV maximum generating power |
| PWP,max | WP maximum generating power |
| umax | Node i upper pressure limit |
| umin | Node i lower pressure limit |
| Cw | The heat capacity of water |
| η | Pipe heat loss coefficient |
| HEB,min | The upper limit of EB output |
| HEB,max | The lower limit of EB output |
| ηL | CHP generation efficiency |
| ηl | CHP heat dissipation coefficient |
| ηr | Waste heat recovery efficiency of waste heat boiler |
| ηh | Heating efficiency of waste heat boiler |
| Price fluctuation coefficient | |
| Cp,c | Conversion coefficient of price fluctuation |
| mb | Benchmark price in t period |
| PL,a | Total power demand of FXL within 24 h |
Open Research
Data Availability Statement
Data sharing is not applicable to this article as no new data were created or analyzed in this study.


