Effects of Temperature and Duration on the Combustion Characteristics of Hydrochar Prepared From Traditional Chinese Medicine Residues Using Hydrothermal Carbonization Process
Abstract
Due to the depleting fossil fuels and increasing environmental issues, the application of biomass-derived energy is becoming significant. The widespread use of traditional Chinese medicine (TCM) in China results in a large amount of TCM residue, which can be used to generate biomass energy and then mitigate environment problems. This paper focuses on the treatment of Glycyrrhiza uralensis (GU) residue, a common TCM waste, using the methods of hydrothermal carbonization (HTC), elemental analysis, proximate analysis, Fourier transform infrared (FTIR) analysis, and thermal analysis, to investigate the fuel properties and combustion performance of hydrochars produced from GU under different process conditions (temperature and duration). The results showed that the raw GU had a higher heating value (HHV) of only 16.27 MJ/kg, whereas the hydrochar achieved yields ranging from 34.11% to 43.74% and HHVs between 24.00 and 29.01 MJ/kg. The HTC temperature significantly influenced the yield, physicochemical properties, and thermal behavior of the hydrochar. In contrast, the duration had a comparatively minor effect on its combustion performance. With increase in temperature, the yield of hydrochar decreases along with the reduction of certain oxygen-containing functional groups, but the fixed carbon (FC), HHV, and stability of the hydrochar increase. Furthermore, the reduction in the combustion index (Z-values) between 200 and 225°C across the three hydrothermal duration groups was significantly greater than that observed between 225 and 250°C. The average reduction for the former reached 39.3%, whereas for the latter, it was merely 9.4%. This variation indicates that 225°C is the optimal temperature for producing fuel from GU via HTC.
1. Introduction
With the increasing demand for energy resources, traditional fossil fuels such as petroleum, coal, and natural gas are difficult to satisfy the needs of society. Moreover, the extensive use of coal and petroleum has raised many environmental problems. Thus, it is necessary to develop clean and efficient new energy. Biomass energy, characterized by its renewability and environmental friendliness, has received considerable attention in recent years. However, the current utilization of biomass energy faces challenges due to the high economic viability, high moisture content, elevated oxygen levels, and high alkali metal content of biomass [1, 2]. Therefore, there is an urgent need to explore efficient methods for the utilization of biomass energy.
Extensive research has been conducted exploring thermochemical technologies for the conversion of residual biomass, such as torrefaction [3, 4], pyrolysis [5–7], gasification [8], and combinations of these methods [9]. Recently, wet chemical conversion has become a prospecting method, and the hydrothermal carbonization (HTC) is a preferable choice to eliminate the high energy cost associated with biomass predrying. The HTC represents a novel thermochemical conversion technique for biomass, transforming wet residual organic materials into carbon-rich solid materials [10]. These solid materials are called hydrochar, which are produced under mild conditions through the action of water [11]. HTC can occur within the temperature range of 180−250°C, under subcritical water conditions [12, 13]. Compared to raw biomass feedstocks, hydrochar demonstrates higher energy density, stronger hydrophobicity, and better grindability [14]. Additionally, compared to pyrolytic chars obtained at the same temperature, hydrochar exhibits higher energy content and superior fuel quality [15, 16]. HTC has been commenced in European facilities, which are being utilized for the treatment of sewage waste, municipal waste, and sludge generated from anaerobic digestion plants [17]. This signifies a noteworthy advancement toward the practical implementation of HTC technology for the processing of diverse biomass and wet waste materials.
Traditional Chinese medicine (TCM) is famous around the world and is widely utilized in China, contributing significantly to human health. However, it generates ~6.61 billion pounds of Chinese medicinal residue (CMR) annually, resulting in severe environmental issues [18–21]. Traditional methods for handling CMR involve simple stacking and landfilling, which are evidently inadequate disposal methods. Consequently, numerous scholars have investigated the potential applications of these residues. For example, Li et al. [22] evaluated the adsorption capacity of ball-milled hydrochar derived from TCM residues for heavy metal ions. Qiu et al. [23] assessed its potential as a fertilizer, while Ma et al. [24] investigated the feasibility of using fermented hydrochar as a feedstock for animal feed production. It is worth noting that CMR is rich in organic components, including cellulose, hemicellulose, and lignin, highlighting its significant potential for fuel applications. Chen et al. [25] examined the differences in the combustion characteristics of CMR under oxy-fuel and air atmospheres, while Liu et al. [26] employed a compression process to produce dense pellets as fuel. Nevertheless, due to its complex composition, low calorific value, and high moisture content, utilizing HTC as a pretreatment method for converting CMR into fuel emerges as a promising solution. Glycyrrhiza uralensis (GU), revered as the “king of herbs,” is a traditional medicinal plant rich in organic compounds. Its unique role in various formulations makes it highly representative and widely used in TCM.
In this study, GU was used to analyze the changes in combustion characteristics of CMR during the HTC process. The objective is to explore the feasibility of using the HTC method to produce fuel from CMR, to understand the formation mechanism of hydrochar, and to determine the optimal conditions for the conversion of GU during the HTC process.
2. Materials and Methods
2.1. Experimental Materials
The GU residue was obtained from a clinic in Xingren City, Guizhou Province, and it pertains to the rhizome part of the plant. The cellulose (41.6%), lignin (26.5%), and hemicellulose (21.2%) contents of GU were determined according to Standard Biomass Analytical Procedures (LAPs) of the National Renewable Energy Laboratory (NREL, http://www.nrel.gov/biomass/analytical_procedures.html). Since the GU obtained for this study is waste biomass that has been decocted with various other medicinal materials and substances, its surface contains impurities. Therefore, before conducting the HTC experiment, the GU was rinsed with deionized water to remove these extraneous impurities and minimize their impact on the experiment. The rinsed samples were placed in breathable, water-permeable cloth bags and suspended in a well-ventilated area for air drying. The dried GU samples were subsequently ground with a ceramic mortar, and the powder passing through a 40-mesh sieve was selected for the experiment.
2.2. Preparation of Hydrochars
The HTC experiments of GU residue were conducted in a 50-mL high-temperature and high-pressure stirred reactor (CWYF-1, China). The reactor is constructed of 316-L stainless steel and has a maximum pressure and temperature capacity of 20 MPa and 300°C, respectively. Each experiment involved the addition of deionized water (25 mL) and solid samples (5 g). To ensure uniform heating of the raw materials, the mixed samples were stirred at 600 r/min for 10 min using a DF-101S magnetic stirrer. The reactor was sealed, and nitrogen gas at 0.1 MPa was introduced for 1 min to establish an inert nitrogen atmosphere inside the vessel. To prepare hydrochars under different HTC times and temperatures, samples were heated at a consistent heating rate of 5°C/min to 200°C, 225°C, and 250°C, respectively, and maintained at these temperatures for 4 h, 8 h, and 12 h, respectively. Each experiment was repeated three times for consistency and reliability. After the reaction, once the temperature inside the reactor dropped below 60°C, the samples were collected. Solid and liquid products were separated using a high-speed centrifuge at 10,000 r/min, and then the solid products were preserved in a drying oven at 105°C for 24 h. Table 1 presents the experimental conditions and key physicochemical properties of the samples.
| Property | HC-0 | HC-1 | HC-2 | HC-3 | HC-4 | HC-5 | HC-6 | HC-7 | HC-8 | HC-9 | Lignite | Sub-bituminous coal | Bituminous coal | |
|---|---|---|---|---|---|---|---|---|---|---|---|---|---|---|
| Temperature (°C) | — | — | 200 | 225 | 250 | 200 | 225 | 250 | 200 | 225 | 250 | — | — | — |
| Time (h) | — | — | 4 | 4 | 4 | 8 | 8 | 8 | 12 | 12 | 12 | — | — | — |
| Proximate analysis (wt.%, dry basis) | Ash | 3.03 | 3.03 | 3.52 | 2.98 | 3.57 | 5.29 | 3.46 | 3.96 | 1.51 | 2.96 | 10.30 | 5.36 | 7.23 |
| VM | 80.12 | 61.08 | 59.13 | 51.46 | 56.72 | 53.10 | 53.16 | 62.60 | 55.81 | 53.14 | 48.80 | 46.60 | 34.45 | |
| M | 9.29 | 5.93 | 6.35 | 6.80 | 6.02 | 8.21 | 6.28 | 6.46 | 8.16 | 9.16 | — | 15.24 | 6.03 | |
| FC | 7.56 | 29.96 | 31.00 | 38.76 | 33.69 | 33.40 | 37.10 | 26.98 | 34.52 | 34.74 | 41.00 | 48.04 | 58.32 | |
| Ultimate analysis (wt.%, dry basis) | C | 42.55 | 60.78 | 66.33 | 70.95 | 63.13 | 67.60 | 70.77 | 64.52 | 67.02 | 70.81 | 61.64 | 70.68 | 76.25 |
| H | 5.81 | 5.45 | 5.59 | 5.61 | 5.37 | 5.55 | 5.55 | 5.35 | 5.55 | 5.54 | 5.72 | 5.01 | 4.73 | |
| O | 43.56 | 25.92 | 23.39 | 18.43 | 26.58 | 21.38 | 17.93 | 23.27 | 18.42 | 16.90 | 30.13 | 17.36 | 10.57 | |
| N | 1.66 | 2.75 | 2.73 | 3.04 | 2.56 | 2.94 | 3.10 | 2.77 | 2.92 | 3.09 | 1.74 | 1.42 | 1.07 | |
| S | 0.09 | 0.11 | 0.07 | 0.07 | 0.05 | 0.05 | 0.06 | 0.04 | 0.05 | 0.03 | 0.77 | 0.18 | 0.14 | |
| Atomic ratio | H/C | 1.64 | 1.08 | 1.01 | 0.95 | 1.02 | 0.98 | 0.94 | 0.99 | 0.99 | 0.94 | 1.11 | 0.85 | 0.74 |
| O/C | 0.77 | 0.32 | 0.26 | 0.19 | 0.32 | 0.24 | 0.19 | 0.27 | 0.21 | 0.18 | 0.37 | 0.18 | 0.10 | |
| HHV (MJ/kg) | Measured | 16.27 | 24.00 | 26.85 | 29.01 | 25.15 | 27.72 | 28.75 | 25.74 | 27.54 | 28.54 | — | — | — |
| Calculated | 17.13 | 24.87 | 27.22 | 29.37 | 25.51 | 27.78 | 29.28 | 26.30 | 27.96 | 29.39 | 25.00 | 28.70 | 31.00 | |
| Yield (wt.%) | — | — | 43.74 ± 2.85 | 41.69 ± 1.65 | 38.64 ± 1.41 | 41.73 ± 4.76 | 39.12 ± 1.65 | 37.32 ± 1.27 | 38.35 ± 7.49 | 35.83 ± 3.32 | 34.11 ± 2.49 | — | — | — |
| ED | — | — | 1.48 | 1.65 | 1.78 | 1.55 | 1.70 | 1.77 | 1.58 | 1.69 | 1.75 | — | — | — |
| EY (%) | — | — | 64.54 | 68.82 | 68.92 | 64.52 | 66.67 | 65.98 | 60.69 | 60.67 | 59.85 | — | — | — |
- Abbreviations: ED, energy densification; EY, energy yield; FC, fixed carbon; HHV, higher heating value; VM, volatile matter.
2.3. Characterization Analysis
The characterization analysis follows the process of the following: (1) the vario MICRO elemental analyzer was used to test the samples for four elements, according to the standard GB/T 19143-2017 “Methods for the analysis of carbon, hydrogen, oxygen, and nitrogen elements in rock organic matter”; (2) the vario MICRO elemental analyzer was used to determine the total sulfur content of the samples based on the national standard GB/T 214-2007 “Determination of total sulfur in coal”; (3) the functional groups in the samples were studied using a Fourier transform infrared (FTIR) spectrometer (TENSOR 27, Germany). The experimental method involved potassium bromide (KBr) pellet pressing (hydrochar and KBr were mixed at a mass ratio of 1:100). The parameters were set as follows: spectral resolution of 4 cm−1, 32 scans, and a scanning range of 400–4000 cm−1. Moreover, the intrinsic moisture content (M), ash content (Ash), and volatile matter (VM) of the samples were determined according to GBT 30732-2014 “Industrial analysis methods for coal—Instrumental method.” Before the experiment, the samples were ground using an agate mortar and sieved to obtain samples with a particle size of 80–120 mesh. Finally, the thermal properties, weight loss rate, and weight loss rate variation as a function of temperature of the samples were obtained using a thermogravimetric analyzer (HTG-1ZK, China) in combination with a differential scanning calorimeter (HSC-1ZK, China). The crucible material was alumina, and the heating rate was 10°C/min, with the temperature range from room temperature (25°C) to 900°C.
2.4. Methods for Evaluating Combustion Performance
2.4.1. Characteristic Temperature
The ignition and burnout temperatures are critical values for evaluating the combustion properties of biochar. These temperatures were determined based on the measurements obtained from the thermogravimetric analyzer (HTG-1ZK, China). The combustion process in this study was characterized by ignition temperature (Ti), peak combustion rate temperature (Tm), and burnout temperature (Tb). Ti refers to the temperature at which the fuel begins to combust. Tm is the peak temperature on the DTG curve, and burnout temperature is defined as the temperature corresponding to a 98% weight loss rate of the combustible portion of hydrochar. Specifically, Ti is the temperature at the intersection of the tangent line at the point where volatilization begins on the TG curve and the tangent line at the point of maximum weight loss rate [29].
2.4.2. Yield and Energy Calculation
2.4.3. Comprehensive Combustion Index
3. Results and Discussion
3.1. Yield and Physicochemical Properties
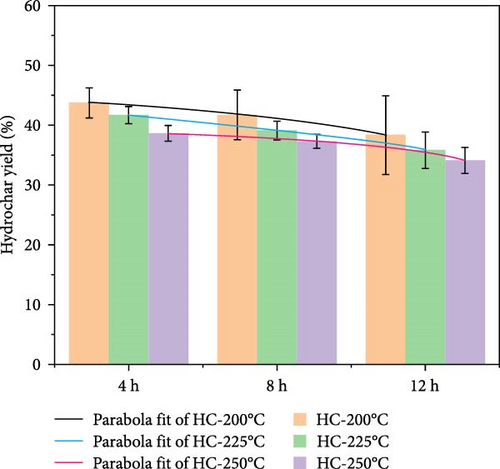
Hydrochars prepared under different hydrothermal temperatures and durations resulted in varying yields (Figure 1). The results indicate that carbonization temperature has a significant effect on the yield of hydrochars, which decreases with increasing HTC temperature. At a duration of 8 h, the HY gradually decreases from 41.73% at 200°C (HC-4) to 37.32% at 250°C (HC-6). This decline is likely caused by the hydrolysis and decomposition of hemicellulose, cellulose, and partial lignin. Similar trends were observed for solid biochar produced from miscanthus leaves at temperatures ranging from 200 to 300°C for 0.5 h [36]. Similarly, variations in duration also exhibited a comparable effect on the HY. Specifically, longer duration resulted in lower yields, indicating that the samples continued to undergo transformation throughout the duration of the process.
The proximate analysis results (Table 1) indicate that the carbon content in the hydrochar products increases while the oxygen content decreases with increasing temperature. This finding is consistent with the results reported by Balmuk et al. in their study of olive oil industry waste [37] and implies that the fuel properties of hydrochars are enhanced due to dehydration and decarboxylation, releasing H2O and CO2 [38]. The VM content in HTC process gradually decreases. For example, in the original GU sample, Vm accounts for 80.12%, while after heat treatment at 250°C (HC-9), the VM content decreases to 53.14%. Furthermore, the fuel ratio (fixed carbon [FC]/VM) increases from 0.09 in the raw GU to 0.49 (HC-1) and further to 0.65 (HC-9), confirming that the HTC method improves the quality of hydrochar. The lower ash content at 200°C may be due to the initial dissolution of inorganic matter under mild reaction conditions and its precipitation at slightly higher temperatures. At 250°C for 12 h, more reactions occur, resulting in increased release of ash, thus raising the ash content. This finding is consistent with the conclusions of Liu et al. [27] in their study on waste biomass.
Phenolic substances generated from lignin hydrolysis in the HTC process polymerize on the surface of the residual solid product, forming polyaromatic hydrochar composed of FC [39]. Simultaneously, high temperatures promote polymerization reactions, increasing the FC content. Other studies indicate that as HTC conditions intensify (i.e., elevated reaction temperature and reaction time), the HHV of hydrochars has been increased [40]. This phenomenon may be associated with the production of high-quality reaction intermediates (e.g., 5-hydroxymethylfurfural [HMF]) during the enhancement of HTC conditions. These reaction intermediates typically possess higher HHV and precipitate within the porous structure of hydrochar, thereby increasing the total carbon content [41]. Coal, as China’s primary energy source, is representative in the energy sector. Therefore, to explore the potential of hydrochars as a fuel, lignite, sub-bituminous coal, and bituminous coal were selected for comparison with the produced hydrochar. As shown in Table 1, except for HC-1 (24.00 MJ/kg), the measured HHV of hydrochars (25.15–29.01 MJ/kg) is higher than that of lignite (25.00 MJ/kg). The HHV of HC-3 (29.01 MJ/kg) is slightly higher than that of sub-bituminous coal (28.70 MJ/kg) [28]. These observations indicate that the quality of hydrochars is enhanced due to chemical dehydration and decarboxylation reactions. Our findings are consistent with those observed in HTC of poultry litter [42], food waste digestate solids [43], spent coffee grounds [44], and unfit compost [45]. Furthermore, the proportion of HHV increase is greater between 200 and 225°C under three different durations than between 225 and 250°C (e.g., the increase ratio between HC-4 and HC-5 is 9.3%, while between HC-5 and HC-6, it is 3.6%), implying that 225°C is a more economically viable temperature for enhancing the HHV of hydrochar.
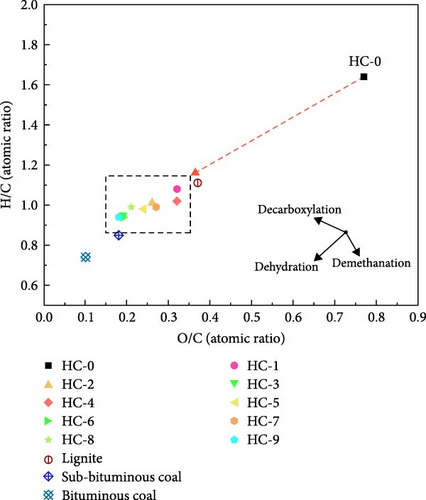
The H/C and O/C atomic ratios decrease from 1.64 and 0.77 in the original raw GU to 0.95 and 0.19 in the hydrochar HC-3, respectively. This change is primarily attributed to dehydration, decarboxylation, and demethylation reactions. As shown in Figure 2, to illustrate the changes in atomic composition after HTC more clearly, the variations in H/C and O/C atomic ratios between raw GU and hydrochars are plotted on a Van Krevelen diagram. The atomic ratios of typical fossil fuels such as lignite, sub-bituminous coal, and bituminous coal are also included. It is noteworthy that the H/C and O/C atomic ratios of hydrochar products are lower than those of lignite, and HC-3 approaches the ratios of sub-bituminous coal consistent with the results of HHV.
ED and EY are commonly used to evaluate the char products derived from lignocellulosic biomass [27, 46, 47]. As documented in Table 1, the ED of hydrochar increases from the low value of 1.48 in HC-1 to the high value of 1.78 in HC-3 with the carbonization temperature, showing an increase of ~20.2%. This increase can be attributed to a significant improvement in the energy density of hydrochar resulting the increased carbon content and decreased oxygen and hydrogen content. However, for hydrochar prepared at 250°C, the change in ED was not significant as increasing duration. This further demonstrates that the influence of duration on hydrochar is less pronounced than that of hydrothermal temperature within the studied range. This result is similar to the observations made by Zhang et al. [48] in their study on water hyacinth. In terms of EY at the same duration, values slightly increase from 200 to 225°C, with an increase of no more than 4.28%, while they remain nearly constant from 225 to 250°C, with a change of no more than 0.82%. Generally, the EY of hydrochar products is expected to decrease with increasing temperature [49]. However, this study yielded results that deviate from this general conclusion, as the lowest EY values in both the 4- and 8-h groups were recorded at 200°C. This anomaly might be attributed to variations in the chemical composition of the raw material and the specific hydrothermal conditions. Notably, the hydrochar produced at 200°C achieved a higher yield but exhibited a lower calorific value, which may account for the observed discrepancy.
3.2. Functional Group Analysis by FTIR
Based on the FTIR spectra (Figure 3), the chemical structure of HTC products at different carbonization temperatures and durations was compared with the raw GU. The observed spectral variations, as depicted in Figure 3a, indicate significant differences between the HTC products and the raw GU, demonstrating the development of chemical transformations during HTC. Additionally, distinct spectral differences were noted among hydrochars obtained at various temperatures for 12 h (Figure 3b). However, when examining hydrochars produced at 250°C for different carbonization times, the spectral differences were less pronounced (Figure 3c), suggesting that temperature exerts a greater influence than time. This observation aligns with the findings of Gao et al. [31].
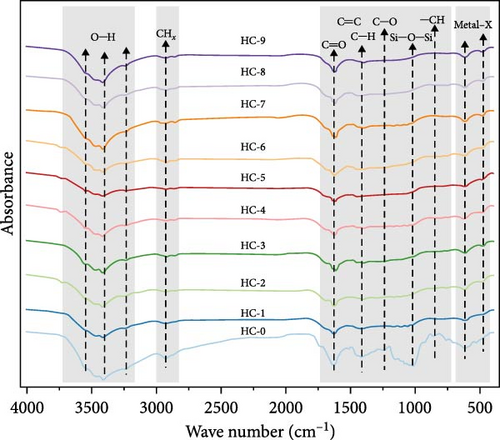
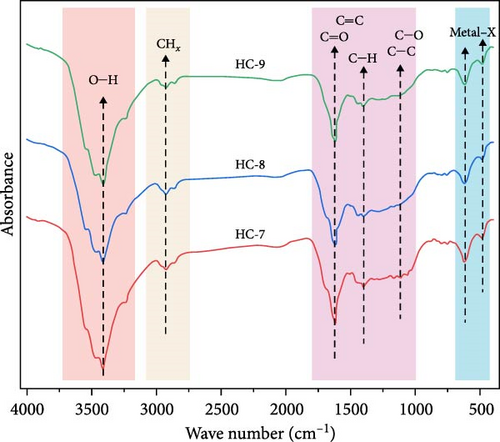

As shown in Figure 3a, the peaks of the spectrum can be divided into four main regions. The stretching vibrations around 3350 cm−1 are attributed to O─H in hydroxyl and carboxyl groups in the samples [50]. Compared to the raw GU, the hydrochar samples exhibit significantly weaker O─H stretching vibration peaks. This is related to the dehydration reactions occurring during the HTC process [51], which is also consistent with the previously mentioned reduction in H/C and O/C values. Moreover, the reduction in hydroxyl and carboxyl content implies that HTC can effectively enhance the hydrophobicity of hydrochars, making the product better suited for fuel storage [52]. From 3000 to 2800 cm−1, the absorption peaks correspond to the vibrations of ─CHx groups, such as the asymmetric and symmetric stretching vibrations of methylene groups [53]. These peaks are noticeably weakened after HTC (Figure 3a), indicating that demethylation reactions occurred during the HTC process [54]. The peaks around 1630 and 1514 cm−1 correspond to ketones and carboxyl groups. The C ═ O stretching vibration in hydrochars also significantly decreases, indicating decarboxylation reactions. Peaks near 1450 and 1112 cm−1 are due to the C ═ C and C─O stretching vibrations of aromatic groups in lignin [55]. The former peak is present in both all hydrochar samples and the raw GU, albeit with varying intensities. This indicates that lignin is not completely decomposed during the HTC process but rather remains partially. The latter peak is also observed in both the raw GU and hydrochar, but as seen in Figure 3b,c, its intensity decreases with increasing temperature, while varying durations have minimal impact on its intensity. This further demonstrates that the influence of varying carbonization temperatures is greater than that of varying carbonization times. The absorption peak at 1040 cm−1, characteristic of Si─O stretching, indicates the presence of minerals in the raw GU and hydrochar samples. However, the peak intensity in the hydrochar is weaker than that in the raw sample, likely due to the dissolution of minerals in the acidic solutions generated during HTC. The peak near 800 cm−1 is attributed to the stretching vibration of C─H bonds on aromatic rings. Additionally, the absorption peak at ~600 cm−1 may correspond to the stretching vibration of metal–X bonds in organic and inorganic halogenated compounds [50]. The consistently weaker intensity of this peak across all hydrochar samples compared to the raw GU suggests that halogenated compounds were removed to a similar extent during HTC.
3.3. Combustion Curve Analysis and Characterization
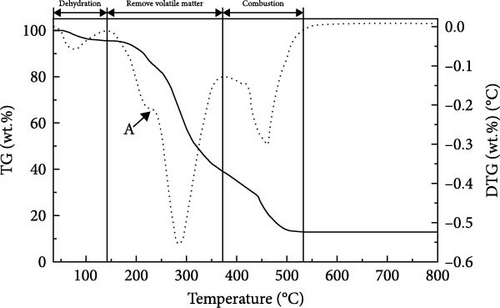
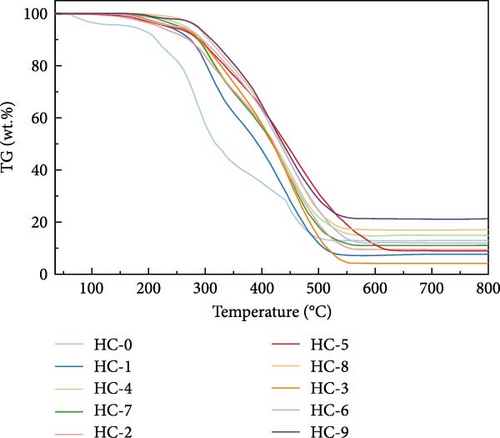
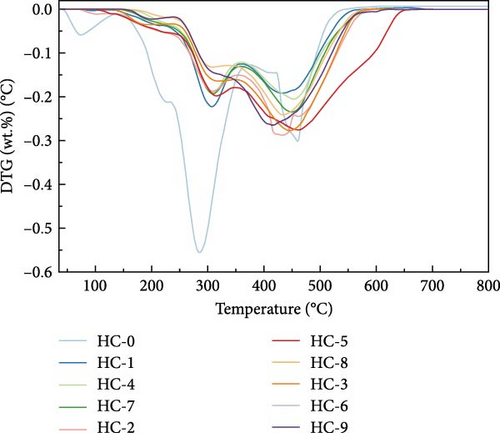
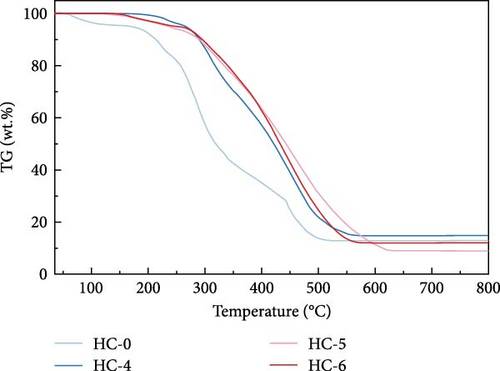
Figure 4 displays the TG–DTG curves of raw GU between 35 and 800°C. The thermal decomposition of raw GU can be divided into three main stages. The first stage occurs in the temperature range of 35–141°C, primarily due to weight loss from moisture content. The second stage, observed in the temperature range of 141–370°C, is mainly associated with the removal of volatile components from the biochar [31]. It is noteworthy that a small plateau is detected at 223°C in the DTG curve, primarily attributed to the decomposition of hemicellulose components [56]. Similar results have been reported in other studies [31, 57, 58]. Interestingly, no distinct peak corresponding to hemicellulose is observed in the hydrochar, indicating that decomposition of hemicellulose at temperatures exceeding 200°C. The third stage occurs in the temperature range of 370–530°C, primarily attributed to the combustion of VM and FC in the hydrochar [32]. Figure 5 illustrates the TG and DTG curves of hydrochar. In Figure 5b, it can be observed that the peaks corresponding to the first and second stages significantly weaken after HTC. This indicates the substantial removal of moisture and volatile components during HTC, while the prominent peak in raw GU suggests higher combustion reactivity. This is attributed to the higher volatile content and structural porosity of raw GU compared to the hydrochar. Additionally, as shown in Figure 5d, higher temperatures result in less distinct peaks in these two stages, and in Figure 5f, the impact of different hydrothermal times is not prominent. This suggests that temperature has a greater influence, consistent with the previous conclusions. In the third stage, the peaks of hydrochar are noticeably broader compared to those of raw GU, which may result from the partial formation of pyrolytic char during HTC [59]. Additionally, the endpoint of the peak region for hydrochar shifts to higher temperatures, indicating the formation of more stable compounds. According to Haykiri-Acma et al. [56], due to the complex structure of lignin, its decomposition occurs over a wide temperature range at a slow rate. Therefore, this phenomenon may be attributed to the synergistic effects among residual lignin, the formed hydrochar, and certain inorganic compounds, consistent with some of the discussed findings above.
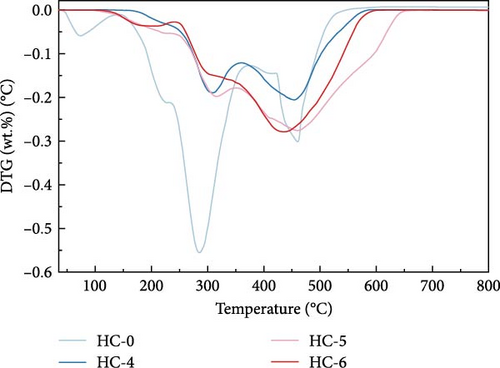
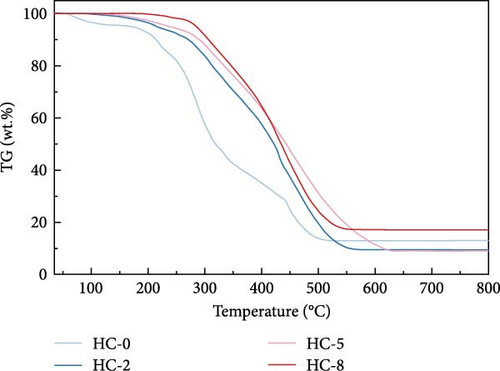
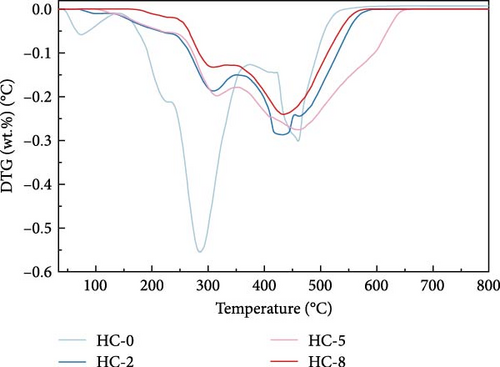
Parameters such as Ti, Tm, Tb, and combustion time for hydrochars were calculated based on the TG curve. Subsequently, the dimensionless combustion index Z was determined using the formula mentioned earlier, and the calculation results are presented in Table 2. The Z index reflects the reactivity of the fuel; higher Z values indicate better reactivity of the sample and a higher content of flammable components [34]. As shown in Table 2, with the increase in temperature under three different hydrothermal times, Ti, Tm, and Tb all increased. This indicates that at higher temperatures, more relatively stable substances are generated during the reaction. For both cases of Z values at 4 and 8 h of hydrothermal time, they decrease with increasing hydrothermal temperature, indicating a decrease in the combustion reactivity of hydrochar. This is consistent with the earlier analysis of changes in chemical composition during HTC. As the HTC temperature increases, dehydration and decarboxylation reactions occur, leading to a reduction in volatile content and a gradual decrease in the relative content of combustible components in hydrochar, thereby lowering its combustion reactivity. However, at a hydrothermal time of 12 h and 250°C, a slight increase was observed, and the proportion of the decrease in Z values between 200 and 225°C in the three hydrothermal times was significantly greater than the decrease between 225 and 250°C. Specifically, the former was 39.3%, while the latter was 9.4%. This suggests that 225°C is a more economically viable temperature for HTC in the studied temperature range, consistent with the earlier conclusion regarding HHV values.
| Sample | Ti (°C) | Tm (°C) | Tb (°C) | Δtq (min) | Δth (min) | Δtq/Δth | Z |
|---|---|---|---|---|---|---|---|
| HC-1 | 264.2 | 306.0 | 545.5 | 21.24 | 5.31 | 4.00 | 0.0702 |
| HC-2 | 323.1 | 430.8 | 581.8 | 18.98 | 6.65 | 2.85 | 0.0276 |
| HC-3 | 339.1 | 450.6 | 569.0 | 17.14 | 7.47 | 2.29 | 0.0244 |
| HC-4 | 308.9 | 453.7 | 579.4 | 20.89 | 5.24 | 3.99 | 0.0385 |
| HC-5 | 316.7 | 455.1 | 637.7 | 18.62 | 6.79 | 2.74 | 0.0335 |
| HC-6 | 322.6 | 448.6 | 579.3 | 17.01 | 7.56 | 2.25 | 0.0265 |
| HC-7 | 325.1 | 431.7 | 570.5 | 20.51 | 5.56 | 3.69 | 0.0428 |
| HC-8 | 336.9 | 435.7 | 583.8 | 15.53 | 7.02 | 2.21 | 0.0239 |
| HC-9 | 338.4 | 436.4 | 576.3 | 16.89 | 8.08 | 2.09 | 0.0248 |
3.4. Analysis of the Influence of Process Conditions on the Combustion Properties of Hydrochar
This study analyzed hydrochar from various aspects, including yield, physicochemical properties, and structural analysis. Based on the results, the formation process of hydrochar was inferred, as illustrated in Figure 6. The HTC of GU in this study was conducted under subcritical water conditions. Under these conditions, water loses its polarity and behaves like an organic solvent. These changes in the properties of water enhance the solubility of organic compounds and catalytic activity in acid–base reactions. For instance, they facilitate the hydrolysis of biopolymers present in biomass [60].
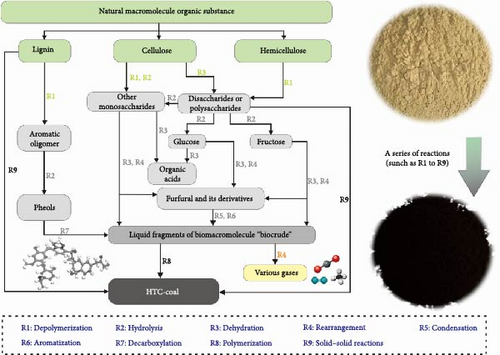
GU primarily contains cellulose (41.6%), hemicellulose (26.5%), and lignin (21.2%). Therefore, this analysis focuses on the chemical reaction processes of these three substances. The chemical formula of cellulose is typically represented as (C6H10O5)n, where n denotes the degree of polymerization (DP). The average DP of woody fibers is at least 9000–10,000 and possibly even up to 15,000 [61]. Under the same hydrothermal conditions, hemicellulose is the most susceptible to degradation, followed by cellulose, and finally lignin [62]. This susceptibility is due to the relatively unstable glycosidic bonds in the glucose units that make up cellulose, which are prone to cleavage under acidic or high-temperature conditions [40]. Consequently, the cellulose structure undergoes rapid degradation due to the cleavage of glycosidic bonds, leading to a decrease in DP. Compared to cellulose, hemicellulose is composed of short-chain heteropolysaccharides and exhibits an amorphous and branched structure. Although the shape of the polysaccharide chains is similar to cellulose, the average DP of hemicellulose is only about 200 [63]. The monosaccharide units that make up hemicellulose mainly include hexoses (glucose, mannose, and galactose) and pentoses (xylose and arabinose) [64]. Lignin is a highly branched aromatic amorphous polymer, with a complex bonding structure consisting of ether bonds, C─C bonds, and ester bonds. Ether bonds are the most common in lignin, accounting for 60%–70% of the bonds. Lignin also contains various oxygen-containing functional groups, including methoxy, hydroxyl, carboxyl, and carbonyl groups, which significantly affect the reactivity of lignin. Hydroxyl groups are another important functional group in lignin, with aliphatic hydroxyl groups typically being the predominant type [64–66].
In the early stages of HTC, partial hydrolysis of hemicellulose, cellulose, and lignin occurs in the presence of water. When long-chain cellulose is broken down, oligomers, primarily polysaccharides, are formed. These oligomers further degrade and convert into glucose, with some also transforming into fructose. As the temperature increases, the reaction progresses to subsequent stages. In the first stage, the products generated from hydrolysis undergo a series of dehydration, cleavage, and rearrangement reactions, leading to the cleavage of C─C bonds and the formation of furfural and its derivatives [67]. These products further polymerize and undergo reverse aldol condensation to form polyaromatic structures as the final products, along with CO2 emission [68]. Additionally, the decomposition process produces acrylic acid, lactic acid, acetic acid, and formic acid, which act as catalysts, enhancing the reaction rate [47]. The carbonization process of hemicellulose is similar to that of cellulose and will not be reiterated here.
Lignin begins to dissolve at temperatures exceeding 200°C [69]. Once specific temperature conditions are reached, a portion of lignin degrades into soluble substances. This reaction stage is rapid, so the influence of time on this stage is minimal, consistent with the experimental results showing a gradual decrease in yield with increasing temperature. Subsequently, lignin undergoes a relatively slow recombination process. In the hydrothermal process of lignin, aromatic oligomers are first formed through depolymerization. These oligomers readily eliminate aliphatic hydroxyl groups from the side chains via low-temperature dehydration, resulting in the formation of unsaturated side chain structures. As a result, the hydrothermal process of lignin generates phenols with unsaturated side chains, which, through recombination facilitated by product interactions, yield phenolic aldehyde products [67]. Additionally, highly condensed char resembling pyrolysis is formed through the solid–solid reactions of undissolved lignin. It should be noted that solid–solid reactions are common in the HTC method, mainly due to the low yield of soluble intermediates, resulting in lower phenolic char [70]. With increasing process conditions, more solid-to-solid conversion occurs, leading to an increase in the yield of polyaromatic char.
As mentioned above, significant dehydroxylation, decarboxylation, and demethylation occur during the HTC process, leading to increased hydrophobicity and higher H/C and O/C ratios in the products. Additionally, due to hydrolysis, some solids dissolve into the water, and subsequent polymerization reactions are unable to reassemble all the dissolved solids into solid form. It is this reason that leads to a decrease in yield. Furthermore, as indicated by the preceding analysis, the three studied reaction times have relatively minor effects on hydrochar. This suggests that, under identical temperature conditions, the aforementioned reaction processes are largely completed within 4 h, with only slow secondary reactions occurring thereafter. Moreover, in the study by Zhang et al. [71], hydrochar obtained within reaction times ranging from 10 to 30 min showed minimal variation in calorific values, indicating that the reaction rate transitions from rapid to slow within shorter durations. Regarding hydrothermal temperature, significant improvements in hydrochar properties were observed between 200 and 225°C, whereas the enhancements were minimal between 225 and 250°C. This suggests that around 225°C is the optimal temperature range for the latter two processes under study.
4. Conclusions
In this study, the effects of HTC conditions on the combustion characteristics of hydrochar from TCM residues are discussed. Hydrothermal temperature exerts a significant influence on the yield, physicochemical properties, and thermal behavior of hydrochar over a wide range. In comparison, the impact of duration between 4 and 8 h is relatively minor, because the reaction rate has decreased to a weak level within 4 h. The yield of hydrothermal carbon decreases, along with a reduction in some oxygen-containing functional groups, with increasing temperature. Meanwhile, the increase in FC, HHV, and stability of hydrothermal carbon confirms that HTC effectively enhances the quality of hydrothermal carbon. A slight increase was observed at 250°C for a duration of 12 h. The reduction in the Z and average HHV values from 200 to 225°C was significantly greater than the corresponding changes from 225 to 250°C. Specifically, for Z values, a decrease of 39.3% occurred in 200–225°C, while only a decrease of 9.4% occurred in 225–250°C. For HHV values, taking a duration of 8 h as an example, the former increased by 9.3%, whereas the latter increased by 3.6%. Collectively, these findings suggested that 225°C was the optimal temperature for the HTC of GU, particularly for the production of high-quality fuel. These results have important implications for further research on the application of hydrothermal carbon products as solid fuels.
Conflicts of Interest
The authors declare no conflicts of interest.
Author Contributions
Yuanzhu Yao: software, investigation, formal analysis, writing–original draft. Peng Xia: conceptualization, methodology, supervision, writing–review and editing. Lingyun Zhao: methodology. Cong Yang: software, validation. Rui Huang: writing–review and editing. Ke Wang: data curation.
Funding
This research was supported by the National Natural Science Foundation of China (Nos. 42002166 and 42162016) and the Natural Science Foundation of Guizhou Province (No. ZK[2020]YIBAN106).
Open Research
Data Availability Statement
The data that support the findings of this study are available from the corresponding author upon reasonable request.


