Blue Hydrogen Production Through Partial Oxidation: A Techno-Economic and Life Cycle Assessment
Abstract
Partial oxidation (POx) as a hydrogen production method has not received comprehensive exploration as the resulting syngas has a relatively low H2/CO ratio compared to established techniques like steam methane reforming (SMR). As a result, this study aims to comprehensively investigate the feasibility of a low-carbon hydrogen production process using POx from both technical-economic and environmental standpoints. To achieve this, the Aspen Plus® software is employed to model a hydrogen production plant with carbon capture integration, referred to as POx-CCS (carbon capture and storage). The research reveals that the overall energy efficiency of the POx-CCS process is around 73%. Moreover, the economic evaluation indicates that the levelised cost of hydrogen (LCOH) is €1.8/ kgH2, given a fuel price of €5.7 per GJ. This cost competitiveness positions POx-CCS in line with conventional hydrogen production methods. From an environmental perspective, the impact of climate change on hydrogen production through the POx-CCS process is assessed to be 1.1 kg CO2 eq./kgH2. This impact is reduced by 69% compared to SMR with CCS.
1. Introduction
Hydrogen can serve as an alternative to fossil fuels due to its high energy content and carbon-free nature [1]. Worldwide hydrogen use can be allocated to four sectors: ammonia production (50%), refinery applications (22%), methanol production (14%) and reduction processes, including ferrous metallurgy and steelmaking (7%) [2–6]. Although multiple green hydrogen production methods have been explored, fossil fuels are still responsible for over 95% of hydrogen production [7, 8]. Therefore, decarbonising the gas network with low-carbon hydrogen can improve the economic life of the existing gas infrastructure. In addition, it has financial and environmental benefits by delaying the commissioning costs and reducing and avoiding emissions associated with the construction of new infrastructure [9]. Moreover, utilising blue hydrogen will pave the way for green hydrogen production in the longer term, including new distribution systems opening up for different hydrogen applications.
Low-carbon hydrogen production is crucial in accelerating the efforts to achieve decarbonising, owing to its potential for almost emission-free combustion, substantial energy density, versatile applicability and operational efficiency [10]. The drive for low-carbon hydrogen production revolves around two principal routes: deriving ‘blue hydrogen’ from fossil fuel sources, notably natural gas (NG) with carbon capture and adopting electrolysis powered by low-carbon electricity sources [11]. It is imperative to recognise that hydrogen production via steam methane reforming (SMR), as the primary means of hydrogen generation [12, 13], inherently results in CO2 emissions ranging from 7.5 to 12 tonnes of CO2 per ton of hydrogen produced [14]. Several research groups have undertaken comprehensive techno-economic evaluations concerning the feasibility of blue-hydrogen generation through SMR coupled with carbon capture and storage (CCS) methodologies. Gaudernack and Lynum [15] studied the economic aspects of gas steam reforming in the presence/absence of CO2 capture. They reported a CAPEX of 25.54 and 14.11 and the OPEX of 4.11 and 3.51 , respectively. Gangadharan et al. [16] evaluated the enviro-economic impact of SMR and reported that its CAPEX is approximately 15.6 M€, the OPEX is 4296€/h and the potential environmental impact (PEI) is 2.84E + 4 PEI/h. Salkuyeh et al. [17] investigated H2 production without/with CCS. They revealed that CCS implementation results in a higher CAPEX of 682.4 M€ in comparison with the case without CCS (197.9 M€), and, respectively, results in the H2 production cost of 1.77 €/kgH2 and 0.89 €/kgH2. Moreover, the life cycle assessment (LCA) results illustrated that the SMR without CCS has the highest global warming potential (GWP), equivalent to 11.5 kg CO2 eq./kg H2. Roussanaly et al. [18] utilised HYSYS v9.0 and the iCCS CO2 value chain tool to simulate an SMR system with 450 tH2/day capacity in the presence and absence of CCS. They demonstrated that a non-retrofitted SMR system’s net power output deteriorated by 47.5% due to CCS power requirement with the respective H2 production costs of 0.18 and 0.12 . Moreover, the cost of CO2 avoidance is shown to be 38.23 €/tCO2,avoided.
The partial oxidation (POx) approach stands out as a method for producing synthesis gas [19], as it is well known for its simplicity, cost-effectiveness, extended operational lifespan, compact physical footprint, rapid response capabilities and streamlined start-up protocols. However, the practical application of POx necessitates incorporating an air separation unit (ASU), thereby introducing an escalated demand for initial investments and capital expenditures. Furthermore, should the ASU draw power from non-renewable electricity sources, the attendant concern of associated carbon dioxide emissions becomes significant [20]. POx can be classified into two distinct categories: catalytic POx, carried out at approximately 700−1000°C and non-catalytic POx, which operates across a temperature range of 1200−1500°C [21, 22]. The non-catalytic iteration of POx finds particular utility in hydrogen generation from heavy hydrocarbons that show constrained reactivity with conventional catalysts. In cases where coal is employed as the primary feedstock, this process is known as gasification [23]. Several studies have been conducted on POx of different fuels. Wang et al. [24] demonstrated the enhanced performance of a composite Ni-Co/Al2O3-TiO2 catalyst for hydrogen production from propane POx, exhibiting increased hydrogen and carbon monoxide selectivities along with reduced carbon dioxide and methane selectivities. This resulted in improved stability and reduced deactivation compared to a commercial catalyst. To enhance the POx of methanol for H2 production, three Ni-Cu/Al2O3 catalysts with varying Ni weight percentages (10, 20 and 30 wt%) were synthesised [25]. Here, incorporating Ni into a copper catalyst effectively boosts its activity. Notably, the optimal conditions for H2 yield were observed at O2/C = 0.5, preheating temperature = 150°C, and Ni wt% = 10, resulting in the highest yield of 2 molH2/molCH3OH. Levikhin and Boryaev [26] designed a high-temperature reactor (HTR) for producing hydrogen-containing gas through non-catalytic hydrocarbon oxidation. Their work covers the physical model, structural aspects and design principles of HTRs and introduces calculated ratios for evaluating HTR dimensions during the preliminary design, accounting for component types and desired hydrogen gas output. Their experimental results indicated that for diesel fuel/oxygen, hydrogen concentration at the outlet is 41–43 vol% with a H2/CO ratio of around 0.9. However, for methane/oxygen, hydrogen concentration is 54–57 vol% with a H2/CO ratio of about 2.1.
However, to the authors’ best knowledge, despite extensive research on hydrogen production methods, there is a noticeable lack of publications thoroughly evaluating NG POx from both techno-economic and environmental perspectives. Hence, this research addresses this gap by demonstrating the feasibility of hydrogen production with NG non-catalytic POx integrated with downstream CO2 absorption. A stand-alone process for a hydrogen production system has been proposed and developed at Aspen Plus. Methyl diethanolamine (MDEA) is considered in this research as it is remarkably more stable and has a lower regeneration energy requirement than other amines. Then, the results obtained from the thermodynamic performance are used for an economic feasibility evaluation. Finally, the proposed cycle’s techno-economic analysis is performed using capital cost, levelised cost of hydrogen (LCOH) production and cost of CO2 capture. Moreover, a LCA is conducted to highlight its environmental performance.
2. Process Description and Model Development
2.1. Process Description
Figure 1 illustrates the suggested hydrogen production process. Here, pressurised NG is completely converted to syngas (mainly comprised of CO, H2, CO2, and H2O) in the reactor in the presence of a sub-stoichiometric quantity of high-purity oxygen from the ASU at 20 bars. The generated syngas is then used for power generation and hydrogen production. A portion of the syngas enters a two-stage water gas shift (WGS) reactor after being depressurised by 3 bars through an expander. The first and second stages of the WGS reaction occur at 488 and 280°C, respectively, with an intermediate heat exchanger. The mixture obtained is then sent to the absorber after condensation at 40°C. The syngas enters the bottom of the absorption column, while the lean MDEA enters from the top. As a result, the CO2-rich solvent and H2-enriched stream leave the column from the bottom and top of the absorber, respectively. High-purity hydrogen is obtained after H2-enriched syngas enters the pressure swing adsorption (PSA) unit with 95% recovery [27]. It is worth mentioning that the PSA tailgas is vented to the atmosphere. Next, the CO2-rich solvent is pumped into the stripper. After cooling the lean solvent in the intermediate heat exchanger, the lean solvent is sent back to the absorber at a lower pressure in the valve. The CO2 stream from the stripper is then dehumidified in the condenser, and the gaseous CO2 exits to the compression conditioning unit for transportation. The current practice for CO2 transportation is to maintain the pressure above the critical pressure (73.8 bar) due to its high density and low viscosity. To overcome the pressure drop within the transportation pipeline, it is proposed to pressurise CO2 to well above the critical pressure point (110 bar). For this reason, multistage compressors are utilised to increase the pressure (to 78 bar), and a cooler decreases the temperature (to 25°C) to liquefy the CO2 stream [28].
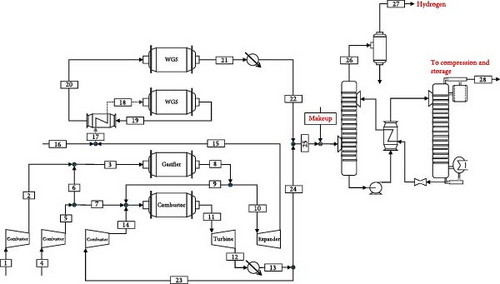
Using this approach, oxy-combustion is employed to treat the remaining syngas, high-purity oxygen (95%) and exhaust gas recirculation (mainly CO2) is used as a temperature moderator. The syngas flow rate used in the power section is adjusted by a splitter compensating for the power consumption of the entire system. This avoids excess power generation from the system to obtain a higher H2 production rate. After expansion in the turbine, the flue gas is cooled down for condensation. It is then partially recycled back to the combustor to lower the combustion temperature, and the rest is mixed with the H2-enriched gas entering the MDEA carbon capture unit.
2.2. Model Development
In this study, the process is being simulated in Aspen Plus. The ELECNRTL equation of state is used to simulate the MDEA carbon capture unit, while the Peng–Robinson property model is used for the other parts of the simulation. Moreover, the equilibrium calculation is used to simulate the absorber and stripper columns. The PSA unit is modelled with a simple separator in Aspen Plus with a 95% recovery. Table 1 summarises the parameters used for other components.
| Unit | Aspen Plus ID | Description |
|---|---|---|
| Condenser | Flash2 | Pressure change = 0, duty = 0 |
| Cooler | Heater | — |
| Heat exchanger(s) | HeatX, MHeatX | — |
| Combustor | RGibbs | — |
| Turbine, compressor | Compr, MCompr | — |
| Expander | Compr | — |
| Absorber | RadFrac | 15 stages, standard convergence |
| Regenerator | RadFrac | 20 stages, partial vapour condenser, standard convergence, reflux ratio = 0.6 mol, boil up ratio = 0.1 mole |
| WGS | RGibbs | — |
| Pump | Pump | — |
| Valve | Valve2 | — |
| PSA | SEP2 | — |
- Abbreviation: WGS, water gas shift.
The MDEA carbon capture plant was validated by Khallaghi et al. [29], whose results were in agreement with those presented by Romano et al. [30]. For this study, NG is the feedstock, and its properties for gasification are represented in Table 2.
| Parameter | Value | |
|---|---|---|
| Temperature (°C) | 15 | |
| Pressure (bar) | 1.25 | |
| Composition (mol [%]) | ||
| Methane | 89 | |
| Ethane | 7 | |
| Propane | 1 | |
| Butane | 0.1 | |
| Pentane | 0.01 | |
| CO2 | 2 | |
| N2 | 0.89 | |
| Lower heating value (MJ/kg) | 46.5 | |
- Abbreviation: NG, natural gas.
Furthermore, assumptions are made to simulate the POx system, presented in Table 3.
| Parameter | Value | Reference |
|---|---|---|
| MDEA CO2 absorption process | — | [32] |
| MDEA/water content in the lean solvent (wt%) | 25/72 | — |
| Solvent/CO2 ratio (wt% basis) | 3/25 | — |
| Steam condition at the reboiler (bar) | 6.0 | — |
| Pinch point ΔT in the regenerative heat exchanger (°C) | 10.0 | — |
| Heat exchangers | — | [33] |
| Minimum ΔT gas–gas heat exchanger (°C) | 25 | — |
| Minimum ΔT gas–liquid heat exchanger (°C) | 10 | — |
| Minimum ΔT liquid–liquid heat exchanger (°C) | 10 | — |
| Turbomachines | — | — |
| Turbine isentropic efficiency (%) | 93 | — |
| Turbine delivery pressure (bar) | 1.015 | — |
| Pump hydraulic/mech efficiency (%) | 75/95 | — |
| CO2 compression train | — | [33] |
| Number of stages | 2 | — |
| Intercooler’s temperature (°C) | 40 | — |
| Intercooler’s pressure drops (Pinlet [%]) | 5 | — |
| Isentropic efficiency (%) | 89 | — |
| Mechanical efficiency (%) | 95 | — |
| CO2 delivery pressure (bar) | 110 | — |
| CO2 delivery temperature (°C) | 25 | — |
- Abbreviations: MDEA, methyl diethanolamine; NG, natural gas; POx, partial oxidation.
The mass balance and composition for the main streams of the process are summarised in Table 4.
| Streams | 6 | 8 | 10 | 7 | 14 | 11 | 18 | 20 | 25 | 26 | 27 | 28 |
|---|---|---|---|---|---|---|---|---|---|---|---|---|
| P (bar) | 20 | 20 | 20 | 20 | 20 | 20 | 3 | 2.9 | 2.9 | 2.5 | 1.0 | 110 |
| T (°C) | 300 | 950 | 950 | 300 | 129 | 1,200 | 300 | 205 | 39.4 | 51.9 | 25 | 26 |
| m (kg/s) | 17 | 27 | 24 | 2.6 | 27.3 | 32.9 | 31.3 | 31.3 | 30.3 | 6.4 | 2.1 | 24.5 |
| Composition | ||||||||||||
| H2O | — | 21.1 | 21.1 | — | 0.9 | 15.3 | 37.4 | 20.6 | 2.0 | 4.7 | — | 2.6 |
| O2 | 95 | — | — | 95 | 5.9 | 5.0 | — | — | 0.2 | 0.3 | — | — |
| Ar | 4.0 | 1.2 | 1.2 | 4.0 | 7.1 | 6.0 | 0.9 | 0.9 | 1.3 | 1.9 | — | — |
| N2 | 1.0 | 0.5 | 0.5 | 1.0 | 2.3 | 1.9 | 0.4 | 0.4 | 0.6 | 0.8 | — | — |
| CO | — | 31.4 | 31.4 | — | — | — | 24.9 | 8.2 | 1.9 | 2.3 | — | — |
| CO2 | — | 2.7 | 2.7 | — | 83.7 | 71.5 | 2.1 | 18.9 | 31.2 | 1.4 | — | 97.2 |
| H2 | — | 42.9 | 42.9 | — | — | — | 34.0 | 50.8 | 62.4 | 88.4 | ~1 | — |
3. Techno-Economic and Environmental Assessment Indicators
The summation of all the individual equipment purchase costs will result in the total equipment cost (TEC) illustrated in Equation (8). The scaling factor (f), reference component cost (CA) and capacity factor (CF) (QA) of different plant components are presented in Table 5:
| Component | Scaling factor | CA (M€) | QA | f | Reference |
|---|---|---|---|---|---|
| CO2 capture unit (MDEA) | CO2 mass flow rate (t/h) | 8.8 | 12.4 | 0.6 | [35] |
| CO2 purification unit | Mass flow (t/h) | 55.98 | 266.6 | 0.6 | [35] |
| CO2 compressor and condenser | Power (MW) | 44 | 50.5 | 0.67 | [34] |
| Compressor | Power (kW) | 0.44 | 413 | 0.68 | [35] |
| WGS | H2 and CO flow rate (kmol/s) | 18.34 | 2.45 | 0.65 | [36] |
| Fuel compressor | Power (MW) | 8.1 | 15.3 | 0.67 | [34] |
| Gas turbine | Power (MW) | 49.4 | 272.1 | 0.67 | [34] |
| Heat exchanger | Heat transfer (MW) | 6.1 | 828 | 0.67 | [34] |
| Air separation unit | Oxygen flow rate (kg/s) | 26.6 | 28.9 | 0.7 | [37] |
| PSA unit | Flow rate (kmol/h) | 34.3 | 17,000 | 0.6 | [38] |
- Abbreviations: MDEA, methyl diethanolamine; WGS, water gas shift.
Assumptions for the calculation of the TAC are illustrated in Table 6.
| Parameter | Value | Reference |
|---|---|---|
| Installation cost as a fraction of total purchase cost (%) | 80 | [39] |
| VOM as a fraction of total capital cost (%) | 2.0 | [40] |
| FOM as a fraction of total capital cost (%) | 1.0 | [40] |
| Plant lifetime (T) (years) | 30 | [41] |
| Project interest rate (r) (%) | 12 | [40] |
| CF (%) | 95 | [27] |
- Abbreviations: CF, capacity factor; FOM, fixed operating cost; VOM, variable operating cost.
The net climate change impact associated with the hydrogen production from NG POx integrated with CCS is assessed as per the ISO 14040/44 standards [42, 43] for the LCA. The scope of the study is from cradle to gate and includes the construction of the POx plant, the production of NG, the production of hydrogen and heat in the POx plant, the MDEA CO2 absorption process and the compression of captured CO2. The unit of analysis is defined as the ‘production of 1 kg of hydrogen’. It is assumed that the plant is in the United Kingdom. The key inventory data are provided in Table 7. The construction-related impacts are estimated using LCA data from Ecoinvent v3.8 [44] for various plant equipment. The LCA data for NG, deionised water and waste disposal are also obtained from Ecoinvent [44] v3.8. Since the Ecoinvent v3.8 database does not have the data for MDEA, they are estimated using a stoichiometric relation and the data for methylamine and ethylene oxide from Ecoinvent. The impact allocation between hydrogen and heat (co-product) is carried out using energy allocation.
| Data | Unit | Value |
|---|---|---|
| Natural gas | kg/kgH2 | 4.76 |
| MDEA (make-up) | g/kgH2 | 3.8 |
| Deionised water | l/kgH2 | 3.5 |
| Wastewater (condensate) | l/kgH2 | 0.5 |
| Heat (co-product) | MJ/kgH2 | 37 |
| CO2 emissions to air | kg/kgH2 | 1.13 |
| CO2 captured for storage | kg/kgH2 | 11.48 |
- Abbreviations: CCS, carbon capture and storage; MDEA, methyl diethanolamine; POx, partial oxidation.
4. Results and Discussion
The technical performance of the plant is presented in Table 8. It reveals that the proposed system’s hydrogen production rate is 2.1 kg/s while the MDEA unit captures 91% of the produced CO2. The system is designed to be stand-alone. The power requirement for ASU and compression is internally generated for the utilities within the plant by the expander and gas turbine. The expander and gas turbine (both with a pressure ratio of 6.6) generate 23 MW and 15.6 MW of power, respectively. The ASU, with a 15.2 MW power requirement, is the highest power consumption component of the system. The heat for the steam generation required in the WGS process is provided by cooling down the WGS outlet stream. The heat requirement for the reboiler is 27.1 MW, which results in 1.1 MJ/kgCO2 specific heat requirement and is generated internally by cooling down the exhaust gas from expander and gas turbine. The remaining technical and thermodynamic performance data of this POx system are summarised in Table 8.
| Parameters | Unit | Value | |
|---|---|---|---|
| Without CCS | With CCS | ||
| NG flow rate | kg/s | 10 | 10 |
| Thermal input | MWth | 465 | 465 |
| Gas turbine power generation | MWe | 10.3 | 23.1 |
| Syngas expander power generation | MWe | 19.6 | 17.7 |
| NG compression power consumption | MWe | 4.5 | 4.5 |
| ASU power consumption | MWe | 15.2 | 15.2 |
| Oxygen compression power consumption | MWe | 7.2 | 7.2 |
| CO2 compression power consumption | MWe | — | 7.1 |
| Recycled gas compressor power consumption | MWe | 3.0 | 6.8 |
| Heat requirement for the reboiler | MWth | — | 27.1 |
| Net heat available | MWth | 97.6 | 77.8 |
| CO2 emission | kg/s | 24.8 | 0.9 |
| CO2 flow rate for storage | kg/s | — | 23.9 |
| Carbon capture rate | % | — | 96.4 |
| H2 production rate/purity | (Kg/s)/(%) | 2.3/99.9 | 2.1/99.9 |
| Thermal output | MWth | 285.9 | 261.1 |
| Cold gas efficiency | % | 61.5 | 56 |
| Overall energy efficiency | % | 82.5 | 73 |
- Abbreviations: ASU, air separation unit; NG, natural gas; POx, partial oxidation.
The economic aspect of this plant is presented in Table 9. It can be seen that the carbon capture and compression units are responsible for over 36% of the TEC. The TDPC is calculated to be €232 M. Putting the annual investment under scrutiny, it is found that the plant imposes a yearly cost of €124.2M. However, considering the revenue of heat production, it can be seen that this would compensate for an amount of 7.3 M€/year and reduces the TAC value to a net amount of 116.9 M€/year.
| Parameter | Unit | Value |
|---|---|---|
| MDEA unit | M€ | 29.0 |
| WGS reactors + heat exchanger | M€ | 22.9 |
| Gas turbine(s) | M€ | 16.7 |
| CO2 compressor units | M€ | 17.7 |
| PSA | M€ | 15.7 |
| NG compressor | M€ | 3.6 |
| ASU + O2 compressor | M€ | 22.5 |
| Total equipment cost (TEC) | M€ | 128.9 |
| Total installation cost (TIC) | M€ | 103.1 |
| Total direct plant cost (TDPC) | M€ | 232.0 |
| Total plant cost (TPC) | M€ | 336.4 |
| Annualised plant cost | M€/year | 34.7 |
| Fuel costa | M€/year | 79.4 |
| Heat revenueb | M€/year | 7.3 |
| Fixed O&M | M€/year | 6.7 |
| Variable O&M | M€/year | 3.4 |
| Total annualised cost | M€/year | 116.9 |
| LCOH | €/kgH2 | 1.8 |
| CO2 capture cost | €/tCO2 | 160.9 |
- Abbreviations: ASU, air separation unit; CCS, carbon capture and storage; LCOH, levelised cost of hydrogen; Pox, partial oxidation; TDPC, total direct plant cost; TEC, total equipment cost; TIC, total installation cost; TPC, total plant cost.
- aNG price for the initial economic results is €5.7/GJ.
- bHeat price for the economic assessment is assumed to be 55% of the NG price.
| Discount rate (%) | NG price (€/GJ) | Heat price (€/GJ) |
|---|---|---|
| 3.5 | 5.9 | 3.2 |
| 10 | 5.7 | 3.1 |
| 12 | 5.5 | 3.0 |
- Abbreviation: NG, natural gas.
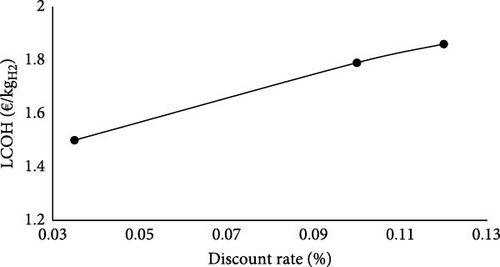
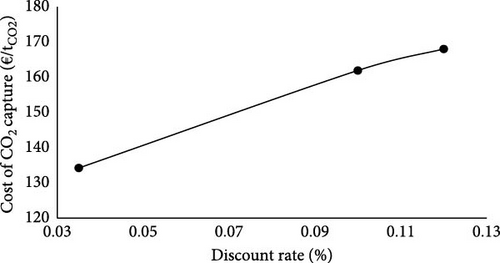
Figure 2 illustrates the impact of interest rate on the LCOH and the cost of CO2 capture. Although increasing the discount rate from 3.5% to 12% decreases the energy (fuel and heat) price, it increases the annual capital cost from 12.2 M€ to 41.6 M€; and consequently, the LCOH (from 1.5 €/kgH2 to 1.9 €/kgH2) and cost of CO2 capture (from 134.2 €/tCO2 to 168.0 €/tCO2).
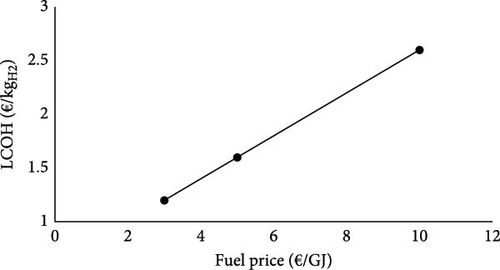
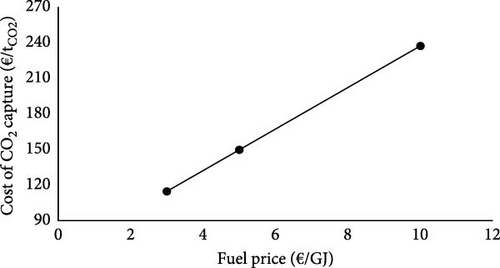
The effect of fuel price on the LCOH and the cost of CO2 capture is illustrated in Figure 3. It is worth mentioning that the heat price correlation with the fuel price is still kept constant in this sensitivity analysis. Therefore, while the fuel price ranges between 3 and 10 €/GJ, the heat price ranges between 1.6 and 5.5 €/GJ simultaneously. Figure 3 reveals a direct correlation between the fuel price and LCOH and the cost of CO2 capture. At the fuel price of 3 €/GJ, the LCOH and capture costs are 1.2 €/kgH2 and 114.6 €/tCO2, respectively. However, an increment of the fuel price by 7 €/GJ raises the LCOH and the capture costs to 2.6 €/kgH2 and 237.2 €/tCO2.
It is worth mentioning that considering a wide range of fuel prices and discount rates offers a sufficient understanding of the LCOH in various scenarios.
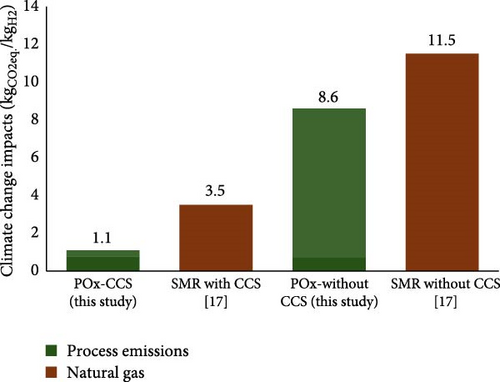
As shown in Figure 4, the climate change impact of hydrogen production via the POx with and without the CCS system is 1.1 kgCO2 eq./kgH2 and 8.6 kgCO2 eq./kgH2, respectively. For the POx-CCS system, using NG accounts for 69%, while the CO2 emissions from the process contribute to 30%. On the other hand, the contributions of plant construction, MDEA and waste disposal are very small (<1%). In the case of POx without the CCS system, the climate change impact is mainly due to CO2 emissions from the POx system, which accounts for 92% of the impact, while the contribution of NG is 7.7%. Therefore, the climate change impact of hydrogen production via the POx with and without CCS processes is 69% and 25% lower than those of the SMR with CCS and SMR without CCS processes, respectively. Pox’s lower climate change impact than SMR is mainly due to the exothermic nature of POx and combustion, which eliminates the need for external heat, significantly reducing CO2 emissions. Moreover, the excess heat within the system can be utilised elsewhere to eliminate the associated CO2 emission for heat production.
SMR is still the leading hydrogen production technology with an LCOH of about 1 €/kgH2 for SMR without CCS and 1.5 €/kgH2 with CCS integration [45]. Coal gasification with CCS, while more expensive, has an LCOH of 2.8 €/kgH2 [45], reflecting the higher costs associated with capturing and storing carbon from coal. Electrolysis using grid electricity remains costly at 3.0–6 €/kgH2 without CCS, but when powered by renewable energy, the LCOH can be competitive, around 1.7–3.7 €/kgH2, depending on electricity prices and electrolyser efficiencies [46].
When considering cradle-to-gate analysis, the environmental impact of hydrogen production methods varies significantly in terms of carbon emissions. SMR with CCS can reduce emissions to about 1–3 kgCO2 eq./kgH2 [47], significantly lower than the 11 kgCO2 eq./kgH2 without CCS [48]. Coal gasification with CCS, though still carbon-intensive, reduces emissions to ~5–10 kgCO2 eq./kgH2 compared to the 18–20 kg kgCO2 eq./kgH2 without CCS [49]. Electrolysis using grid electricity remains relatively high at 11.1 kgCO2 eq./kgH2 without CCS [48], but when paired with renewable energy, it has a carbon footprint close to zero, about 0–1 kgCO2 eq./kgH2 [48]. It is found that the proposed cycle, with a 96.4% CO2 capture rate, a climate change impact of 1.1 kgCO2 eq./kgH2, and an LCOH ranging from 1.2 €/kgH2 to 2.6 €/kgH2 (at different interest rates and fuel prices), is competitive with state-of-the-art hydrogen production technologies.
5. Conclusions
This study investigated a stand-alone system for hydrogen generation that exploits NG as the feedstock. The system is simulated using Aspen Plus software and evaluated from techno-economic and environmental points of view. The system’s technical analysis reveals that the plant’s overall energy and CGE are 73% and 56%, respectively. Moreover, the heat recovery of 77.8 MW generates a revenue of about 7.3 €/year. A detailed economic assessment reveals that this system, with an LCOH of 1.8 €/kgH2, is competitive with other state-of-the-art hydrogen production technology, such as SMR integrated with CCS. The LCA findings also indicate that the climate change impact of hydrogen production via the POx-CCS process is 69% lower than that of the SMR with the CCS process (1.1 kgCO2 eq./kgH2 and 3.5 kgCO2 eq./kgH2, respectively). The system (with 0.9 kg/s CO2 emission) achieves a CCR of 96%. Additionally, the lower climate change impact of the evaluated system is due to the excess heat of 77.8 MW, which can be utilised for other purposes, compensating for CO2 emission.
Nomenclature
-
- :
-
- Mass flow rate
-
- f:
-
- Scaling factor
-
- FO&M:
-
- Fixed operating and maintenance cost
-
- r:
-
- Interest rate
-
- T:
-
- Project lifetime
-
- VO&M:
-
- Variable operating and maintenance cost
-
- Wnet:
-
- The net power output of the entire system
-
- ηth:
-
- Net thermal efficiency
-
- CA:
-
- Reference equipment cost
-
- CB:
-
- Equipment capital cost
-
- QA:
-
- Reference equipment capacity
-
- QB:
-
- Equipment capacity
-
- η:
-
- Isentropic efficiency.
Abbreviations
-
- ASU:
-
- Air separation unit
-
- CCR:
-
- Carbon capture rate
-
- CCS:
-
- Carbon capture and storage
-
- CF:
-
- Capacity factor
-
- CGE:
-
- Cold gas efficiency
-
- GWP:
-
- Global warming potential
-
- HTR:
-
- High-temperature reactor
-
- LCOH:
-
- Levelised cost of hydrogen
-
- LHV:
-
- Lower heating value
-
- MDEA:
-
- Methyl diethanolamine
-
- NG:
-
- Natural gas
-
- OC:
-
- Owner’s cost
-
- SMR:
-
- Steam methane reforming
-
- TAC:
-
- Total annualised cost
-
- TPC:
-
- Total plant cost.
Conflicts of Interest
The authors declare no conflicts of interest.
Funding
No funding was received for this manuscript
Open Research
Data Availability Statement
All the relevant data are included in the paper.


