Exploring of Wind Energy Potential and Optimal Site Selection for Wind Energy Plants Installations in Erzurum/Turkey Based on Multicriteria Site Selection
Abstract
Wind energy is a renewable, sustainable, and localized power source. These features motivate countries to adopt wind turbines, with many nations employing incentives to enhance the installed capacity of these systems. The selection of locations for wind turbine installations is crucial for optimizing turbine performance and augmenting installed capacity. This study examined 20 distinct places in the province of Erzurum as potential locations for the development of wind power installations. This research identified prospective locations for the development of wind power facilities in Erzurum, Turkey, employing a geographic information-based multicriteria decision-making (MCDM) methodology and a geographic information system (GIS). The plan incorporated topographical, structural, climatic, and environmental factors, including wind velocity, land cover classification, gradient, closeness to land and substations, transportation networks, communities, fault lines, power grids, and erosion areas. A wind farm suitability map was created using a weighted process questionnaire and assessed criteria maps, employing the analytical hierarchy process (AHP). The result map shows that 83.052% of the total area is designated as favorable, while 15.858% is rated as most favorable. This study highlighted the erosion criterion for the first time. This investigation utilized 17 criteria. The aim is to locate a wind power facility in a more suitable site by employing these characteristics. In district-level evaluations of the wind power plant suitability map, İspir province occupies the top position.
1. Introduction
The demand for electrical energy is always increasing due to worldwide technological progress. Research on energy conservation and renewable power generation is ongoing, as the fossil fuels now employed for electricity generation are finite and will ultimately be depleted. Research in this field involves the production of energy from wind resources, which have shown considerable progress worldwide, especially in Europe in recent years [1]. Since the introduction of small-power wind turbines in 1950, wind energy has emerged as a feasible and cost-effective alternative energy source. The interest in wind energy has risen owing to its little adverse environmental impacts [2–5]. This renewable energy source is among the most advanced, cost-effective, clean, and economically viable energy choices worldwide [6–10]. Consequently, the utilization of wind energy is increasingly gaining popularity in Turkey and globally. In recent years, Turkey’s demand for energy has surged rapidly, driven by the country’s ongoing social and economic growth. Wind energy is essential to Turkey’s historical and economic progress. Recent developments have prompted numerous papers regarding wind energy. The research primarily focused on the significance of wind energy [11–13] and its potential [14–16]. The objective is to identify the optimal site for a wind power project in Erzurum province that is resilient to erosion and seismic activities, which may be triggered by specific environmental conditions [17–19]. The research assessed temperature data, digital elevation model (DEM) maps (slope-elevation data), the location of energy transmission lines, seismic activity, and other natural disasters to find and delineate regions suitable for wind energy utilization. The expenses associated with power generation from wind energy have not been thoroughly examined despite minimal research on strategies to alleviate uncontrollable crisis threats such as natural disasters, including earthquakes and erosion [20–30]. This study aims to identify the optimal location for a wind farm in Erzurum province. This research presents a viable approach to that purpose. The site of the wind farm is determined by the assessment of the fuzzy theory-based analytical hierarchy process (AHP) method. This study utilized AHP and geographic information system (GIS) methodologies to ascertain the relevant weights of essential criteria affecting the optimal placement of wind farms. The AHP methodology is employed to locate and evaluate potential locations for wind farms. Prioritizing the implementation of wind energy is a vital responsibility for investors. This article outlines the case study performed in the province of Erzurum according to the specified criteria. This study seeks to address the research deficiencies identified in previous investigations. The literature has shown this through a meticulously designed integrated method. This research is one of the first studies conducted in Erzurum province and is expected to substantially enhance the existing literature. A literature analysis indicates that investors are affected by natural disasters.
2. Literature Review
The determination of a facility’s location at both macro and local levels is thoroughly examined in the literature. The optimal site selection problem has been examined across various sectors, including solar power plant (SPP) site selection [31], hybrid power plant site selection [32], warehouse site selection [33], and plant site selection [34], as identifying the investment location is the initial step following the determination of the investment type. The methodologies employed for problem-solving include multicriteria decision-making (MCDM), fuzzy logic, Monte Carlo simulation, and linear programing. An examination of the strategies employed in the literature for optimal site selection highlights a distinct inclination toward CRM methodologies: TOPSIS, ANP, AHP, and VIKOR. Some studies utilize combinations in conjunction with the specific application of CRM approaches. This study thoroughly investigates the energy sector, as demonstrated by the analysis of literature classified by industry. The subsequent power plants have been examined: wind power plants [35–38] and SPPs [39, 40]. The principal problem in the establishment of wind power facilities is the identification of suitable locations, and a comprehensive literature analysis has been undertaken to support this research. This report analyzes research on hybrid power plants alongside evaluations of several types of power plants. The literature predominantly examines systems that integrate solar and wind generation facilities within the context of renewable hybrid power plants. Initially, Janke [41] employed GIS to assess suitable sites for wind and solar hybrid power plants, pinpointing land classes in Colorado associated with significant wind and solar potential. Aydin et al. [42] investigated site selection for hybrid solar and wind power plants with fuzzy FCDM algorithms across six critical steps. Jun et al. [43] proposed employing the ELECTRE II methodology to address the macro site selection issue for the establishment of hybrid wind and solar generating installations. In his study, Hansen [44] investigated the establishment of a hybrid power plant in the province of Ordu. Engin et al. [45] argue that there are compelling justifications for the adoption of hybrid energy systems, together with appropriate standards for implementation. Chao et al. [46] employed fuzzy TOPSIS and Weibull distribution to evaluate the optimal site for the establishment of a wind-solar hybrid power plant in Fars, Iran, among seven candidates. Ultimately, Lee et al. [47] introduced decision assistance tools for the site selection of a hybrid wind and solar power facility in Isfahan, Iran. The proposed model employed the AHP methodology, a technique of CCM. Table 1 provides a summary of the research categorized by approach and application categories based on this literature evaluation.
| Land cover type | References used as evaluation |
|---|---|
| Wind speed | [48–75] |
| Elevation | [59–61, 63, 64, 66–69, 71, 73–75] |
| Slope | [13, 23, 48, 49, 52, 53, 55, 60, 63–66, 68, 70–78] |
| Aspect | [13, 60, 61, 65, 70, 71, 73–75, 77] |
| Land use | [13, 48, 50–52, 55, 57, 63, 65, 66, 71, 73–75, 77–89] |
| Distance to road | [48, 51, 52, 55–57, 60–65, 68, 72–78, 80–82, 85, 88–95] |
| Distance to settlement | [13, 48, 50–53, 55–57, 60, 63–65, 68–70, 72–79, 83, 85, 88, 90–92, 94–98] |
| Distance to surface water | [13, 48, 50–53, 55, 57, 65, 68, 73–75, 78–83, 89, 99, 100] |
| Land cover type | [13, 51, 63, 65, 67, 69, 70, 72–77, 79–88, 101] |
| Distance from electricity grid | [48, 51, 52, 55, 57, 59, 60, 62, 68, 70, 72–76, 85, 87, 88, 90, 94, 95] |
| Distance from substations | [62, 72–75, 88] |
| Distance from fault lines | [13, 64, 72–75, 78, 85, 88] |
| Solar irradiation | [13, 59, 65, 67, 70, 72–75, 77] |
| Air temperature | [59, 67, 73–75, 102–109] |
| Air humidity | [59, 73–75, 102, 110–113] |
| Air pressure | [67, 73–75, 102, 114, 115] |
| Land surface temperature | [53, 59, 67, 73–75, 102, 116–118] |
| Erasion | [119–124] |
| Land use capacity | [59, 62, 71–75, 102] |
2.1. Study Area
The province of Erzurum constitutes the primary basis for the research field. The province of Erzurum is located between the longitudes of 39°N and 41°E. The northern boundary adjoins the Eastern Black Sea Region, the southern border is adjacent to Bingöl and Muş, the western frontier intersects with Erzincan, and the eastern border converges with Ağrı, Kars, and Ardahan. The border provinces are Ağrı, Ardahan, Artvin, Bayburt, Bingöl, Erzincan, Kars, Muş, and Rize. The expanse of Erzurum is 25.066 square kilometers (Figure 1). The districts of Aşkale, Çat, Hınıs, Horasan, İspir, Karaçoban, Karayazı, Köprüköy, Narman, Olur, Oltu, Pasinler, Pazaryolu, Şenkaya, Tekman, Tortum, and Uzundere complement the central districts of Aziziye, Palandöken, and Yakutiye. Yakutiye District is the most densely inhabited district center. Pazaryolu is the district with the smallest population. Karayazı is the highest district, positioned at an altitude of 2350 m, whereas Uzundere is the lowest, situated at 1000 m above sea level. The İspir District covers the largest area. Erzurum, the provincial center, is situated physically and geologically on the southern slopes of the Palandöken Mountains, on a northwest-oriented plain. Geologically, faults mostly delineate the boundary between ancient and contemporary alluvial deposits in the northwestern plain and the southern hilly region, which predominantly consists of rocks dated between 10 and 70 million years and volcanic formations.

3. Materials and Methodology
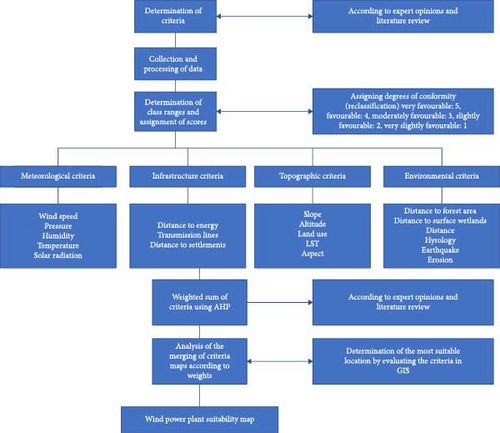
This study utilizes data gathered from the districts of Ispir, Aziziye, Narman, Oltu, Tekman, Pasinler, Enkaya, Hınıs, Tortum, Yakutiye, Aşkale, Karayazı, Pazaryolu, and Olur, together with our own measurements and a decade-long average from the General Directorate of Meteorology. Criteria were formulated by an exhaustive analysis of wind power plant research. Upon establishing the criteria, class ranges were delineated for each criterion, and score values were allocated to these ranges, considering the insights from prior studies and expert recommendations. The criteria were evaluated based on the perspectives of a community comprising expert recommendations and academic expertise from various disciplines, including civil, agricultural, geological, electrical, landscape, and industrial engineering. Criteria values were established in six categories, with scores ranging from 0 to 5. Table 1 enumerates the class ranges together with their respective relevance scores for the criteria. Following the assignment of score values, the criteria maps were constructed, and the organizational data were assessed. The maps illustrate wind velocities at a height of 10–200 m, diverse Corine land cover classifications, slope gradients, and distances to substations, highways, urban areas, fault lines, erosion zones, and power grids. Criteria maps enabled a uniform assessment across all standards by categorizing them into established classifications and ratings. Criteria weights were established by the AHP technique by employing the insights of academicians and experts in wind energy. AHP weights were employed to generate a wind farm suitability map and to build criteria maps. GIS technologies were employed for all spatial operations in the research. The subsections delineate the process. Figure 2 delineates the methodological framework of the investigation.
3.1. Exclusion Area
The establishment of exclusion zones constitutes the preliminary stage in the site selection process. These are areas characterized by physical and/or regulatory impediments that render wind energy generation unfeasible. These areas encompass military installations, conservation areas, waterways, and populated regions. Some studies incorporated legally prohibited locations within the excluded regions, and buffer zones were established based on the minimum distance surrounding the areas of interest. This study omits areas with a slope over 30%, along with towns, protected natural areas, water bodies, tourism facilities, airports, urban zones, industrial sites, social places, agricultural fields, animal husbandry regions, military installations, and mining operations. The General Directorate of Spatial Planning supplied all maps in vector format (shapefile), excluding the slope map.
3.1.1. Wind Power Plant Criteria
We have devised multiple criteria for the site selection of the Erzurum provincial wind power project by utilizing existing data and professional insights. This research employed the subsequent criteria:
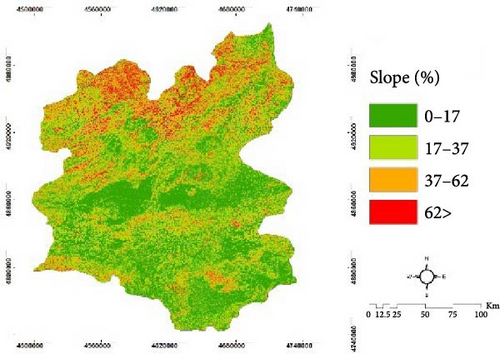
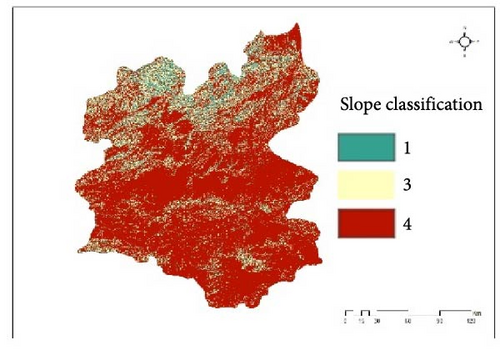
Slope: The gradient affects site selection and the development of wind farms. This criterion is important due to issues of financing, transportation, and building. The upper limit is 10%. Areas with a gradient over 30% receive 0 points. The highest score of 5 from the lowest 6% of regions aligns with the site where the slope value meets the specified condition.
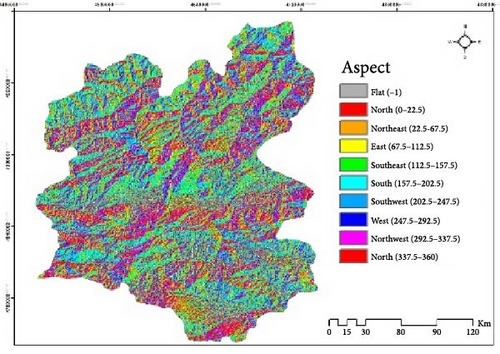
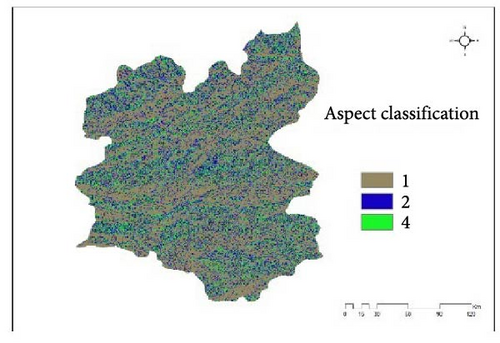
Aspect: Aspect refers to the portion of a mountain that is oriented toward the Sun or the direction in which mountains in a specific region receive solar radiation. Table 2 presents ranges and assessments for aspect values.
| Criteria | Suitability levels and scores | ||||
|---|---|---|---|---|---|
| Highly suitable | Suitable | Moderately suitable | Less suitable | Not suitable | |
| 5 | 4 | 3 | 2 | 1 | |
| Wind speed (m/s) | >6 | 5–6 | 4–5 | 3–4 | <3 |
| Elevation (m) | <500 | 500–1000 | 1000–1500 | 1500–2000 | >2000 |
| Slope (degree) | 0–6 | 6–9 | 9–12 | 12–15 | >15 |
| Aspect | E, SE, flat | NE | NS | NW, SW | W |
| Land use | Natural and seminatural areas | — | Agriculture | Forest | Settlement, artificial zones, water bodies |
| Distance to road (km) | <10 | 10–20 | 20–30 | 30–40 | >40 |
| Distance to settlement (km) | >40 | 30–40 | 20–30 | 10–20 | <10 |
| Distance to surface water (km) | >6 | 4–6 | 2–4 | 0.5–2 | <0.5 |
| Land cover type (km2) | Artificial surfaces, Wetlands, water bodies | Grassland | Pasture area | Nonagricultural artificial green areas | Mine and construction areas, fields suitable for agriculture, continuous products, heterogeneous agricultural areas, forests, interior wet areas |
| Natural meadows | Areas without vegetation | Shrubbery areas | Wet areas near the shore, inland waters, water surfaces, farmland, infrastructure of cities | ||
| Distance from electricity grid (m) | 2000 m > | 1500–2000 m | 1000–1500 m | 500–1000 m | 0–500 m |
| Distance from substations (m) | 250–5000 | 5000–10,000 | 10,000–15,000 | 15,000–20,000 | >20,000 |
| Distance from fault lines (m) | >30 | 20–30 | 10–20 | 5–10 | 500–5 |
| Solar irradiation (W/m2) | >42,000,000 W/m2 | 42,000,000–3,000,000 W/m2 | 3,000,000–1000 W/m2 | 1000–100 W/m2 | <100,000 W/m2 |
| Air temperature (°C) | >15.1°C | 15.1–12.1°C | 12.1–10.1°C | 10–6.1°C | 6–4.9°C |
| Air humidity (%) | Very high | High | Normal | Low | Very low |
| Air pressure (Mb) | Very high | High | Normal | Low | Very low |
| Land surface temperature (°C) | Very hot | Hot | Normal | Cool | Very cool |
| Erasion (sensitivity only) | Severe | Moderately severe | Mild severe | Erosion | No erosion |
| Land use capacity (no unit) | Grade 1 | Grade 2 | Grade 3 | Grade 4 | Grade 5 |
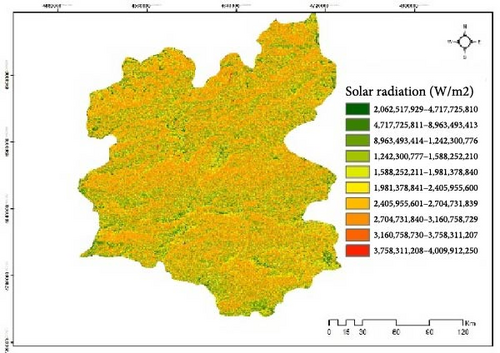
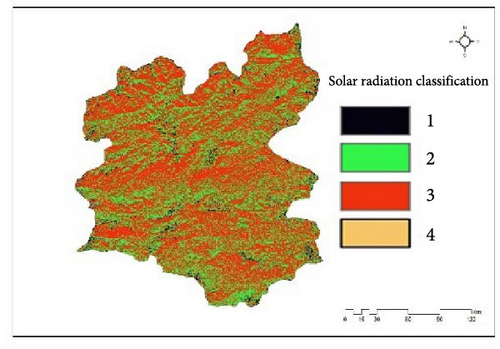
Solar radiation: Solar radiation or solar irradiation refers to the power density per unit area emitted by the Sun across the wavelength spectrum of the measuring device. Table 2 presents scores and value ranges for solar radiation.
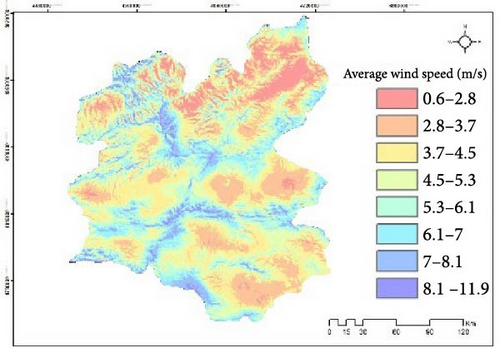
Wind speed: Wind velocity is the primary factor in assessing the production capacity of a wind turbine. Wind velocity is directly proportional to the cube of wind speed that precisely quantifies energy production. Given that wind speed is influenced by various factors, including the potential energy output from the wind, it is essential to assess these elements while determining the ideal location. Wind velocity has been a crucial factor in the site selection for wind farms in various previous studies. In most studies, initial wind speed estimations for scoring generally ranged from 3 to 6 m/s. In all these experiments, 5 m/s was predominantly utilized as the initial value. Consequently, our research is based on this principle. The minimum wind speed required for scoring is set at 5 m/s; winds below this threshold are considered inadequate and receive a score of 0. Table 2 presents the scores and value ranges for wind velocity.
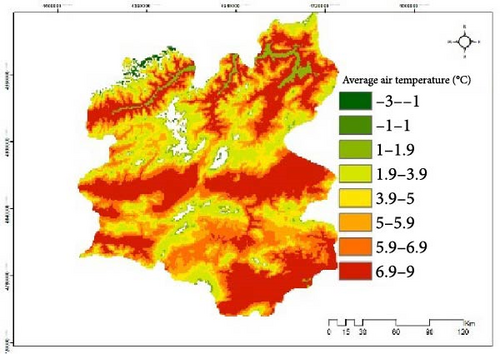
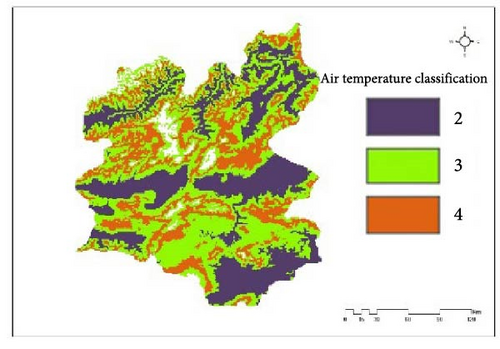
Air temperature: The oscillations of gas molecules generating thermal energy influence air temperature. The evolution of humidity, precipitation, pressure, wind, and other attributes is ascribed to it, rendering it the primary element of the climate. Table 2 presents scores and value ranges for air temperature.
Land use: It is the way in which persons utilize the world, influenced by the interaction between the natural environment and humanity. In other words, it is the area that emerges from the economic activities necessary for sustaining life in regions afforded to persons by natural conditions. These areas arise in connection with economic activity, illustrating the spatial distribution of regions linked to raw materials, industry, and the service sector within land use. Table 2 delineates the scores and value ranges for land utilization.
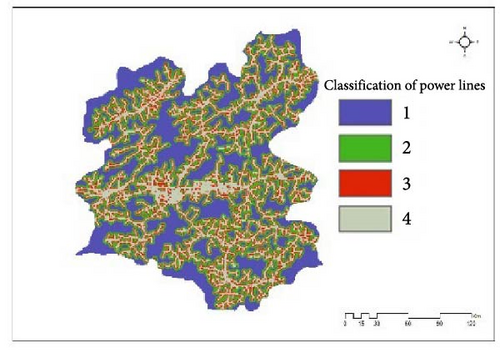
Transmission line: Electricity transmission lines enable the systematic and controlled transfer of electrical energy generated at power plants to distribution lines. The system facilitates the transmission of electrical energy between power production facilities and transformer stations located near consuming areas. The installation of electrical lines involves considerations such as cost, transmission line routing, geographical conditions, terrain, operational feasibility, voltage drop calculations, capacity, and load-bearing capacity. It is imperative to construct the power line with integrity and to convey electricity with minimal losses.
Distance to road: The closeness to roadways significantly influences the maintenance and repair costs of the power plant. The plant’s proximity to highways during initial installation reduces infrastructure expenses and lessens potential harm to surrounding lands during the construction of new transport routes. The literature recognizes that SPPs must maintain a minimum distance of 100 m from highways since debris from automobile traffic may negatively affect the solar panels and pose significant security risks.
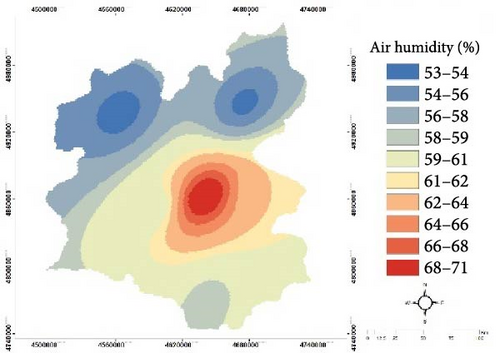
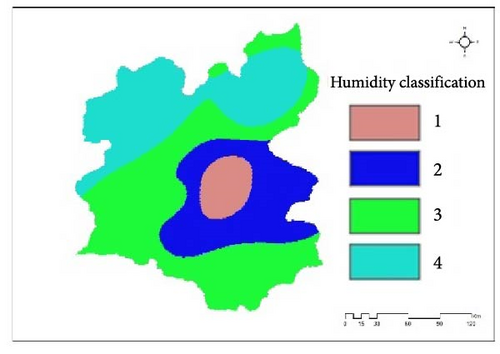
Air pressure: Moisture refers to the water vapor present in the atmosphere. Temperature and pressure influence the capacity of air to retain moisture or water vapor. The capacity to hold moisture increases with temperature. The Arc-GIS 10.8 software was utilized to digitize point data gathered from stations at 12 different sites, and the “Kriging” method in Geostatistical Analyst was used to generate humidity maps of the study area. Table 2 presents scores together with their corresponding value ranges.
Distance from fault lines: Regions with less seismic risk should be selected for SPP installation. A vertical thrust fault-oriented NE–SW is present at Erzurum, characterized by an elevated northern block and a depressed southern block resulting from NW–SE compression in the region. The fault line data was obtained by digitizing the fault map from the General Directorate of Mineral Research and Exploration (MTA, 2020) website, and five separate buffer zones were created at 1000 m intervals for analysis.
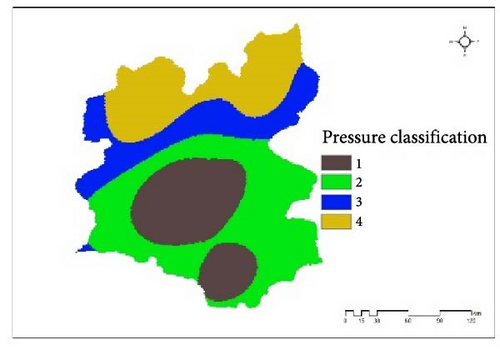
Air humidity: The gasses enveloping the Earth possess mass. Air pressure is the force exerted by atmospheric gases on the Earth due to gravitational influence. The “Kriging” method inside the Geostatistical Analyst module was employed to digitize the air pressure map utilizing ArcGIS 10.8 software. Table 2 presents scores together with their corresponding value ranges.
Land utilization capacity: An additional consideration is the assessment of a site’s suitability for the installation of wind turbines. Various land cover types, including woodlands, steppes, forests, grasslands, shrublands, agricultural land, and wastelands, have been utilized as criteria for evaluation, exclusion, or both in site selection studies within the literature. A study of current data reveals that different land cover categories exhibit differing degrees of relevance. The parameters of land use capacity include residential areas, tourist attractions, airports, zones for natural character preservation, military zones, mining zones, organized industrial zones, logistics centers, small industrial zones, organized agricultural and livestock zones, industrial and storage facilities, and aquatic surfaces such as lakes, rivers, and streams. This study used land cover type as an evaluation criterion by employing the Corine land cover map. Table 1 presents scores together with their corresponding value ranges.
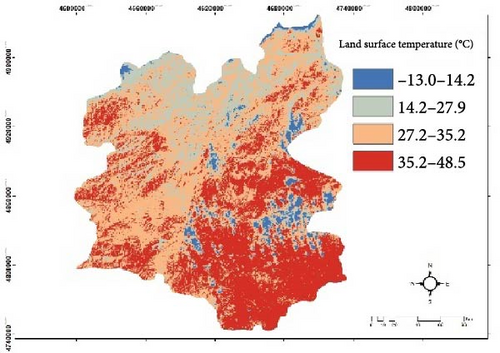
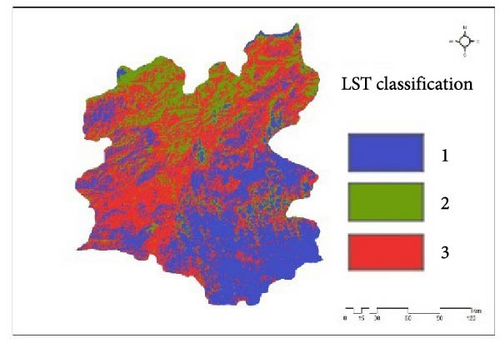
Land surface temperature: The spatial resolution of 100 m for band 10 was improved to 30 m by amalgamating raster data from bands 4, 5, and thermal band 10 of the Landsat 8 satellite. Land surface temperature evaluations were conducted utilizing Arc-GIS 10.8 and spatially delineated bands. Band 10 was employed to analyze normalized vegetation index maps to reduce the margin of error in land surface temperature observations. Surface temperatures in the research region ranged from −13 °C to 48.5 °C. In the Arc-GIS 10.8 software package, the Reclassify function inside the Spatial Analyst Tools module assigned land surface temperatures a score from 1 to 4, according to their relative weight degrees.
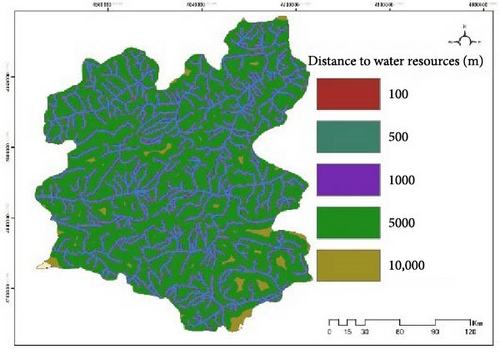
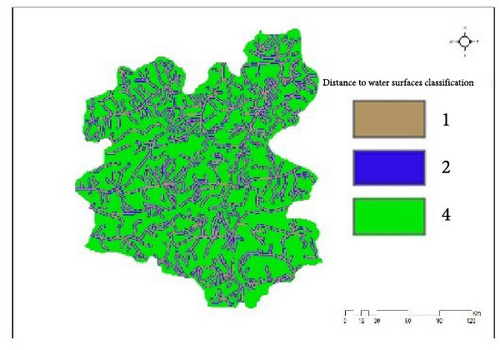
Distance to water resources: DEM data with a spatial resolution of 12.5 m were obtained from the Alospolsar satellite to generate distance maps to water sources. The hydrology function of the Spatial Analyst Tools module in ArcGIS 10.8 was utilized to evaluate DEM data. The hydrological map generated from the research underwent multibuffer analysis, resulting in layer maps that depict the proximity to water sources. The maps were classified from 1 to 4 in the Reclassify section of the Spatial Analyst Tools module of ArcGIS 10.8 based on their weight and significance. The weight degrees were allocated according to proximity to the water rocks; spots further away received four points, whereas those nearer received fewer points.
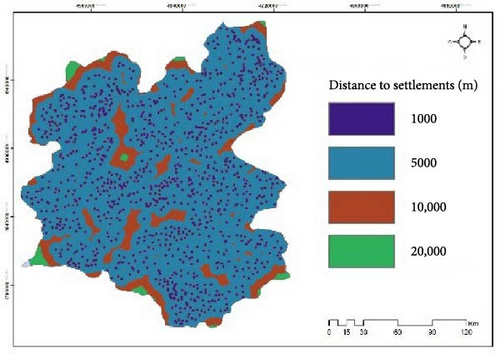
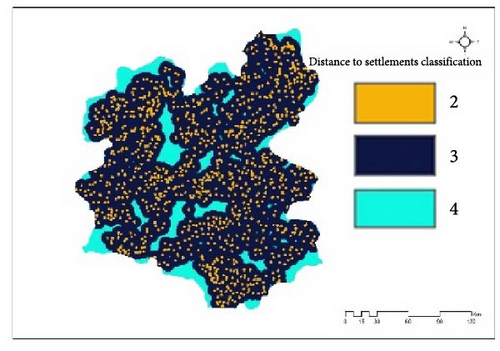
Distance from settlement areas: Wind farm locations can also be evaluated from a sociological standpoint. The proximity of these wind farms to populated areas is alarming. It offers both advantages and disadvantages for noise and visual effects; however, it significantly boosts employment and tourism efforts. A buffer zone of 500 m from communities was employed in the majority of studies documented in the literature. Regions within this study situated 0–500 m apart are assigned a score of 0 according to these valuation techniques [88]. Determine suitable sites for the development of wind farms: closeness to communities with high energy use provides numerous benefits. This pertains to the distribution and transmission of energy. Consequently, the scores diminish with greater distance. A score of five signifies a distance range of 500–2500 m. Table 2 specifies the distance ranges along with their corresponding ratings.
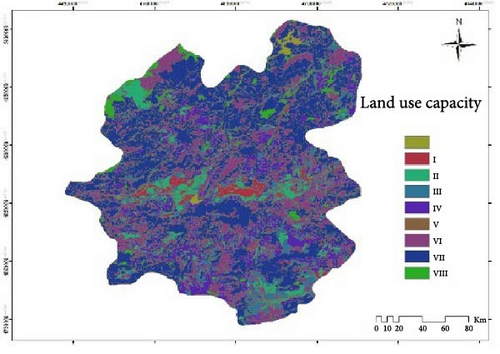
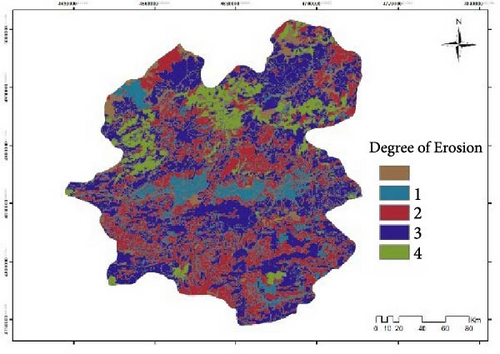
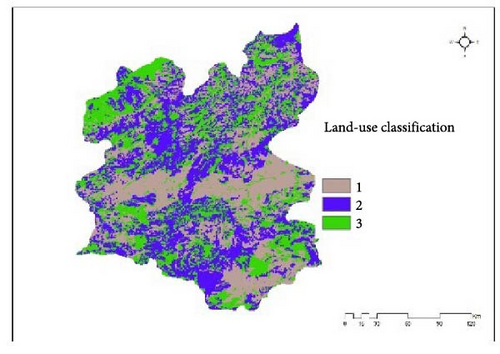
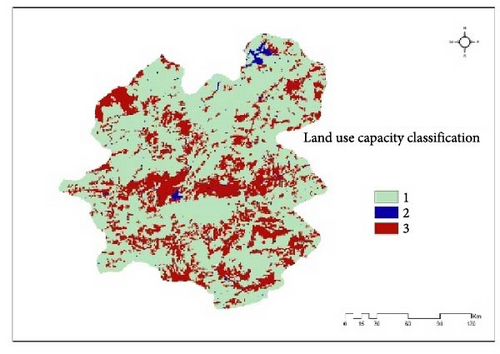
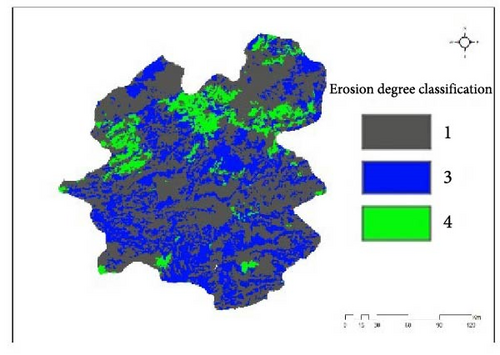
Erasion and land use capacity: The General Directorate of Rural Services of Turkey digitized 1:25,000 scale maps using Arc-GIS 10.8 and corrected them to the WGS-84 projection to produce land use capacity and erosion maps. The digitized maps were utilized to produce maps depicting erosion risk and land use classifications. The maps were rerasterized and assigned a score from 1 to 4 according to their weight degrees in the Reclassify portion of the Spatial Analyst Tools module in ArcGIS 10.8. Erosion presents a considerable threat to infrastructure, especially at stations. Locations designated as low danger and nonrisk were assigned 2, 3, and 4 points, but those with substantial reservoir concentrations were awarded 1 point. The ability to utilize land is a vital element in agriculture. The areas designated with land use capacity of 1 and 2 exhibit significant agricultural productivity. Locations with a land use capacity of 1 were awarded one point, those with a capacity of 2 earned two points, locations with a capacity of 3 obtained three points, and those categorized in the 4–6 range, where agricultural activities are unfeasible, were assigned four points.
3.2. Creating Criteria Maps
Following the establishment of the criteria, GIS was employed to generate maps based on data collected from various organizations. These maps were designed for clarity, ensuring they aligned with the objectives of the study. Adhering to well-established cartographic standards was essential for effective map production. According to Schoppmeyer [125], the design and presentation of thematic maps should not exceed seven colors. During the criteria selection process, it was determined that six classes would be ideal in accordance with this recommendation.

| 1 | 2 | 3 | 4 | 5 | 6 | 7 | 8 | 9 | 10 | 11 | 12 | 13 | 14 | 15 | 16 | |
|---|---|---|---|---|---|---|---|---|---|---|---|---|---|---|---|---|
| Yükseklik | Pazaryolu | Tortum | İspir | Uzundere | Oltu | Horasan | Şenkaya | Narman | Köprüköy | Karayazı | Karaçoban | Hınıs | Tekmar | Ilıca | Aşkale | Pasinler |
| 10 m | 8.3 | 7.5 | 9.65 | 9.88 | 7 | 7.05 | 7.67 | 6.5 | 6.04 | 8.47 | 7.26 | 8.46 | 5.64 | 8.32 | 6.85 | 7.86 |
| 50 m | 8.58 | 8.47 | 9.8 | 9.67 | 7.11 | 7.8 | 7.95 | 7.23 | 7.03 | 9.21 | 7.32 | 9.46 | 7.11 | 8.62 | 7.62 | 8.76 |
| 100 m | 8.84 | 9.09 | 10.09 | 9.72 | 7.35 | 8.49 | 8.22 | 7.81 | 7.69 | 9.82 | 8.1 | 10.17 | 8.01 | 9.02 | 8.31 | 9.35 |
| 150 m | 9.28 | 9.57 | 10.3 | 9.45 | 7.59 | 9.16 | 8.65 | 8.26 | 8.15 | 10.3 | 8.66 | 10.79 | 8.76 | 9.31 | 8.95 | 9.83 |
| 200 m | 9.6 | 9.87 | 10.49 | 8.92 | 7.78 | 9.54 | 8.95 | 8.52 | 8.5 | 10.53 | 8.99 | 11.26 | 9.31 | 9.57 | 9.39 | 10.22 |
To create the wind speed map for Erzurum province, the Inverse Distance Weighted interpolation method was employed, resulting in grid cells measuring 200 m × 200 m. The recorded wind speeds ranged from 2.52 to 10.91 m/s. Table 4 provides a detailed summary of the cell count, total area, and the percentage of cells corresponding to each wind speed range. The reclassification technique was applied to adjust the values in the raster, assigning them to new output categories. GIS tools’ reclassification functionality was used to classify the wind speed map, following the six defined categories. Figure 4 presents the unclassified wind speed map, while Figure 5 shows the classified wind speed map of the study area. GIS capabilities for reclassification were employed in all stages of the process.


| Wind speed (m/sn) | Elevation (m) | Slope (degree) | Aspect | Land use | Distance to road (km) | Distance to settlement (km) | Distance to surface water (km) | Land cover type | Distance from electricity grid | Distance from substations | Distance from fault lines | Solar irradiation | Air temperature | Air humidity | Air pressure | Land surface temperature | Erasion | Land use capacity | |
|---|---|---|---|---|---|---|---|---|---|---|---|---|---|---|---|---|---|---|---|
| Wind speed | 1.00 | 3.30 | 5.92 | 4.50 | 3.30 | 3.00 | 6.00 | 7.00 | 6.00 | 3.00 | 6.33 | 7.60 | 5.70 | 5.70 | 5.78 | 3.00 | 3.00 | 6.70 | 7.60 |
| Elevation | 0.28 | 1.00 | 2.62 | 2.62 | 1.00 | 1.00 | 6.00 | 5.00 | 0.33 | 0.5 | 1.50 | 0.33 | 3.00 | 3.00 | 3.00 | 3.00 | 3.00 | 1.00 | 0.33 |
| Slope | 0.17 | 0.39 | 1.00 | 1.51 | 0.39 | 5.00 | 1.00 | 5.00 | 1.00 | 1.00 | 0.63 | 0.20 | 0.20 | 0.20 | 0.20 | 0.20 | 0.20 | 9.00 | 0.20 |
| Aspect | 0.16 | 0.66 | 1.58 | 1.00 | 0.66 | 1.00 | 5.00 | 5.00 | 1.00 | 1.00 | 0.20 | 0.20 | 0.20 | 0.20 | 0.20 | 0.20 | 0.20 | 5.00 | 0.20 |
| Land use | 0.15 | 0.50 | 1.23 | 0.46 | 1.00 | 5.00 | 1.00 | 5.00 | 0.20 | 1.00 | 0.63 | 0.20 | 1.00 | 1.00 | 0.20 | 1.00 | 1.00 | 1.00 | 0.20 |
| Distance to road | 0.14 | 0.25 | 0.55 | 1.35 | 0.25 | 1.00 | 1.00 | 1.00 | 0.20 | 1.00 | 0.33 | 0.20 | 1.00 | 1.00 | 0.20 | 0.20 | 0.20 | 1.00 | 0.20 |
| Distance to settlement | 0.18 | 0.42 | 1.26 | 2.62 | 0.42 | 1.00 | 1.00 | 5.00 | 5.00 | 1.00 | 0.71 | 0.33 | 3.00 | 1.00 | 0.33 | 3.00 | 3.00 | 5.00 | 0.33 |
| Distance to surface water | 0.15 | 0.55 | 1.35 | 1.00 | 0.55 | 1.00 | 1.00 | 1.00 | 0.20 | 1.00 | 0.20 | 0.20 | 3.00 | 1.00 | 0.33 | 3.00 | 3.00 | 1.00 | 0.20 |
| Land cover type | 0.13 | 0.25 | 0.46 | 1.58 | 0.25 | 1.00 | 0.20 | 0.20 | 1.00 | 0.20 | 0.20 | 0.20 | 3.00 | 1.00 | 3.00 | 3.00 | 3.00 | 1.00 | 0.20 |
| Distance from electricity grid | 0.33 | 0.42 | 5.92 | 1.23 | 0.42 | 1.00 | 5.00 | 0.20 | 1.00 | 1.00 | 0.20 | 1.00 | 3.00 | 1.00 | 3.00 | 3.00 | 3.00 | 0.20 | 1.00 |
| Distance from substations | 0.11 | 0.55 | 2.62 | 0.55 | 0.55 | 1.00 | 1.00 | 0.20 | 0.20 | 1.00 | 1.00 | 0.20 | 3.00 | 1.00 | 3.00 | 3.00 | 3.00 | 0.20 | 0.20 |
| Distance from fault lines | 0.20 | 0.27 | 1.00 | 1.26 | 0.27 | 1.00 | 1.00 | 0.33 | 3.00 | 1.00 | 0.33 | 1.00 | 0.33 | 1.00 | 5.00 | 0.33 | 0.33 | 5.00 | 3.00 |
| Solar irradiation | 0.20 | 0.42 | 1.58 | 5.00 | 0.42 | 1.00 | 1.00 | 0.33 | 3.00 | 1.00 | 0.24 | 3.00 | 1.00 | 1.00 | 5.00 | 0.33 | 0.33 | 3.00 | 3.00 |
| Air temperature | 0.33 | 0.55 | 1.23 | 1.00 | 0.55 | 1.00 | 1.00 | 3.00 | 3.00 | 1.00 | 3.00 | 3.00 | 1.00 | 1.00 | 1.00 | 3.00 | 3.00 | 0.20 | 3.00 |
| Air humidity | 0.33 | 0.25 | 0.55 | 1.00 | 0.25 | 1.00 | 1.00 | 3.00 | 3.00 | 1.00 | 3.00 | 3.00 | 1.00 | 1.00 | 1.00 | 3.00 | 3.00 | 5.00 | 3.00 |
| Air humidity | 0.33 | 0.42 | 1.26 | 0.33 | 0.42 | 1.00 | 1.00 | 3.00 | 3.00 | 1.00 | 3.00 | 3.00 | 1.00 | 1.00 | 1.00 | 1.00 | 3.00 | 0.20 | 3.00 |
| Land surface temperature | 0.20 | 0.55 | 1.35 | 0.25 | 0.11 | 3.00 | 1.00 | 5.00 | 0.33 | 1.00 | 5.00 | 0.33 | 1.00 | 1.00 | 0.33 | 5.00 | 1.00 | 0.11 | 0.33 |
| Erasion | 0.20 | 0.27 | 0.46 | 0.42 | 0.20 | 3.00 | 1.00 | 3.00 | 3.00 | 1.00 | 0.33 | 3.00 | 1.00 | 1.00 | 0.20 | 3.00 | 3.00 | 1.00 | 3.00 |
| Land use capacity | 0.11 | 0.33 | 1.26 | 0.55 | 0.20 | 3.00 | 1.00 | 3.00 | 3.00 | 1.00 | 3.00 | 3.00 | 3.00 | 3.00 | 0.11 | 5.00 | 3.00 | 0.20 | 0.33 |
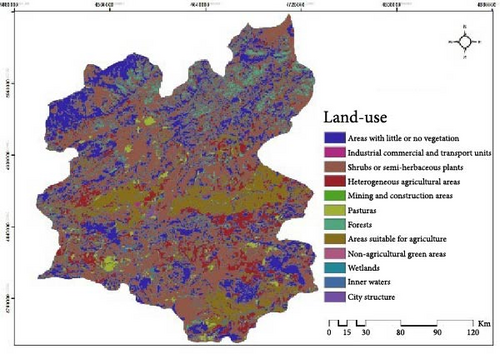
The land cover map for the study area was obtained in vector format (shapefile) from the Copernicus Services inventory [126, 127]. The area calculation function in GIS was used to determine the score values for each polygon based on the designated classes outlined in Table 2, following the addition of area data to the attribute table. Figures 4b and 5b show the unclassified and categorized land cover maps for the research area, respectively. The unclassified land cover map was generated using Corine land cover classes at a 200-m spatial resolution, employing the polygon-to-raster function in GIS software.
The DEM in raster format (ASTGTM v003) was sourced from the USGS Earth Explorer website [128]. This DEM dataset includes terrestrial surface data from 83°N to 83°S latitude, organized into 1° × 1° tiles with a spatial resolution of 30 m [129]. A percentage slope map was created using the GIS tools’ slope function, derived from this DEM (Figure 4). The slope map was then reclassified into percentage categories (Figure 5).
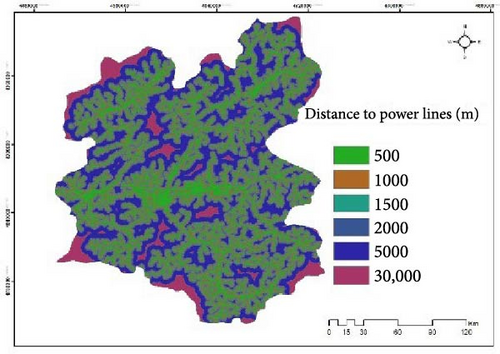
Proximity maps were generated using the Near function, point-to-polygon analysis, and classification features in GIS. A point-based shapefile was created from raster data with a 200-m spatial resolution. Using the point-to-raster tool in GIS, unclassified maps were generated to show proximity to various criteria based on specified distances. These proximity maps were reclassified according to defined class intervals. Figure 4 displays the unclassified proximity maps for various features, including substations, road networks, settlements, fault lines, power grids, and erosion zones, while the categorized proximity maps are presented in Figure 4.
3.2.1. Criteria Weighting and Wind Farm Suitability Map Creation
The creation of the wind farm suitability map requires assigning weights to the criteria after the criteria maps are developed and evaluated based on the defined class intervals. The weighting method chosen for evaluating the relative importance of each criterion is the AHP, a technique introduced by Saaty [130–134] and now widely used in multicriteria decision analysis (MCDA) and decision-making research [131–137]. Selecting a site for a wind farm involves assessing multiple criteria that require spatial evaluation to meet the defined objective. MCDM is a highly effective approach for analyzing and addressing such challenges [137–142].
The criteria weights applied in this study are determined through the MCDM framework, taking into account the preferences of all decision-makers involved. Spatial MCDA (SMCDA) is a specialized form of MCDM that focuses on spatial factors, integrating geographic data into the decision-making process. Unlike traditional MCDM, which involves evaluating a fixed set of criteria, SMCDA requires criterion values that depend on the locations of alternatives. Both GIS and MCDA elements are central to SMCDA, where MCDA combines the preferences of decision-makers to assess criteria significance using geographic data, while GIS is employed for data collection, analysis, and visualization [143–148].
Jankowski [136] first applied CRM approaches to regional issues, and more recent studies have also utilized this approach. Detailed information on the execution of CRM techniques can be found in the work of [84, 149–154]. In this study, the AHP MCDM approach is combined with GIS to create a compliance map. The decision problem is broken down into a structured hierarchy of subcases, each of which can be independently evaluated using the AHP method. This decomposition allows decision-makers to assess various aspects of the problem by making pairwise comparisons between elements.
The pairwise comparison process in AHP is divided into three main steps. The first step is constructing a comparison matrix for each level in the decision problem’s hierarchy. The second step is evaluating the relative importance of each element. The final step involves calculating the consistency ratio to ensure that the judgments are logically coherent [155, 156]. Figure 6 illustrates the hierarchy of decision problems in the study.
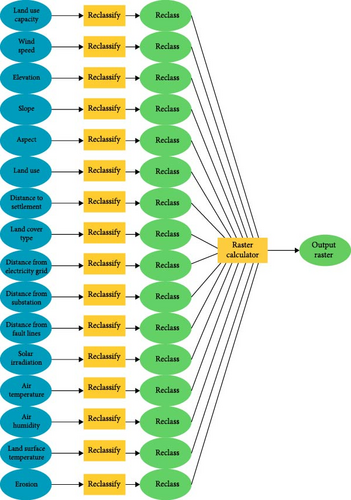
Table 5 shows the pairwise comparison scale, which involves assessing the dominance of one parameter over another. The priorities of the parameters are determined by synthesizing the pairwise comparison results [140]. To determine the importance of each criterion, domain experts were consulted. The rating matrix in Table 4 reflects the data collected from these experts. Table 6 presents the weights and relative significance of the criteria considered in this analysis. Additionally, Table 7 outlines the methods used to select the optimal wind farm site based on the districts within Erzurum province. The wind farm suitability map was created by applying the criteria maps and the weights obtained from the AHP evaluation. This process was carried out using the weighted sum function available in GIS tools.
| Intensity of importance | Definition |
|---|---|
| 1 | Equal importance |
| 2 | Slight importance |
| 3 | Moderate importance |
| 4 | Moderate plus importance |
| 5 | Strong importance |
| 6 | Strong plus importance |
| 7 | Very strong or demonstrated importance |
| 8 | Very, very strong importance |
| 9 | Extreme importance |
| Critereion | Weights | Reletive importance (%) |
|---|---|---|
| Wind speed | 0.40993 | 40.993 |
| Elevation | 0.07908 | 7.908 |
| Slope | 0.09573 | 9.573 |
| Aspect | 0.00229 | 0.229 |
| Land use | 0.00548 | 0.548 |
| Distance to road | 0.00464 | 0.464 |
| Distance to settlement | 0.01551 | 1.551 |
| Distance to surface water | 0.00603 | 0.603 |
| Land cover type | 0.00405 | 0.405 |
| Distance from electricity grid | 0.07211 | 7.211 |
| Distance from substations | 0.07711 | 7.711 |
| Distance from fault lines | 0.0612 | 6.12 |
| Solar irradiation | 0.00208 | 0.208 |
| Air temperature | 0.00198 | 0.198 |
| Land use capacity | 0.08273 | 8.273 |
| Air humidity | 0.00129 | 0.149 |
| Air pressure | 0.01622 | 1.622 |
| Land surface temperature | 0.01123 | 1.123 |
| Erasion | 0.05111 | 5.111 |
| Locations | Score | Rank |
|---|---|---|
| İspir | 0.0836 | 1 |
| Aziziye | 0.0542 | 2 |
| Narman | 0.0482 | 3 |
| Oltu | 0.0441 | 4 |
| Tekman | 0.0438 | 5 |
| Pasinler | 0.0436 | 6 |
| Şenkaya | 0.0411 | 7 |
| Hınıs | 0.0397 | 8 |
| Tortum | 0.0341 | 9 |
| Yakutiye | 0.0333 | 10 |
| Aşkale | 0.0327 | 11 |
| Karayazı | 0.0319 | 12 |
| Pazaryolu | 0.0318 | 13 |
| Olur | 0.0282 | 14 |
| Çat | 0.0277 | 15 |
| Karaçoban | 0.0256 | 16 |
| Köprüköy | 0.0252 | 17 |
| Horasan | 0.0250 | 18 |
| Palandöken | 0.0246 | 19 |
| Uzundere | 0.0227 | 20 |
4. Result
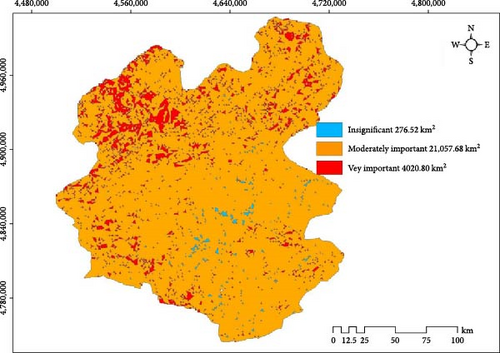
The criteria and exclusion parameters were defined by evaluating the technical, economic, social, and environmental aspects associated with wind farm development to pinpoint the optimal locations for wind energy generation. A thorough literature review was conducted, and the class interval values for the selected criteria were determined based on previous research findings and expert input. The exclusion zone, covering 1.09% of the total study area, includes 276.52 km2 of land identified as unsuitable for wind farm development. A scoring range of 0–5 was adopted to enhance the clarity and readability of the maps for cartographic communication purposes. Table 2 outlines the criteria, classification ranges, and evaluation methods used in the study.
Initially, unclassified maps related to the relevant criteria were produced. Once the class intervals and corresponding scores were established, these maps were classified, resulting in the creation of scored criteria maps (Figure 3). The wind farm suitability ratings were then derived by applying the weighted sum function of GIS tools, using the classified criteria maps and the criteria weights calculated through the AHP method. Figure 7 presents the wind farm suitability map for Erzurum province, revealing that 15.858% (4020.80 km2) of the assessed area is classified as highly suitable, while 83.052% (121,057.68 km2) is deemed suitable for wind farm development.
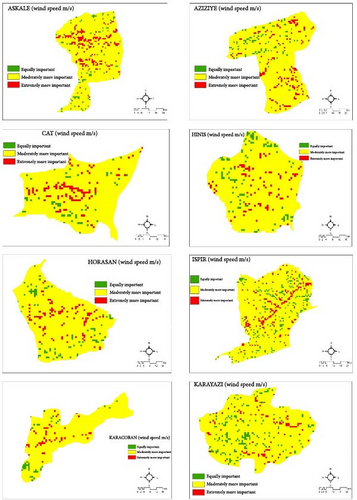
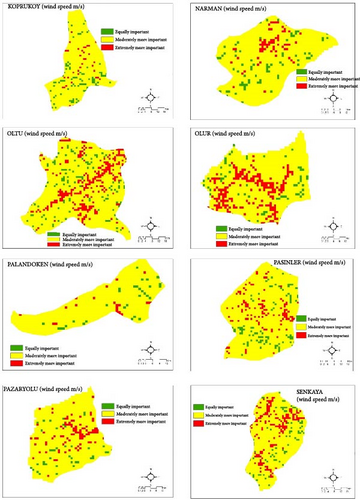
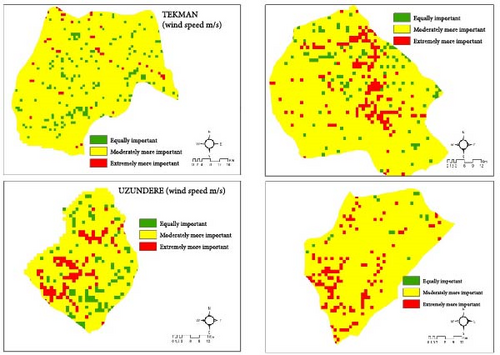
District-level suitability maps were also developed to assess the wind farm potential across different districts within Erzurum province, as shown in Figure 8. The Ispir district emerges as one of the most favorable regions for wind energy generation based on the district suitability maps. Following this, other districts including Aziziye, Narman, Oltu, Tekman, Pasinler, Şenkaya, Hınıs, Tortum, Aşkale, Yakutiye, Karayazı, Pazaryolu, Olur, Çat, Karaçoban, Köprüköy, Horasan, Palandöken, and Uzundere were also identified. Tables 3 and 8 provide a breakdown of the total areas corresponding to the most and second most suitable sites across the various districts.
| Number | Districts of Erzurum province | Wind energy suitable areas of Erzurum province districts (Ha) | Wind energy produced (MW) |
|---|---|---|---|
| 1 | İspir | 10,858.5 | 1,085,850 |
| 2 | Aziziye | 5410.1 | 541,010 |
| 3 | Narman | 5371.6 | 537,160 |
| 4 | Oltu | 4784.2 | 478,420 |
| 5 | Tekman | 4783.8 | 478,380 |
| 6 | Pasinler | 4233.5 | 423,350 |
| 7 | Şenkaya | 4200 | 420,000 |
| 8 | Hınıs | 3873 | 387,300 |
| 9 | Tortum | 3638.9 | 363,890 |
| 10 | Aşkale | 3358 | 335,800 |
| 11 | Yakutiye | 3383.9 | 338,390 |
| 12 | Karayazı | 3309.9 | 330,990 |
| 13 | Pazaryolu | 3263.7 | 326,370 |
| 14 | Olur | 2889.5 | 288,950 |
| 15 | Çat | 2765.7 | 276,570 |
| 16 | Karaçoban | 2713.6 | 271,360 |
| 17 | Köprüköy | 2671.3 | 267,130 |
| 18 | Horasan | 2534.9 | 253,490 |
| 19 | Palandöken | 1669.4 | 166,940 |
| 20 | Uzundere | 1099.3 | 109,930 |
The wind speed map emerges as the most influential criterion when evaluating both the classification criteria maps and the suitability map individually. This can be attributed to the significant impact of wind speed compared to other criteria. As a result, areas with lower suitability ratings tend to align with lower wind speed scores. An analysis of the criterion maps reveals a relationship between wind speed, land cover type, and slope. In addition to wind speed, factors such as air temperature, air pressure, humidity, and solar radiation also contribute to wind generation. Wind speeds are generally lower in mountainous and forested regions compared to flat, uniform terrain. This pattern has been observed in previous research [48, 79, 84].
We can see the wind speeds at different heights in different districts of Erzurum Province required for the turbine tower modeled in Table 8 and Figure 3.
4.1. Sensitivity Analysis
Sensitivity analysis was performed to assess how the weights assigned by the experts influence the results. Various methods have been used in previous studies to conduct such analyses. In this research, a sensitivity analysis was carried out by applying equal weights to each criterion. Table 3 shows the differences between the results obtained using the AHP method and those derived from assigning uniform weights. Figure 7 presents the suitability map generated after performing the sensitivity analysis.
The experiment using uniform weights demonstrated that the model is highly sensitive to changes in the weights assigned to the criteria. The regions classified as suitability class 4 according to the AHP-based sensitivity analysis results are clearly highlighted. Despite significant percentage changes in the areas classified as most and least suitable, the overall area values remain relatively stable. Notably, suitability class 2 saw the most significant reduction in area, though this zone is considered to have improved in terms of suitability for wind farm development. The adjustment of criterion weights led to an increase in high-suitability areas while decreasing the low-suitability areas.
4.2. Experimental Results for Wind Power Plant Mapping
First, we developed a scoring matrix for each of the 20 districts in Erzurum, Turkey, and evaluated the locations based on the derived values. As a result, İspir emerged as the most suitable district for the establishment of a wind power plant among all 20 districts in Erzurum province.
The wind farm suitability area spans 21,334.2 km2 (Figure 8). In this region, 1 MW wind turbines were placed at 1-km intervals. Erzurum province’s current terrestrial wind energy potential is ~2,133,420 MWh. The map highlights areas in orange and red, with the red indicating the most optimal zones for wind energy. The wind energy map (Figure 8) provides a comprehensive tool for the detailed analysis and evaluation of each location.
Figure 8 illustrates a wind power density map showing the whereabouts of all wind turbines in the Erzurum districts. Regions exhibiting exceptionally high power density are located in Ispir, Aziziye, and Narman (Table 6 and Figure 8). Although these regions provide considerable wind energy potential, the rugged terrain renders the installation of a wind turbine virtually unfeasible.
5. Discussion
Figure 8 of our analysis reveals that the entire Erzurum province is suitable for the establishment of wind power plants. Based on our assessment of 18 environmental parameters, the İspir region has been identified as the most optimal location for wind energy development. Next, we will examine the climate of İspir, where the district center is situated at an elevation of 1450 m, with some settlements positioned at even higher altitudes. The district experiences a continental climate, with summer temperatures typically ranging from 20 to 30°C and winter temperatures fluctuating between 0 and −25°C. Meteorological conditions play a crucial role in determining the viability of wind energy.
While Erzurum province has conducted research into solar energy, no studies on wind energy have been previously undertaken. This study is unique in its focus and scope. In addition to the wind speed criterion, locations with higher suitability map scores also performed well across other parameters. This indicates that regions with higher suitability scores, among the 18 variables assessed in this study, have a competitive advantage for wind energy development.
This research is intended to serve as a preinvestment evaluation tool for wind energy investors and decision-makers. The study specifically examines 100-m-high wind turbines, although many manufacturers are now focusing on turbines of greater heights. It is important to consider both site selection and the specifications of the wind turbines used in this study before making investments in wind energy. Regional factors should be carefully assessed when selecting the most appropriate turbine type. Furthermore, enhanced wind speed forecasts could be integrated into this multicriteria geographic analysis, potentially yielding different results under high wind conditions.
Investors can benefit from using spatial MCDM techniques when selecting turbines. Future studies will build on the findings of this research, which aims to establish wind energy infrastructure and attract new investors to the Erzurum region.
6. Conclusion
MCDA was employed to determine the most suitable locations for wind farm development near Erzurum, Turkey. The study was conducted using ESRI’s ArcGIS software. In line with cartographic communication principles, various criteria maps were created and classified into six distinct categories. After data collection, these maps were classified and evaluated according to the predefined class intervals. AHP questionnaires were distributed to wind energy experts and researchers to assess the weights and priorities of the model’s criteria. Using the weighted sum function of GIS tools, a suitability map was developed based on the expert-recommended criterion weights. Each cell within the wind farm area was assigned a suitability score, with the resulting suitability map reflecting the predetermined criterion weights and scores as inputs. The suitability map consists of five categories, with scores ranging from 1 to 5. Areas considered most suitable received a score of 5, while those deemed least suitable were given a score of 1. The analysis reveals that the most suitable areas make up 15.858% of the total land area, amounting to 4020.80 km2. The second most suitable class covers 21,057.68 km2 or 83.052% of the total area. The least suitable class accounts for 1.09% of the area, or 276.52 km2. Importantly, the majority of the area (83.052%) is classified as acceptable for wind farm development, indicating that Erzurum is a promising location for wind energy investment. The districts with the highest potential for wind farm development, based on the optimal and suitable classifications, include İspir, Aziziye, Narman, Oltu, Tekman, Pasinler, Enkaya, Hınıs, Tortum, Yakutiye, Aşkale, Karayazı, Pazaryolu, and Olur. These districts stand out as having the most favorable conditions for wind energy development at the district level.
Ethics Statement
This article does not require ethical approval or permission to participate.
Disclosure
The authors performed this work themselves. There was no need for a release from elsewhere.
Conflicts of Interest
The authors declare no conflicts of interest.
Author Contributions
Gökhan Şahin: conceptualization, software, writing–review and editing, investigation of wind energy potential and optimal site selection for wind energy plants installations and AHP part. Ahmet Koç: conceptualization, software, writing–review and editing, investigation of GIS part. Sülem Şenyiğit Doğan: conceptualization, software, writing–review and editing, investigation of GIS part. Sabir Rustemli: conceptualization, software, writing–review and editing, investigation of wind energy potential and optimal site selection for wind energy plants installations. Wilfried G. J. H. M. van Sark: conceptualization, software, writing–review and editing, investigation of wind energy potential and optimal site selection for wind energy plants installations.
Funding
The work in this paper is performed without funding sources. Open access funding is provided by the Scientific and Technological Research Council of Türkiye (TÜBITAK).
Open Research
Data Availability Statement
The data are available upon request due to restrictions (privacy, legal, or ethical reasons).


