Identifying Suitable Sites for Wind Farm Development in the Coastal Areas: A Case of Northern Gulf of Oman, Iran
Abstract
Constructing wind power plants is a multidimensional activity, which determines land potential based on a series of effective criteria and indicators. Accordingly, in the present study, a list of location indicators for wind farms development in the north of Oman Gulf (Sistan and Baluchistan Province) was presented through theoretical literature review and expert viewpoints. Then, location indicators were screened using the Delphi method and weighting by the analytic hierarchy process (AHP) model. In this study, combining layers using the weight linear combination (WLC) method and, finally, identifying areas with spatial value for wind farm development and prioritization of these areas using numerical estimating method (technique for order preference by similarity to ideal solution [TOPSIS]) and artificial intelligence optimization (whale optimization algorithm [WOA]). According to the results of the Delphi method, 14 indicators have been identified, with selected indicators related to the role and necessity of application, including average wind speed, wind continuity, and wind power density as mandatory indicators of capability and distance from military operational areas and distance to historical monuments as mandatory restriction indicators. Based on the weighting results and the combination of indicators, the coastal area was divided into four categories: weak, medium, suitable, and very suitable. Among classes, suitable class covers about 36% of the studied area. As the results show, the cities of Dashtyari and Chabahar have the highest priority for wind farm development, followed by the cities of Zarabad and Konarak. Likewise, in this study, the WOA method achieved the best results, according to root mean square error (RMSE) and R2 outcomes. According to the results obtained, 75% of the identified areas are suitable and very suitable for wind farms development. Therefore, by prioritizing coastal cities, wind farms can be developed in this province.
1. Introduction
The fossil fuel crisis and the effort to use new and renewable energies in most countries of the world is a very important issue due to their policies and desire to protect the environment [1]. The increase in world population and technological advances in various fields have prompted governments to seek a solution to increase productivity by reducing costs and increasing effectiveness and efficiency to improve public welfare and energy security [2, 3].
Energy production by burning fossil fuels causes a large part of global warming. Studies demonstrate that human activities, especially the burning of fossil fuels (coal, oil, natural gas), lead to increased levels of CO2 and other greenhouse gases (GHGs) in the Earth’s atmosphere. This process enhances global warming and has a direct impact on climate change and global warming [4]. The increase in the concentration of GHGs and global warming has also disrupted the energy balance of the earth-atmosphere system and tends to warm the earth’s surface and cause climate change. After the Industrial Revolution, the development of energy consumption through fossil fuels increased, resulting in an exponential increase in GHGs. Electricity, heating, and transportation are responsible for 73% of GHG emissions, industrial processes 5%, agriculture, forestry and land use 18%, and waste 3%. The consequences of global warming are the increase in the surface temperature of the earth and oceans, which leads to an increase in the risk of extreme weather [5], as well as deforestation with significant negative effects [6]. Global warming caused by the development of human activities and fossil fuel burning is currently increasing at a rate of 0.2°C per decade. For this reason, the international community recognizes the need to keep the warming well below 2°C and continues efforts to limit it even to 1.5°C [7].
Natural energy sources such as wind energy, which is renewable and freely available can lead to sustainable energy use and also reduce the negative effects of fossil fuels. Thus, one of the best ways to supply the required energy in many advanced countries is wind energy, which is obtained through the construction of wind turbines [8]. It can reduce GHG emissions by producing green electricity. Wind power is a relatively mature and appropriate technology for new energy sources [9]. The successful operation of wind farms around the world shows that wind energy is a promising energy option to reduce the impact of environmental provisions [10]. Offshore wind farms without the need to occupy land and offshore wind energy resources are much better than it on the land. Offshore wind sources have high wind speed, stable wind direction, and long duration. Therefore, offshore wind energy has attracted worldwide attention.
On the other hand, offshore wind power plays a very important role in decarbonizing the world’s electricity supply [11, 12]. Installing wind power can not only reduce energy shortages but also contribute to environmental sustainability by reducing GHGs such as carbon dioxide, sulfur dioxide, or nitride [13].
The exploitation of wind potentials prevents environmental impacts [14–16], as well as benefits from significant economic consequences in the form of increases in production and employment. Therefore, to achieve such a goal, it is very important to determine the most suitable geographical locations before developing a wind farm [8], and selecting the most suitable locations with the desired and optimal energy source is a complex decision-making process [17, 18]. It is not enough to build a wind farm just because the resources are abundant. In fact, there are many factors that can directly affect output power, costs, and social and environmental influences [19]. The assignment of a suitable location is one of the most strategic decisions and an important and necessary process [20, 21].
Effective decision-making in selecting suitable locations necessitates reliance on intricate tools for decision support, especially those adept at handling uncertainty and imprecision [22, 23]. Given the multidimensional nature of the problem at hand, the multicriteria decision-making (MCDM) methods emerge as apt tools for informed decision-making. These methods incorporate a variety of mathematical models and tools within the ambit of MCDM [24]. To date, an extensive array of methods has been introduced. Some cater to determining criteria weight coefficients, while others focus on the discernment of the optimal choice amongst a myriad of possibilities [25].
Several types of MCDM methods have been developed or improved by different authors during the last decades. The main differences between these methods are related to the complexity level of algorithms, the weighting methods for criteria, the way of representing preferences evaluation criteria, uncertain data possibility, and finally, data aggregation type [26, 27]. In general, all MCDM methods have the advantage of considering decisions’ disproportionate and contradictory impacts [28].
To facilitate decision-making in spatial applications, several methods are available to aggregate the performance of decision-makers. The multitude of these methods makes it difficult to choose one method over another [29]. Two main types of methods are used: the outranking methods, which are based on numerical estimating method and artificial intelligence optimization. These methods can be adapted to this kind of application and can be integrated into GIS, which is an essential tool in spatial management and decision-making. This study aims to present a comparison between two MCDM methods, a technique for order preference by similarity to ideal solution (TOPSIS) and whale optimization algorithm (WOA), to select the most suitable sites for wind farm development.
Due to the importance of this issue and a better understanding of selecting the most suitable sites with the optimal energy source, the studies conducted in this field were reviewed. Rekik and El Alimi [8] studied the optimal selection of wind-solar sites using a GIS-analytic hierarchy process (AHP)-based approach. The results demonstrated that the wind’s most suitable locations are scattered from northwest to southwest, southeast, and partially to the north, where these designated locations are capable of generating an estimated annual energy of 40.896 and 781.83 TWh for wind and solar, respectively, to provide. Badi et al. [30] studied wind farm site selection using BWM-AHP-MARCOS methods in Libya. The result revealed that among five proposed locations in the state of Libya, safety and quality are the most important criteria, with a weight of 0.573, followed by social impression, with a weight of 0.203. Furthermore, the results obtained show the strength of the proposed model when changing expert viewpoints on the criteria to apply this methodology to other cities to continue the orientation towards sustainability. Zhang and Wang [13] assessed offshore wind power development and foundation technology for offshore wind turbines in China. Thousands of wind turbines with a cumulative installed capacity of more than 13 GW have been installed over the past decades. In addition, an offshore wind farm project is underway, aimed at characterizing the underlying technologies. Atiqah Bandira et al. [31] analyzed offshore wind–wave energy station locations by a dual-side spherical fuzzy approach in Vietnam. The results indicate that there is no significant difference in the area under the curve (AUC) values between the NASA POWER data map and the ground-measured data. Therefore, the stakeholders can benefit from the generated suitability map to target the locations that have the highest wind-wave energy production potential efficiently and sustainably.
As studies show, wind energy, obtained by building wind turbines, is one of the best renewable energy sources and substitutes for fossil fuels. The exploitable potential of wind energy in Iran is around 100 gigawatts, while in 2019, the capacity of installed power plants in the country was only 302.3 MW [32]. Considering the windy areas in this country and the establishment of large air currents on the way, the amount of wind energy generation is very small compared to other energy sources. The assessment of wind energy in the country has shown for the first time that the coastal area of Sistan and Baluchestan Province has a high potential for the construction of wind farms [33]. As energy consumption increases due to high population demand and industrial development, the location of wind farms helps to promote sustainable development in the area. On the other hand, creating balance and sustainability by incorporating renewable energy sources into energy production is expected to reduce the region’s dependence on nonrenewable sources.
Accordingly, the present study focuses on identifying suitable sites for wind farm development in the coastal area. According to various environmental criteria, it is possible to prioritize potential places with favorable capacity to create wind farms in the north coastal areas of Oman Gulf. Thus, a list of location indicators for wind farms development in Sistan and Baluchistan province was presented through theoretical literature review and expert viewpoints. This list includes 8 criteria, 24 subcriteria, and 32 indicators in 2 ecological dimensions (including 2 criteria and 6 subcriteria) and human (including 6 criteria and 18 subcriteria), as described in Table 1. The purposes of this study are to identify the most suitable sites for the development of wind farms in the coastal area of Oman Gulf, to identify the influential factors in the construction of wind farms in Sistan and Baluchestan Province, and finally to obtain a map of the capabilities and environmental limitations for wind farms development in this coastal Province.
| Dimensions | Criteria | Subcriteria | Indicator | References |
|---|---|---|---|---|
| Ecological | Climate | Wind | Average wind speed | [34–63] |
| Wind power density | ||||
| Air pressure | ||||
| Wind continuity | ||||
| Atmospheric hazards | ||||
| Air temperature | ||||
| Land | Seismicity | Distance from faults | ||
| Earthquake | Distance from earthquake-prone areas | |||
| Unevenness | Slope | |||
| Aspect | ||||
| Elevation | ||||
| Stone | Stone type | |||
| Natural land cover | Distance from water sources | |||
| Distance from vegetation | ||||
| Human | Land use and management areas | Land use | Distance from land use | |
| City and village | Distance from residential areas | |||
| Protected areas | Distance from protected areas | |||
| Historical monuments | Distance from historical monuments | |||
| Mines | Distance from mines | |||
| Security | Distance from military operation areas | |||
| Tourism | Distance from tourism centers | |||
| Development infrastructure | Access network | Distance from access network | ||
| Airport | Distance from airport | |||
| Power network | Distance from power network | |||
| Energy network | Distance from energy network | |||
| Communication network | Distance from communication network | |||
| Capital sources | Financial resources | Development costs | ||
| Human resources | Workforce | |||
| Managerial | Political | Political factor | ||
| Organizing | Impact on the economy | |||
| Health | Community health | Impact on health | ||
| Consequences | Social acceptance | Acceptance rate |
2. Materials and Methods
2.1. Study Area
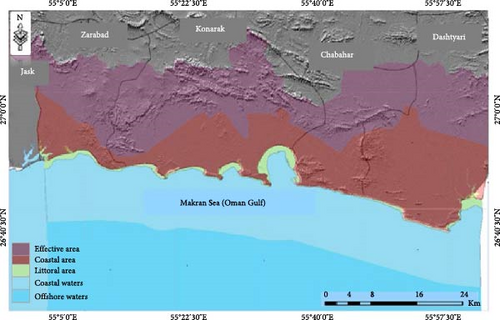
The studied area includes the coastal area of Sistan and Baluchestan Province with an area of 5377 km2. The length of this Province’s coastline in contact with the waters of the Oman Gulf is 404 km, which forms the contact surface of the four coastal cities of the Province, including Dashtyari, Chabahar, Konarak, and Zarabad, with open waters. The average width of the coastal area is 21.5 km, and its narrowest part at the western end of Konarak City is about 4 km and the widest part of the coastal area in Dashtyari City is about 49 km [64]. One of the most important climatic characteristics of the Province is the high average temperature and low fluctuations. Based on the annual average wind speed, the coastal areas of the Oman Gulf are one of the windiest areas in the country and the prevailing wind in Chabahar City is from the southeast, and the prevailing wind in Konarak City is from the southwest. Strong winds are one of the distinct features of the area, with a constant 120-windy days in summer. Hence, the studied area has a very high potential in terms of the development of wind farms and natural energies due to the weather conditions, as well as the longest coastline connected to the open seas and the Indian Ocean. In general, according to the Amberje classification, Chabahar City has a hot desert climate, and this Province is one of the semi-arid regions. Geographically, the Province is also comprised from two different land structures. In the North Dashte-Sistan, formed by Hirmand alluvium holds, the largest freshwater lake in the country is also situated in this area. The Southern part is mostly mountainous with a variety of climates due to the vicinity with Taftan Volcano and Oman Gulf. The southern coasts of Sistan and Baluchestan Province are located in the Balochi vegetation zone based on ecological subdivisions, and the Nobusandi basin covers the coastal areas of the Persian and the Oman Gulf in a belt shape, that the basin’s flora consists mainly of drought-tolerant and thermophilic plants. In the coastal area of Sistan and Baluchestan, there are some Protected areas with national and international titles; these areas are the habitats of sensitive plant and animal species under the protection of this Province, which include the Bahukalat Protected area, Pozm No-hunting area, and Important Bird Area. In addition, this area includes a part of the coast of Makran in the south of Sistan and Baluchestan and Oman Gulf. This coast has a special geographical location, and its ports have had a unique commercial position for a long time. Makran also has thousands of years of valuable history and civilization. Figure 1 displays the location of the studied area.
2.2. Methods
2.2.1. General Framework
In the present study, the MCDM method has been used to identify suitable and potential sites for wind farm development. According to Figure 2, the steps of this method include identifying location indicators, screening indicators using the Delphi method base on expert viewpoints, standardizing (fuzzy linear method) and weighting indicators by AHP model, preparing map, combining layers using the weight linear combination (WLC) method and finally, identifying areas with spatial value for wind farm development and prioritization these areas using the TOPSIS method. For this purpose, the data of 42 anemometer stations from 2000 to 2016 were collected and analyzed by the Organization of Renewable Energy and Energy Efficiency.
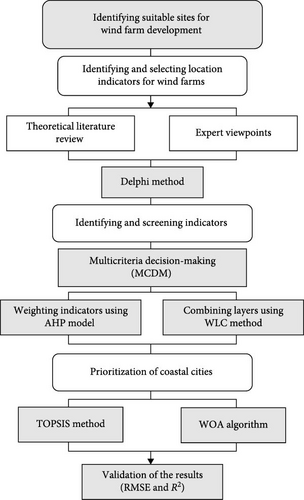
Since MCDM approaches have disadvantages in capturing the preferred difficulties; for example, excellent results on some standards can repay weak results on others. This means that specific options may rank low in some categories yet be excellent in others. Nevertheless, they may rank highly because of preference issues, resulting in superior solutions that are considered lower and possibly dismissed. Finally, the decision might collapse due to knowledge loss throughout the wind farm selection procedure and the use of insufficient data. This occurs primarily during the comparison phase while deciding the preferable strategy for each couple of replacements based on several factors. There is no relevant mechanism for discriminating between different levels of priority [65]. Accordingly, in this study, coastal cities were prioritized based on numerical estimating method (TOPSIS) and artificial intelligence optimization (WOA). Hence, in wind farms selection and identification, we developed WOA to address the difficulty with a complex nonlinear objective function. The WOA is a simple algorithm that uses a small number of parameters to control the search process. This algorithm is an efficient method that heuristically determines the desired functions of extreme points by imitating the behavior of humpback whales [66, 67]. The multiobjective WOA, in addition to the abovementioned merits, provides accurate convergence, accurate Pareto fronts, and an effective variety of solutions [68]. The main purpose of using this algorithm is to cluster criteria without labels so that we can achieve better results through simple solutions.
2.2.2. Delphi Method
2.2.2.1. Identifying and Screening of Location Indicators for Wind Farms
Criterion importance percentage =
Criterion importance degree =
where N = the number of respondents; Xi = initial weight (1, 3, 5, 7, 9); n = the number of people who rated each degree of importance (score).
2.2.3. AHP Process
The AHP model is a powerful and useful tool for managing multicriteria elements involved in decision-making behavior [79]. AHP is one of the most comprehensive systems considered for MCDM because it can formulate the problem hierarchically and consider a combination of quantitative and qualitative criteria [80]. In addition, pairwise comparisons facilitate judgments and calculations and show compatibility and incompatibility decisions that are the reward of MCDM [81, 82]. AHP is based on three principles: model structure, comparative judgment of alternatives and criteria, combination of weights [83]. Accordingly, steps of this model include the following: In the first stage, the subject and purpose of decision-making are entered as a hierarchy of related decision elements that form a hierarchical set of decision criterion and decision alternative. In the second phase, to perform pairwise comparisons, a questionnaire is designed and distributed to respondents (managers, experts, users, etc.) to collect their views. Then, individual judgments (each respondent) are transformed into group judgments (for each pairwise comparison) using their geometric mean. This scale is from 1 to 9, where 1 is the lowest score, and 9 is the most important in pairwise comparisons (Table 2). Finally, the rate of inconsistency in decision-making is determined. One of the advantages of the AHP model is consistency control in decision-making, through which it can calculate the degree of consistency of the decision. The consistency rate (CR) is calculated by dividing the consistency index (CI) by the randomness index (RI). According to Table 3, “RI” depends on the number of criteria compared. To prepare the compatibility vector, the values of 2 λ components and the compatibility index are calculated. “λ” is always greater than or equal to the number of examined criteria “n” in the problem, and the compatibility index is calculated according to this principle. In this case, “λ − n” can be considered a basis of compatibility [85]. To calculate the compatibility rate can be used Equations (2) and (3):
| Intensity of importance | Definition | Explanation |
|---|---|---|
| 1 | Equal importance | Two activities contribute equally to objective |
| 3 | Moderate importance | Experience and judgment slightly favor one over another |
| 5 | Strong importance | Experience and judgment strongly favor one over another |
| 7 | Very strong importance | Activity is strongly favored, and its dominance is demonstrated in practice |
| 9 | Absolute importance | Importance of one over another is affirmed on the highest possible order |
| 2, 4, 6, 8 | Intermediate values | Used to represent compromise between the priorities listed above 1, 3, 5, 7, and 9 |
| n | 1 | 2 | 3 | 4 | 5 | 6 | 7 | 8 | 9 |
|---|---|---|---|---|---|---|---|---|---|
| RI | 0 | 0 | 0.58 | 0.90 | 1.12 | 1.24 | 1.32 | 1.41 | 1.45 |
| n | 10 | 11 | 12 | 13 | 14 | 15 | — | — | — |
| RI | 1.49 | 1.51 | 1.48 | 1.56 | 1.57 | 1.59 | — | — | — |
2.2.4. TOPSIS Method
The TOPSIS method is used for prioritization based on similarity to an ideal solution in decision-making, which facilitates the decision-maker to organize problems in a simple way [86]. Alternatives are ranked based on the shortest distance from the positive ideal solution (PIS) and the furthest from the negative ideal solution (NIS). The TOPSIS method evaluates and compares each alternative directly depending on data in matrices and weights [87]. Therefore, in the present study, the TOPSIS method was used to prioritize location indicators for wind farms. This method has been used in several studies to solve MCDM problems [83, 88]. According to this method, the best alternative will be the option that is nearest to the PIS and farthest from the NIS [89]. The TOPSIS steps are as follows:
Step 1
Create an evaluation matrix consisting of “m” alternatives and “n” criteria, with the intersection of each alternative and criteria given as xij, hens, a matrix .
Step 2
Step 3
Step 4
Step 5
Step 6
Step 7
Rank the alternatives according to siw(i = 1, 2, …, m).
2.2.5. WOA
According to Equation (11), p is a random number in range [92]. Alternating the two phases ensures the balance between intensification and diversification techniques, applying each 50% of the time. Overall, the structure and operations of WOA are simple, which facilitates its enhancement.
- 1.
Establish the necessary parameters (N, population size, Itermax) and then, initialize the population Xi(i = 1, 2…,N), as well as the coefficients a, A, C, l, and p.
- 2.
Assess the fitness of each search agent, and then choose as the ideal candidate.
- 3.
Update the following coefficients: a, A, C, l, and p.
- 4.
Determine the p value. (I) If p < 0.5, then determine the |A| value. (i) If |A| <1, update the position by Equation (7). (iii) Otherwise, if |A|≥1, select a random search agent Xrand and then, update the position by Equation (9). (II) Otherwise, if p > 0.5, then update the position by Equation (8).
- 5.
Verify that all whales (search agents) are taken into account. If not, move on to the next search agent; if yes, determine which search agents go over the search space and make the appropriate adjustments.
- 6.
Calculate the fitness for all search agents.
- 7.
Save the best solution .
- 8.
Verify that the stopping criteria are met. If not, move on to step three; if yes, provide the optimal solution and its corresponding fitness score.
2.2.6. Performance Indicators
The efficient distribution model was identified using two statistical performance tests. These tests were root mean square error (RMSE) and R2. Each test is discussed in the following subsections.
2.2.6.1. RMSE
2.2.6.2. Coefficient of Determination
3. Results
3.1. Screening Indicators
According to Table 4, 14 indicators were identified based on the responses of the experts. Among the selected indicators, average wind speed, wind continuity, distance from earthquake-prone areas, distance from military operation areas, distance from power network, and development costs are considered to be the most important location indicators. As the results demonstrate, selected indicators in terms of role and necessity of application include average wind speed, wind continuity, and wind power density as mandatory indicators of capability and distance from military operational areas and distance to historical monuments as mandatory restriction indicators. Likewise, other indicators in this study, such as distance from power networks and impact on health as capability preference, and distance from faults, distance from earthquake-prone areas, distance from residential areas, distance from access network, distance from airport, and workforce, were selected as restriction preference. In addition, the results indicate that indicators with frequency and CVR more than 9 and 0.63, respectively, have acceptable status, and indicators with less than this value are rejected.
| No. | Indicator | Frequency | CVR | Result |
|---|---|---|---|---|
| 1 | Average wind speed | 11 | 1 | Accepted |
| 2 | Wind continuity | 11 | 1 | Accepted |
| 3 | Wind power density | 10 | 0.81 | Accepted |
| 4 | Air pressure | 8 | 0.45 | Rejected |
| 5 | Atmospheric hazards | 3 | −0.45 | Rejected |
| 6 | Air temperature | 5 | −0.09 | Rejected |
| 7 | Distance from faults | 10 | 0.82 | Accepted |
| 8 | Distance from earthquake-prone areas | 11 | 1 | Accepted |
| 9 | Slope | 8 | 0.45 | Rejected |
| 10 | Aspect | 6 | 0.09 | Rejected |
| 11 | Elevation | 8 | 0.45 | Rejected |
| 12 | Stone type | 8 | 0.45 | Rejected |
| 13 | Distance from water sources | 7 | 0.27 | Rejected |
| 14 | Distance from vegetation | 8 | 0.45 | Rejected |
| 15 | Distance from land use | 9 | 0.63 | Accepted |
| 16 | Distance from residential areas | 9 | 0.63 | Accepted |
| 17 | Distance from protected areas | 8 | 0.45 | Rejected |
| 18 | Distance from historical monuments | 9 | 0.63 | Accepted |
| 19 | Distance from mines | 5 | −0.09 | Rejected |
| 20 | Distance from military operation areas | 11 | 1 | Accepted |
| 21 | Distance from tourism centers | 8 | 0.45 | Rejected |
| 22 | Distance from access network | 9 | 0.63 | Accepted |
| 23 | Distance from airport | 10 | 0.81 | Accepted |
| 24 | Distance from power network | 11 | 1 | Accepted |
| 25 | Distance from energy network | 5 | −0.09 | Rejected |
| 26 | Distance from communication network | 7 | 0.27 | Rejected |
| 27 | Development costs | 11 | 1 | Accepted |
| 28 | Workforce | 7 | 0.27 | Rejected |
| 29 | Political factor | 6 | 0.09 | Rejected |
| 30 | Impact on the economy | 10 | 0.81 | Accepted |
| 31 | Impact on health | 3 | −0.45 | Rejected |
| 32 | Acceptance rate | 8 | 0.45 | Rejected |
3.1.1. Rating Indicators
After screening and selecting indicators based on experts’ viewpoints, these indicators were ranked in two classes: importance degree and Importance percentage (Table 5). As the results revealed that the highest rank is related to “average wind speed,” and the lowest rank is allotted to “distance from historical monuments.”
| No. | Indicator | Importance (°) | Importance (%) | Rank |
|---|---|---|---|---|
| 1 | Average wind speed | 9 | 36 | 1 |
| 2 | Wind continuity | 7.81 | 31.27 | 2 |
| 3 | Wind power density | 6.9 | 27.6 | 5 |
| 4 | Distance from faults | 6.81 | 27.2 | 6 |
| 5 | Distance from earthquake-prone areas | 7 | 28 | 4 |
| 6 | Distance from land use | 6.09 | 24.3 | 8 |
| 7 | Distance from residential areas | 5.9 | 23.64 | 10 |
| 8 | Distance from historical monuments | 5.36 | 21.45 | 13 |
| 9 | Distance from military operation areas | 5.63 | 22.5 | 12 |
| 10 | Distance from access network | 5.81 | 23.27 | 11 |
| 11 | Distance from airport | 6 | 23.6 | 9 |
| 12 | Distance from power network | 7.27 | 29.9 | 3 |
| 13 | Development costs | 6.90 | 27.6 | 5 |
| 14 | Impact on the economy | 6.18 | 24.77 | 7 |
3.2. Annual Average Coastal Wind Speed
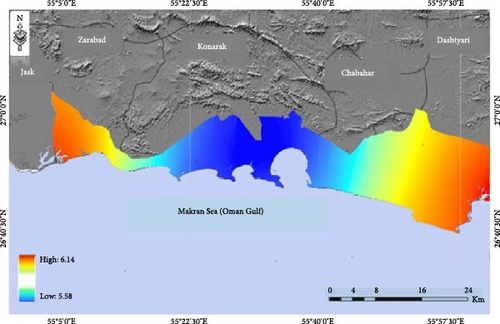
In this study, data from 42 anemometer stations over 17 years (from 2000 to 2016) were analyzed for wind farm zoning in Sistan and Baluchestan Province. Among the cities of this Province, Dashtyari and Zarabad have the highest wind power density, and Chabahar and Konarak have the lowest wind power density. Moreover, the results of the mean wind comparison show that the air currents in the area have a specific spatial order, and little long-term changes can be seen between the studied stations (Figure 3). In this area, the minimum and maximum annual average wind of the area has an average between 5.58 and 6.14 m/s. Hence, the 17-year wind speed data indicates that the coastal area of Sistan and Baluchestan Province has the minimum requirements for wind farms development.
3.3. Zoning of the Studied Area
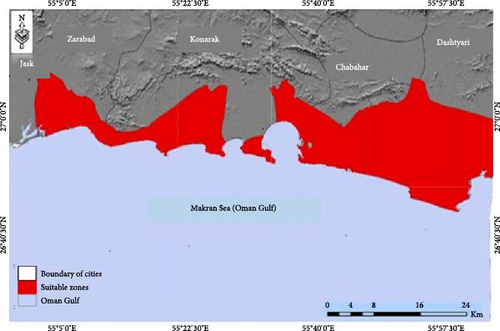
In the present study, primary sites suitable for wind farm development in the coastal areas of Sistan and Baluchestan Province were identified by the mandatory indicators and used as decision options for zoning. Combining mandatory indicators such as annual average wind speed, wind continuity, wind power density, and distance from historical monuments in the studied area indicates that 250 km2 ( = 5% of the area) from the coastal area is unsuitable for wind farms development, while more than 5000 km2 ( = 95%) of this area is suitable for development of this activity. As shown in Figure 4, Dashtyari and Zarabad cities have the highest wind power density and, in other words, suitable zones for wind farm development.
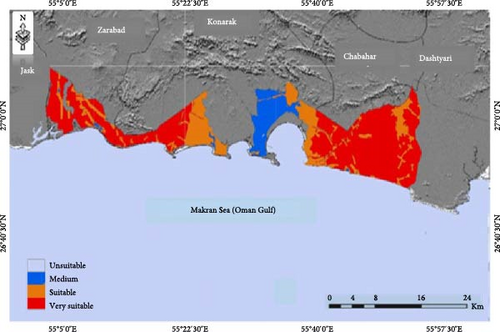
According to Table 6, determined indicators were weighted using the AHP model. Finally, these indicators were combined using the WLC method. The results demonstrate that, the most weight of preferred criteria is related to land hazards (0.442), and the most weight of the indicators is also allocated to distance from faults (0.575). Moreover, in the studied area, wind farm zones include four classes: unsuitable with an area of 141 ha, medium with an area of 35 ha, suitable with an area of 80 ha, and very suitable with an area of 195 ha (Figure 5). In this Province, suitable and very suitable zones are 36% of the total extent of the coastal area, and the largest area can be seen in the cities of Konarak and Zarabad.
| Criterion | Weight | Indicator | Weight | Final weight |
|---|---|---|---|---|
| Land hazards | 0.442 | Distance from faults | 0.575 | 0.19 |
| Distance from earthquake-prone areas | 0.425 | 0.14 | ||
| Human land uses | 0.264 | Distance from land uses and human activities | 0.224 | 0.07 |
| Distance from residential areas | 0.472 | 0.16 | ||
| Distance from military operation areas | 0.304 | 0.10 | ||
| Infrastructure | 0.295 | Distance from access network | 0.250 | 0.08 |
| Distance from airport | 0.256 | 0.09 | ||
| Distance from power network | 0.494 | 0.17 | ||
| Sum | 1 | — | — | 1 |
3.4. Prioritizing Coastal Cities
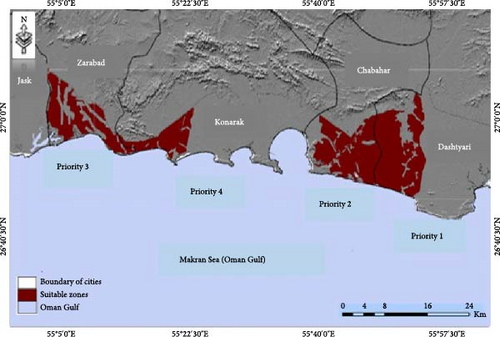
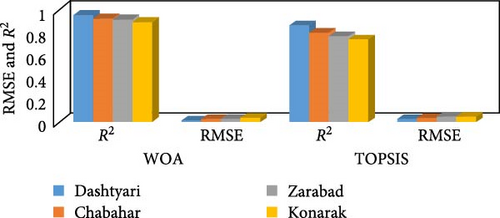
In this study, coastal cities were prioritized based on four criteria, including the extent of suitable zone, area of the coastal zone, population, and percentage of land use in the coastal area using the TOPSIS method and WOA. As was already indicated, the goal of this study was to minimize the possibility of error between the selection and prioritization of coastal cities. According to Table 7 and Figure 6, Dashtyari and Chabahar cities have the highest priority for wind farms development, followed by Zarabad and Konarak cities. The accuracy of prioritization of coastal cities for wind farms development was investigated using two different performance indicators. The estimated parameters and accuracy indices for each approach are listed in Table 8. Generally, the WOA method outperformed the traditional methods (TOPSIS) in all sites based on all indicators results; therefore, this supports the fact that artificial intelligence methods are better than traditional methods. In this study, the WOA method achieved the best results, according to RMSE and R2 outcomes. In this regard, Dashtyari had the lowest RMSE value in WOA, which was 0.011, while the worst value was recorded by Konarak with 0.042 in the TOPSIS method. A closer look at the accuracy analysis results revealed that for all wind farms sites, values greater than 0.9 for the results generated by R2 techniques imply which were very consistent with the observed observations and criteria. In Figure 7, the accuracy results of indicators RMSE and R2 in TOPSIS and WOA methods are represented graphically.
| Cities | Extent of suitable zone (km2) | Area (km2) | Population (person) | Land use (%) | Priority | Proximity coefficient |
|---|---|---|---|---|---|---|
| Dashtyari | 686.37 | 2272.9 | 42,797 | 4 | 1 | 0.830 |
| Chabahar | 569.74 | 800.4 | 141,348 | 12 | 2 | 0.731 |
| Zarabad | 255.04 | 1556.6 | 66,148 | 5 | 3 | 0.376 |
| Konarak | 427.55 | 654.7 | 10,945 | 5 | 4 | 0.114 |
| Criterion type | Positive | Positive | Positive | Negative | — | — |
| Criterion weight | 0.675 | 0.046 | 0.094 | 0.2 | — | — |
| Sites | Parameter and indicator | Estimation methods | |
|---|---|---|---|
| TOPSIS | WOA | ||
| Dashtyari | RMSE | 0.024 | 0.011 |
| R2 | 0.87 | 0.96 | |
| Chabahar | RMSE | 0.030 | 0.018 |
| R2 | 0.80 | 0.93 | |
| Zarabad | RMSE | 0.038 | 0.020 |
| R2 | 0.77 | 0.92 | |
| Konarak | RMSE | 0.042 | 0.032 |
| R2 | 0.74 | 0.90 | |
4. Discussion
Due to rapid population growth and industry development, the demand for energy consumption and fossil fuels has increased [31, 95]. As the coastal areas of Sistan and Baluchestan Province have enormous potential for renewable energy, especially wind energy, identifying suitable sites for wind farm development is very important.
The current study identified suitable sites for wind farm zoning in the coastal area of Sistan and Baluchestan Province. For this purpose, to identify location indicators in wind farms development, 32 indicators were extracted through theoretical literature review and expert viewpoints. According to the results, the highest frequency among the indicators is related to average wind speed, distance from residential areas, percentage of slope, and distance from the access network. These findings have been confirmed by Rediske et al. [62], which have demonstrated that the most frequently identified indicators are related to average wind speed and distance from the access network.
According to the results of the Delphi method, 14 indicators were identified based on the responses of the experts. In the present study, selected indicators in terms of role and necessity of application include average wind speed, wind continuity, and wind power density as mandatory indicators of capability and distance from military operation areas, and distance from historical monuments as mandatory indicators of restriction. In this regard, in the studies of Maher [96], Dashti and Dasht Bozorg [50], and Rediske et al. [62], the most important indicators for locating wind farms include average wind speed, wind power density, and wind continuity. As the results demonstration, in most studies, the main indicators for wind farms development include average wind speed, wind continuity, and wind power density.
According to the results, the coastal area of Sistan and Baluchestan Provinces has a wind speed of more than 5.6 m/s per year, and the lowest average percentage of wind continuity is associated with the cities of Zarabad and Dashtyari. These results were also confirmed in the study by Tayebi and Sanayei (2015).
Other effective indicators in locating wind farms, such as distance from power network and impact on health as capability preference, and distance from faults, distance from earthquake-prone areas, distance from residential areas, distance from access network, distance from airport, and workforce, were selected as restriction preference. These indicators have been used in other studies by Gigovic et al. [53], Solangi et al. [56], and Moradi et al. [59], similar to this study.
Based on the weighting results (using the AHP model) and the combination of indicators (using the WLC method), the coastal area was divided into four categories: weak, medium, suitable, and very suitable. Among classes, suitable class covers about 36% of the studied area. Tayebi and Sanayei [97] identified the coastal waters of Chabahar city and the center of Konarak city as suitable for wind farm development, which is consistent with the results of the present study. In addition, the results of the studies by Minaiyan et al. [98] and Gandomkar [33] showed that Chabahar city is suitable for wind farms development in terms of potential and environment.
Finally, coastal cities were prioritized based on four criteria, including the extent of suitable zone, area of the coastal zone, population, and percentage of land use in the coastal area using two numerical estimating methods (TOPSIS) and artificial intelligence optimization (WOA). According to the results, the cities of Dashtyari and Chabahar have the highest priority for wind farm development, followed by the cities of Zarabad and Konarak. These findings were also confirmed in the study by Sadeghi et al. [35]. Likewise, in this study, the WOA method achieved the best results, according to RMSE and R2 outcomes. In this regard, Dashtyari had the lowest RMSE value in WOA, which was 0.011, while the worst value was recorded by Konarak with 0.042 in the TOPSIS method. Al-Quraan et al. [99], in their study, stated that WOA reduces the error between the estimated and the measured wind speed probability. Therefore, the WOA method has higher accuracy and precision than other traditional methods. In addition, the results of the study by Qais et al. [100] also indicated that WOA, by minimizing the proposed high-dimensional cost function of integral squared errors of inputs, provides accurate convergence and an effective variety of solutions. According to the above results, the coastal area of Sistan and Baluchestan Province has the capacity to construct wind farms. Likewise, suitable locations for wind farms development in this Province can be prioritized using various environmental indicators.
5. Conclusion
This study identified and surveyed the most suitable areas for wind farm development in the coastal area of Sistan and Baluchestan Province based on various environmental indicators. The main goal of this research is to identify the most suitable sites for wind farm development; hence, 14 location indicators were analyzed. In this regard, the most important capability indicators include climatic conditions and wind potential of the area, and the main limitations indicators also include natural hazards, protected areas, historical monuments, development infrastructures, and human uses. According to the results obtained, 75% of the identified areas are suitable and very suitable for wind farms development. Therefore, by prioritizing coastal cities, it is possible to develop wind farms in this Province. The location of wind power plants requires the measured wind speed, which can achieve more accurate results by considering the number of winds measuring stations in the dry part of the coastal areas. Another important parameter in selecting suitable sites in wind farms development is the consideration of sensitive environmental areas, which can prevent environmental impacts and consequences. In addition, in wind farms development, economic factors and the amount of costs affecting the economy of the area should be examined, and the zones identified based on the lowest cost and the highest economic growth should be prioritized. According to the obtained results, there are still important issues that have not been investigated in this research and can be suggested as future research. These subjects include examining and mapping the average wind speed, wind continuity, and wind power density in different height classes from the ground, mapping of the maximum coastal wind speed by month and season for turbines with speeds over 25 m/s, as well as identifying zones with the possibility of a storm in the area.
Ethics Statement
All procedures performed in studies involving human participants are in accordance with ethical standards. This article does not contain any studies with animals performed by any of the authors.
Consent
Informed consent was obtained from all individual participants included in the study.
Conflicts of Interest
The authors declare no conflicts of interest.
Author Contributions
Parvaneh Sobhani: writing–original draft, formal analysis, conceptualization, visualization, methodology, data curation, review and editing, supervision. Mohammad Borhani: data curation. Afshin Danehkar: conceptualization, supervision. Mazaher Moeinaddini: conceptualization, supervision.
Funding
This research has not received financial support.
Open Research
Data Availability Statement
The data that support the findings of this study are available from the corresponding author upon reasonable request.


