Robust Resilient Operation of the Renewable Energy Based Two-Way Electricity Distribution Network in the Presence of Energy Storage and Demand Response Programs
Abstract
One of the major problems of the operators of electricity networks is the operation of the network during events. Events with high impact and low probability of occurrence are a type of events that can cause severe disruptions in power grids. Therefore, the power grid must be resilient in dealing with such events. In recent years, electricity network operators have tried to improve the conditions of using distribution networks by using methods called flexibility. This paper aims to use flexible methods, such as energy storage systems and demand response programs to increase resiliency, reduce costs, and level the power exchange curve with the sub-distribution substation. Therefore, first, the modeling of energy storage systems and demand response programs is presented in the energy management problem. Then, the mentioned models are integrated with the problem of the resilient operation of the two-way distribution network. Also, considering the parameters of active and reactive loads and active generation of wind and solar renewable energy resources, uncertainty is considered in the problem. The resilient operation model has been considered and rewritten again, considering the robust optimization method for modeling uncertainties. Finally, a resiliency index is provided to show the resiliency of a network in a relative manner. In the proposed model, the simulation is done on IEEE 33-bus network in four states and six cases. The states considered include grid operation without energy storage systems and demand response programs, operation with energy storage systems, operation with demand response programs, and operation with the simultaneous presence of energy storage systems and demand response programs. Also, in this paper, six cases include operation in normal conditions for comparison with other cases, operation in outage conditions of one-way and two-way busses connected to the sub-distribution substation, operations in disconnection of some local resources, and network lines have been investigated. The results obtained from this research indicate the improvement of resiliency conditions using the method considered.
1. Introduction
- 1.
The first type of events are events that have happened in large numbers in power grids, and the probability of their occurrence is very high. Therefore, because such incidents are highly likely to occur, they are evaluated as a reliability problem [2].
- 2.
There are other types of incidents that have a low probability of occurrence, but if they occur, they have a significant impact on the system. Unlike the first category of incidents, these types of incidents, which are known as the second category of incidents, cannot be evaluated in the form of reliability. Such incidents are evaluated in the form of a concept called resiliency in the power systems.
- 3.
It is worth noting that the third events are the same as the second type of events, except that they have yet to occur even once in a certain region. It is impossible to assess the consequences of their occurrence correctly, and we can only talk about the possibility of their occurrence. Such events are evaluated for resiliency if they occur once.
Resiliency shows the ability of the power systems to deal with events with a low probability of occurrence and high impact [3, 4].Considering the renewable energy resources along with various flexibilities, such as demand response programs [5], energy storage systems [6, 7], backup diesel generators [8], and electric vehicles [9], can significantly increase the resiliency index of the power systems. The mechanism of these flexibilities is such that their presence in the network leads to an electricity supply. It is for consumers who have experienced power outages due to events. In this paper, energy storage systems, and demand response programs are used to increase the resiliency of distribution networks during events with low probability and high impact. energy storage systems are one of the equipment used in the various applications in the power grids and are considered flexible in the discussion of energy management. This equipment can help to improve the operating conditions through charging and discharging mechanism [10, 11]. It is also possible to use programs to help the optimal use of the distribution network. In this case, this goal can be achieved using the flexibility of demand response programs. In the demand response programs, the distribution network operator provides a series of disconnection and connection programs for subscribers according to the load curve to achieve optimal utilization without causing problems [12]. In recent years, various events have caused severe damage to the power system. Therefore, improving network resiliency is necessary to resist, recover from destructive events, minimize adverse events’ duration, severity, and negative effects.
Several papers in the literature have investigated the power system’s resiliency against various types of events. According to studies conducted over the past few decades, catastrophic events, such as the powerful earthquake in Japan, Hurricane Katrina, and cyber-physical attacks have been reported in Ukraine [13, 14].These events have put the final consumers in crisis and damaged the energy infrastructure. In references [15, 16],the authors have focused on increasing the resiliency of the distribution network under storm disasters based on two-stage stochastic programing. In [17], the authors presented a new model to increase resiliency against storms by using the allocation of distributed generation resources and used the robust optimization method to model the uncertainties of the problem in this paper. Also, in [17], a resilient model is proposed to plan microgrids in the presence of demand response programs optimally, and a random and stable hybrid optimization method is used to deal with uncertainties. In another research work, a resilient model has been used for the optimal planning of microgrids in the presence of demand response programs, the stochastic and robust hybrid optimization method has been used to represent uncertainties [18]. In another research work, Nourian and Kazemi [19] and his colleagues presented a comprehensive model to increase the flexibility of the distribution system in emergency situations, in which wind turbine and energy storage systems are considered. In [20], considering the uncertainty of the renewable energy resources and demand response, the authors propose an optimal planning method to cope with severe natural disasters and improve the resiliency index. Finally, in the research [21], terms related to resiliency, classification of known and unknown extreme events, the impact of resiliency on the power systems, and methods of increasing resiliency have been presented. In [22], a distributed generation and line hardening configuration strategy is proposed with the aim of increasing the resiliency of distribution networks and coping with severe natural disasters. In [4], the optimal resilient operation of the smart distribution network in the presence of the renewable energy resources and smart parking lots is analyzed under uncertainty. In reference [23], Marcos FP et al. present an optimization model aimed at increasing the resiliency index using energy storage systems, photovoltaic units, remote control switches. In another research work, a new optimal operation strategy is presented to increase the flexibility of the distribution networks. In general, in this paper, the goals in the proposed optimal strategy include resiliency, operating costs, and emission of pollutants [24]. Reference [25], provides a general formula to strengthen the resiliency operation of the distribution networks along with the renewable energy resources. Also, in this paper, a scenario-based optimization formula is used to deal with uncertainties. In [26], proposes a stochastic programing approach for the resilient distribution network operation during wildfires. In references [27, 28], the authors have presented an optimal model for the resilient operation of the distribution networks against fire, have studied the contribution of microgrids and demand response programs.
- •
Defining a resiliency index to assess the resiliency of the distribution network quantitatively.
- •
Considering the distribution network as a two-way supply to apply more flexibility to the distribution network.
- •
Applying the flexibility method of energy storage system to increase resiliency and reduce the costs of using the distribution network.
- •
Using a variety of scattered generation resources, including wind and solar renewable energy resources, local controllable generators, and fuel cell resources.
- •
Using the robust optimization method to model the uncertainties of the problem.
- •
Considering all types of loads, including homemade, commercial, industrial, and sensitive loads, according to the cost of electricity supply and the cost of load shedding.
2. Concepts Under Discussion
2.1. Resiliency
Recently, the concept of resiliency in the power network has become a prominent research area for researchers, which is considered the boundary between network strength and network reliability. In general, resiliency means dealing with all kinds of crises and responding flexibly to them. Due to environmental changes, high-intensity events are increasing worldwide. Therefore, in the design of the power networks, resiliency should also be considered in addition to reliability. Therefore, improving resiliency in the distribution networks is the main challenge facing planners in these networks. Resiliency is directly related to time and is generally described as short-term and long-term. The short-term resiliency refers to the system’s ability to continuously supply consumers’ electricity demand after severe events, such as earthquakes. Still, long-term resiliency is the ability to deal with new events [15, 29].
2.2. Flexibility
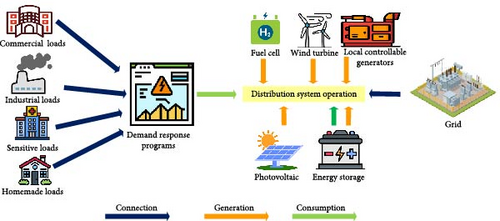
The occurrence of unexpected events is one of the main factors of extensive blackouts and financial losses to the power networks [30]. Therefore, technologies, such as energy storage systems and demand response programs are essential in dealing with extensive blackouts and improving the network resiliency index. Recently, with the growth of the power networks and the penetration of many equipment, flexibility will play a significant role in the stability of power networks. Two of these flexibilities are using demand response programs and energy storage systems. In addition, considering that the primary goal of this research is to reduce load shedding and increase the resiliency index, according to Figure 1, considering the types of resources along with these flexibilities in the network can help in the optimal operation of the network.
2.2.1. Energy Storage Systems
With the new structure of the power systems, and the increasing penetration of the renewable energy resources, power grids have faced significant challenges, including uncertainties, and to solve these challenges, there are various flexibilities, one of the most widely used of which is energy storage systems. The European Commission provides a definition of the performance of the energy storage systems: “the act of deferring an amount of the energy that was generated to the moment of use, either as final energy or converted into another energy carrier” [31]. Energy storage systems have advantages, such as providing flexibility to the distribution system operator and covering generation shortfalls when demand exceeds production, or no other power resource is available. On the other hand, energy storage systems have some challenges, such as laws related to operation, high investment costs, and environmental effects [32, 33]. Energy storage systems are charged during off-peak and discharged during peak hours, can effectively reduce losses, peak load, etc.
2.2.2. Demand Response Programs
- •
The reduction of the peak hours of the power systems
- •
The decrease in extensive blackouts
- •
The improvement of using the renewable energy resources
There are two types of demand response programs [35]: incentive programs or price/time based programs. Incentive programs include direct load control, load shedding or reduction, demand sales, emergency demand response programs, capacity market program, and ancillary service programs. Also, price/time-based plans include real time price, critical peak hours, and time of use.
3. Problam Formulation
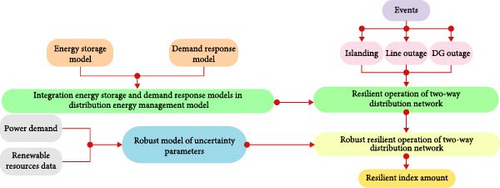
This section presents the formulation of the problem of resilient operation of the distribution network with energy storage system and demand response programs flexibilities. For this purpose, firstly, these two flexibility methods will be examined. Their modeling will be presented for use in the energy management problem, and finally, it will be integrated with the problem of resilient operation of the distribution network. An active distribution network is considered by considering the renewable energy resources and controllable generators as local resources in the distribution network. The mentioned operation model is presented for operation in emergencies after an event with high impact and low probability, which includes natural disasters and cyber-physical attacks, and its purpose is resilient operation of the distribution network. Due to uncertainty in the problem considered in this paper, a robust optimization method has been used to model these uncertainties. The whole process of the problem formulation and its implementation is shown in Figure 2, and the details of each part will be explained separately. First, by determining energy storage system models and demand response programs and then combining them in the distribution network’s operation model, the problem’s initial model is presented. Then, by determining the type of events, formulations are presented in emergencies and considering resiliency. According to the uncertainties of the model caused by the consumption loads and renewable resources, their robust model is presented, and by combining them with the problem of resilient operation of the distribution network, a robust operation model is obtained. After implementing the model and determining the resiliency of the distribution network during events and the effect of the methods used in this paper, the resiliency index is presented.
3.1. Energy Storage System Modeling
3.2. Modeling Demand Response Programs
3.3. Modeling the Optimal Resilient Operation of Distribution Network
Equations (14)–(16) have examined each of the three terms included in the objective function.
3.4. Modeling the Problem by Considering Uncertainties
4. Case Studies
4.1. Information About the Studied System and Considered States and Cases
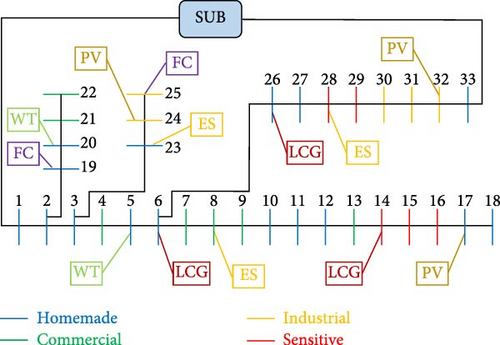
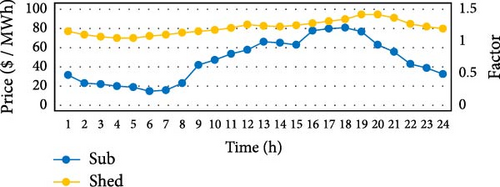
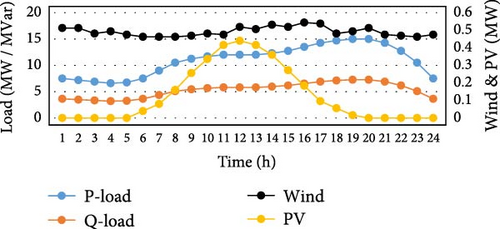
In this section, the implementation of the proposed model on the IEEE 33-bus network, on which some modifications have been made, is discussed. The mentioned system is one of the networks frequently used in the references related to the operation of the distribution network, and information about the lines of this network can be easily obtained. This radial network has 33 busses and 32 lines between the busses. Wind, solar, local controllable generators, and fuel cell resources are placed on some of the busses of this network. Considering that this network is fed from two-way, it is connected to the sub-distribution substation through busses 1 and 33, and the possibility of two-way power exchange with the sub-distribution substation is provided through these busses. The maximum exchangeable power through each of these connecting busses is equal to 3 MW. The line diagram of this network, along with the resources installed on the network and the considered energy storage systems, are shown in Figure 3. Two wind units are installed on busses 5 and 20, three solar power resources are installed on busses 17, 24, and 32, and three local controllable generators are installed on busses 6, 14, and 26, two fuel cell resources installed on busses 19 and 25, and three energy storage systems installed on busses 8, 23, and 28. Four types of homemade, commercial, industrial, and sensitive loads are considered in this network, which differs from each other based on the purchase price of electricity and the price of disconnection. The cost of purchasing electricity and the cost of shedding during time periods of off-peak are specified in Table 1. The effect of the time periods on the cost of purchasing electricity and the cost of load shedding, along with the cost of power exchange with the sub-distribution substation, is shown in Figure 4. Figure 5 shows the active and reactive power consumption of loads and the generation power of wind and solar units during the operation time periods. The maximum active power that can be obtained from fuel cells and local controllable generators is equal to 0.5 and 2 MW, respectively. The minimum and maximum reactive power that can be obtained from local controllable generators is −0.5 and 0.7 MW, respectively. In the applied demand response programs, a maximum of 5% of the load of each bus can be cut and a maximum of 15% of the load can be transferred to each bus. The efficiency of the considered energy storage systems is equal to 0.95 and their maximum capacity is equal to 1.2 MW. Energy storage systems can have a maximum of 0.4 MW of active power in charge or discharge mode, and the minimum and maximum reactive power that can be obtained from these resources is −0.2 and 0.2 MW, respectively.
| Load type | Shedding price ($/MWh) | Electricity price ($/MWh) |
|---|---|---|
| Homemade | 150 | 15 |
| Commercial | 200 | 13 |
| Industrial | 250 | 10 |
| Sensitive | 350 | 8 |
- •
Operation in the state without the flexibility of demand response programs and energy storage systems
- •
Operation in the state with the flexibility of demand response programs
- •
Operation in the state with the flexibility of energy storage systems
- •
Operation in the state with both flexibilities of demand response programs and energy storage systems
- •
Operation in normal network mode.
- •
Operation in islanding mode from the side of bus number 1.
- •
Operation islanding mode from the side of bus number 33.
- •
Operation in islanding mode from the side of both bus numbers 1 and 33.
- •
Operation in mode that several local network resources are outage.
- •
Operation in the mode of outage of several network lines.
In the first case, no event occurred, and there was no disconnection. This case is stated for the analysis of other cases. In cases two to four, the distribution network, which is fed from two-way, is disconnected by one of the busses connected to the sub-distribution substation or both busses connected to the sub-distribution substation, and the power exchange with the sub-distribution substation does not occur. In the fifth case, the resources placed on the busses are disconnected. In the sixth case, the line between busses number 3 and number 23 and the line between busses number 6 and number 26 are disconnection.
4.2. Simulation Results
According to the determination of the input data, the considered states and cases are analyzed in the results section. Considering several indicators, states, and cases are compared. According to the objective function of the problem, which is of the cost type, the objective function’s value is considered an index. The losses of the distribution network are also considered the second indicator, and the effect of applied flexibilities can be determined. The maximum power of buying or selling in the entire operation time is also considered as two other indicators. Finally, the resiliency index is also considered the most importantindex. Table 2 compares the indicators expressed in different states and cases.
| Case 1 | Case 2 | Case 3 | Case 4 | Case 5 | Case 6 | |
|---|---|---|---|---|---|---|
| State 1 | ||||||
| Objective | −1456.941 | −1182.728 | −1436.93 | 271.747 | 3121.834 | 15006.565 |
| Losses | 3.096 | 3.053 | 3.09 | 3.026 | 2.873 | 2.702 |
| Buying po. | 3 | 3 | 3 | 0 | 3 | 1.658 |
| Selling po. | 2.706 | 1.41 | 3 | 0 | 1.331 | 3 |
| Resiliency | 100 | 100 | 100 | 96.441 | 95.959 | 92.358 |
| State 2 | ||||||
| Objective | −1865.435 | −1508.665 | −1827.305 | −684.118 | 2126.85 | 14636.76 |
| Losses | 3.081 | 3.043 | 3.092 | 3.109 | 2.853 | 2.688 |
| Buying po. | 3 | 3 | 3 | 0 | 3 | 2.134 |
| Selling po. | 3 | 1.678 | 3 | 0 | 1.16 | 3 |
| Resiliency | 100 | 100 | 100 | 98.441 | 98.348 | 92.337 |
| State 3 | ||||||
| Objective | −1672.658 | −1406.143 | −1654.653 | −539.849 | 1597.392 | 14785.122 |
| Losses | 3.09 | 3.046 | 3.084 | 3.093 | 2.859 | 2.696 |
| Buying po. | 3 | 3 | 3 | 0 | 3 | 1.771 |
| Selling po. | 2.706 | 1.41 | 3 | 0 | 1.321 | 3 |
| Resiliency | 100 | 100 | 100 | 98.099 | 99.271 | 92.326 |
| State 4 | ||||||
| Objective | −2076.656 | −1700.509 | −2033.881 | −1357.131 | 865.261 | 14435.831 |
| Losses | 3.073 | 3.034 | 3.085 | 3.119 | 2.845 | 2.682 |
| Buying po. | 3 | 3 | 3 | 0 | 3 | 2.179 |
| Selling po. | 3 | 1.677 | 3 | 0 | 1.158 | 3 |
| Resiliency | 100 | 100 | 100 | 99.951 | 100 | 92.326 |
Table 2 shows that using demand response programs and energy storage systems reduces costs. The positive value of the objective function means cost, and its negative value means income, which in some cases, there was income. In the normal operation of the network and without event, in the first case, the use of demand response and energy storage causes a slight reduction in losses, and the simultaneous use of these two items causes a further reduction in losses. The peak power purchased in the first case equals the maximum exchange amount with the sub-distribution substation. Still, the purchased amount has increased by using flexibilities, which causes an increase in income and a decrease in costs. In the second case, when bus number 1 is disconnected from the sub-distribution substation, the amount of losses is reduced by using flexibilities. In this case, the amount of peak power purchased is equal to the maximum amount of exchange with the sub-distribution substation in all states. Still, the amount of power sold to the sub-distribution substation has increased using demand response programs. Energy storage does not reduce the amount of power sold to the sub-distribution substation. In the second case, despite the disconnection of bus number 1 from the sub-distribution substation, the resiliency rate is 100% in all states, and no load shedding has occurred, which indicates the efficiency of the two-way power supply network. Like the second sample, for the third sample as well, where the communication with the sub-distribution substation has been cut through bus number 33, the amount of resiliency is 100% in all cases. Unlike the second case, where demand response programs played a better role in reducing losses than energy storage systems, in the third case, demand response programs not only did not reduce losses but also increased losses to a small extent. In this case, the energy storage system has performed better and caused a slight reduction in losses. In the third case, the amount of power purchased from the sub-distribution substation or sold to the sub-distribution substation equals the maximum exchange amount with the sub-distribution substation. In addition to this, the fourth case is a combination of the second and third cases. In this case, the distribution network is not connected with the sub-distribution substation from two-way, and flexibilities increase losses. But with precision in the amount of resiliency, it is clear that the use of these methods has increased the network’s resiliency in such a way that in the absence of flexibilities, the value of the resiliency index was equal to 96.4%. Still, it has increased in the second to fourth states, and in the fourth state it has reached 99.9% and caused a lot of outages to disappear. In the fifth case, using the methods presented in this paper has reduced casualties. The resource outages in this case has caused the grid to supply its local generation shortfall through the sub-distribution substation. In this case, the amount of electricity sold occurs only in some off-peak hours, and using demand response programs reduces the amount of electricity sold to the sub-distribution substation. But using energy storage systems will increase sales because energy storage systems, unlike demand response programs, are not only consumers and can act as both consumers and producers. The amount of resiliency in the fifth case has increased using energy storage systems and demand response programs. In the fourth state, its value has reached 100% and caused the complete disappearance of load shedding. However, in the first state, resilience equals 95.9%, and much load shedding has been eliminated by using these methods. In the sixth case, due to the outage of several network lines, the number of losses decreased slightly by applying the considered methods. In this case, by lines outage of some subbranches, the network becomes an island and may have excess generation or lack of consumption. Therefore, busses number 26 to number 33 have an extra power, which leads to the sale of power to the sub-distribution substation. In the main branch of the network, the local resources cannot supply the power required by the consumer loads, which causes the electricity to be purchased from the sub-distribution substation. In addition, according to the results, if demand response programs are used, the amount of electricity purchased from the sub-distribution substation has increased. In this case, because the price of electricity is lower during off-peak hours, more power is purchased from the sub-distribution substation. In the sixth case, because there are not enough resources in busses number 23 to number 25, the resiliency remains mostly the same because all the load shedding occurred on these busses. Due to the possibility of a two-way exchange of electricity between the distribution network and the sub-distribution substation, at some points in time, the amount of generation of local resources in the distribution network may exceed the needs of the consumers of that network. Therefore, the surplus generation of local resources is sold to the sub-distribution substation. At some point, the generation of local resources may be less than the needs of the consumers of that network, in which case it is necessary to purchase power from the sub-distribution substation to supply the remaining loads.
According to Figure 6, the amount of electricity exchange between the distribution network and the sub-distribution substation in each connection bus between the distribution network and sub-distribution substation is considered in five cases and four states. In case four, an island on both sides of the distribution network and without connection with the sub-distribution substation, the amount of electricity exchange is zero. Therefore, the power exchange diagram between the distribution network and the sub-distribution substation is not considered in this case.
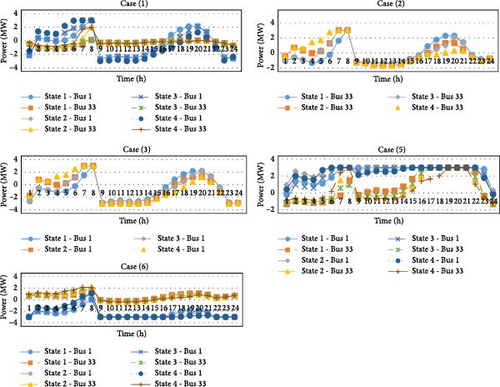
In the first case, the distribution network has sold power to the sub-distribution substation in most periods from two-way. Except in peak hours and some hours when the cost of purchasing power from the sub-distribution substation is lower than the local controllable generators, the power has been sold to the sub-distribution substation in the rest of the periods. At 8 o’clock, power was purchased from the sub-distribution substation due to the low cost of supplying power from the sub-distribution substation compared to local controllable generators. Using the considered flexibility methods, the amount of power purchased has increased in periods of off-peak hours at a low price, and instead, power sales have increased in other periods, resulting in a reduction in costs, and profitability has increased. In the second case, in off-peak hours, due to the low cost of supplying power from the sub-distribution substation and in peak hours due to the lack of generation of local resources, power was purchased from the sub-distribution substation. But during the periods of the day when the solar resources have generation, the amount of generation has increased from the consumption of the network, which causes power to be sold to the sub-distribution substation. Using energy storage systems flatten the power exchange graph, and less power is purchased from the sub-distribution substation during off-peak hours and peak hours. In the fifth case, power is purchased from the sub-distribution substation from the side of bus number 1 in most time intervals. Still, in most intervals, less power is purchased from the sub-distribution substation through bus number 33. It can also be seen that some power has been sold to the sub-distribution substation in this bus. Due to the disconnection of several local resources in this case, the generation rate of local resources has decreased and cannot provide the required power of the consumer loads. Therefore, to supply the loads consumed in most periods of time, power has been purchased from the sub-distribution substation. Since there are fewer local resources near bus number 1 and there are more local resources near bus number 33, the distribution network has purchased more power from bus number 1. Of course, by using the considered flexibility methods, the amount of purchased power has decreased in some periods of time. In the sixth case, when the lines outage, most of the time, power was purchased from the sub-distribution substation through bus number 1, but most of the time, electricity was sold to the power sub-distribution substation through bus number 33. Due to the outage of the communication lines between busses number 6 and 26 and the existence of resources whose generation is more than the consumption on busses number 26–33, power has been sold to the sub-distribution substation in most of the periods.
Since the network’s resiliency in cases first to third is 100%, load shedding does not occur. In the second and third cases, when the network is disconnected from one side of the substation, the network continues to work without load shedding, indicating the network’s efficiency from both sides. The amount of load shedding in samples 4–6 is shown in Figure 7.
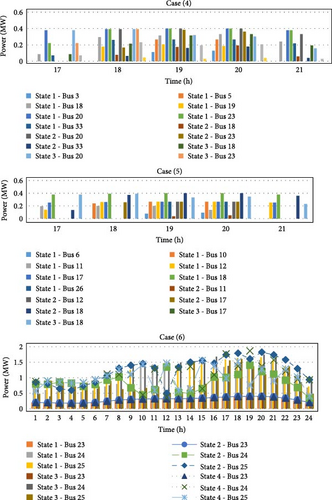
In the fourth case, due to disconnection with the sub-distribution substation, some load shedding occurred during peak hours due to the lack of generation of local resources. Of course, in the first case, there was a load shedding in busses numbers 3, 5, 18, 19, 20, 23, and 33, all of which have homemade loads. In the second and third cases, by using demand response programs and energy storage systems, some load shedding has been eliminated in some busses, and some load shedding has occurred only in bus numbers 18, 20, 23, and 33. In the fourth state, only a small amount of load shedding occurred on bus number 18, and the simultaneous use of two flexibility methods in this paper has caused a significant reduction in load shedding. It has dramatically increased the resiliency of the network. The load shedding in the fifth case also occurred similarly to the fourth case in peak hours periods and homemade loads. In this case, the use of flexibility methods has caused a significant reduction in load shedding. In the sixth case, with the line outages, a wide load shedding occurred in busses number 23 to number 25. Also, in this case, despite the interruption of the line between busses 26 and 6, the load shedding did not occur in busses number 26 to number 33, and the reason for this is the presence of sufficient local resources in these busses. But since there are not enough local resources at busses number 23 to number 25, a massive load shedding occurs if the line between busses number 3 and number 23 is interrupted. With their generation, local controllable generators play a significant role in supplying the load of consumers in the operation of the distribution network. Due to their generation cost, these resources provide cheaper electricity than the sub-distribution substation for many periods, making them significantly involved in operation planning. The amount of active generation of local controllable generators in four states and six considered cases is shown in Figure 8.
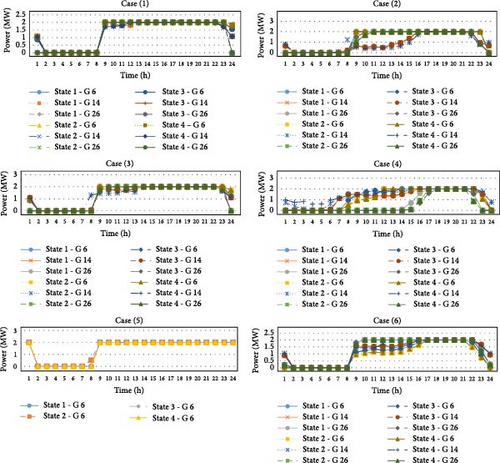
In the first case, there may be no need to produce locally controllable generators in periods of off-peak due to the excess generation of the renewable resources and fuel cell resources. Because local controllable generators have a generation cost, but the generation cost is not considered for other resources of the network, or because of the lower cost of supplying power from the sub-distribution substation compared to local controllable generators, which causes instead of producing resources of local controllable generators, the power required by the consumer loads can be provided through the sub-distribution substation. During peak hours, due to the increase in consumption and due to the increase in the cost of providing power from the sub-distribution substations, the local controllable generators are in the network with their maximum generation during most of the operating times. In addition, they may generate more power to sell to the sub-distribution substation during these periods, such as around noon. In the second and third cases, where the distribution network is fed from one side, the generation rate of local controllable generators has decreased in some periods. In the periods when the clocks are around noon, the generation power of the local controllable generators is more than the consumption and has been sold to the sub-distribution substation. Also, by cutting off one side of the distribution network, a lower amount of power can be sold to the sub-distribution substation, causing a reduction in the generation of local controllable generators. In the fourth case, due to the disconnection of the two-way connection with the sub-distribution substation and the lack of power exchange between the distribution network and the sub-distribution substation, the generation rate of local controllable generators has decreased drastically in the period and even the generation of the generator installed on bus number 26 reached zero around noon. During peak hours, due to the high consumption of the network, all local controllable generators are operated at their maximum value. In the fifth case, by cutting off two local controllable generators, the controllable generator installed on bus number 6 is operated at its maximum value in most time intervals. This generator only generate zero during off-peak hours. In the sixth case, despite the grid lines outage, the generator installed on bus number 26, located in the branch leading to the line between busses number 6 and number 26, has its maximum generation in most periods. The rest of the generators generate as much as the network needs to supply the consumption loads of other parts of the network.
Energy storage systems can improve the usage conditions of the distribution network by combining with local resources and using charging and discharging features. According to the use of energy storage systems in the third and fourth states in the simulations, their charge and discharge rates in these states and the six cases considered are shown in Figure 9.
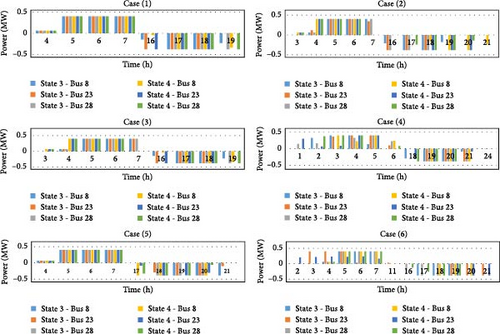
According to the results, the energy storages are charged in periods of off-peak and with a low generation cost of resources and power purchased from the sub-distribution substation. Also, they are discharged during peak hours to reduce costs and reduce the power purchased from the sub-distribution substation and the generation capacity of the resources. In the three cases, resiliency is 100% without energy storage systems. In these cases, energy storage systems have performed well in reducing costs. Still, in other cases, energy storage systems simultaneous charging and discharging mechanism will reduce costs and increase resiliency. In the fourth case, due to the complete interruption of the sub-distribution substation, the role of energy storage systems can be significant to improve resiliency. Using these resources can significantly reduce load shedding. In the fifth case, due to reduced local resource generation, energy storage systems can transfer the excess generation of resources, or the power purchased at a low cost from the sub-distribution substation in off-peak to peak hours. In the fifth case, due to reduced local resource generation, energy storage systems can transfer the excess generation of resources, or the power purchased at a low cost from the sub-distribution substation in off-peak to peak hours.
In addition, considering that demand response programs are not generation resource, but they can reduce cost and load shedding. In the simulations considered in this paper, demand response programs have been applied as flexibility in the second and fourth states. In Figure 10, the amount of power cut and transferred after using the demand response programs in the second and fourth states and six cases is considered.
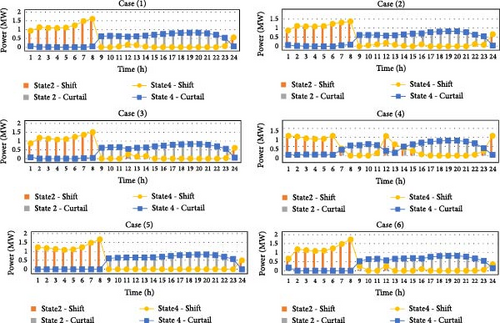
With the application of demand response programs, it is clear that in all cases and states, some load has been interrupted during peak periods and transferred to off-peak periods. Cases 1 to 3 due to the 100% resiliency of the network, the application of demand response programs has reduced the cost of power supply during peak periods and leveled the power exchange diagram with the sub-distribution substation. In the fourth case, by applying demand response programs, according to the maximum generation of solar resources in the noon hours, some of the consumption load of other time periods has been transferred to these hours. In the fifth and sixth cases, the application of demand response programs can be in line with the goals of reducing load shedding during peak periods, reducing network stress during peak periods, and reducing network operation costs.
5. Conclution
Due to the environmental problems and the smartening of power grids, especially at the distribution network level, the number of events with high impact and low probability has increased. Due to the necessity of continuous operation of power grids, it is necessary to use the distribution network during these events to increase the network’s resiliency. In recent years, researchers of power networks have focused on methods to improve the conditions of use of power networks called flexibility. Energy storage systems are one of the methods that can create flexibility in many power grid problems. These resources can participate in the energy management problem of distribution networks by using the charging and discharging mechanism. Another method of flexibility in power grids is using demand response programs. By creating incentives, the operators of the electricity networks try to encourage the subscribers to transfer their load from peak hours to off-peak hours. In addition, by considering the distribution network as a two-way supply, it has been tried to reduce the amount of load shedding during various events. This paper has tried to increase resiliency and reduce costs by using energy storage system and applying demand response programs in the two-way power distribution network. Therefore, the modeling of the utilization of the distribution network and the integration of the methods above were carried out and implemented on a test network. By considering several different states of using these methods and comparing them with each other during the occurrence of different events, it was shown that the considered methods improve the operation conditions of the distribution network. By considering the resiliency index depending on the amount of load shedding during events, the amount of resiliency is quantitatively calculated, and the effect of the methods used to increase resiliency can be evaluated.
Nomenclature
Indices and Sets
-
- n:
-
- Index of energy storage system
-
- i, j:
-
- Indices of bus numbers
-
- k:
-
- Index of local controllable generators
-
- t:
-
- Indices of time period
-
- m:
-
- Index of busses connected to sub-distribution network
-
- l:
-
- Index of line numbers
-
- f:
-
- Index of linearization of power flow equations
-
- pDR:
-
- Active power of demands after using demand response programs
-
- :
-
- Transmitted active power of demands after using demand response programs
-
- :
-
- Curtailed active power of demands after using demand response programs
-
- CostSh:
-
- Cost of load shedding
-
- CostDis:
-
- Cost of exchange between distribution network and upstream network
-
- CostLCG:
-
- Cost of generation of local controllable generators
-
- pSh:
-
- Active power load shedding
Parameters
-
- CapS:
-
- Capacity of energy storage system
-
- ϖS:
-
- Efficiency of energy storage system
-
- :
-
- Maximum transmitted active power of demands after using demand response programs
-
- :
-
- Maximum Curtailed active power of demands after using demand response programs
-
- priSh:
-
- Price for load shedding
-
- priR:
-
- Price for Served load
-
- priDis:
-
- Price for exchange power between distribution network and upstream network
-
- priLCG:
-
- Price for generation of local controllable generators
-
- pWT:
-
- Active power of wind units
-
- pPV:
-
- Active power of PV units
-
- M:
-
- Big amount number
-
- G, B:
-
- Conductance and susceptance of lines
-
- Δθmin/max:
-
- Minimum or maximum amount of piecewise linearization
-
- x, y:
-
- Constant for linearization of power flow equations
-
- PCo:
-
- Active power of Loads
-
- QCo:
-
- Reactive power of Loads
-
- :
-
- Start-up or Shut down price of local controllable generators
-
- pR:
-
- Active power served
-
- :
-
- Buying or selling active power between distribution network and upstream network
-
- pLCG:
-
- Active power generation of local controllable generators
-
- :
-
- Start-up or Shut-down cost of local controllable generators
-
- pL:
-
- Active power of lines
-
- qLCG:
-
- Reactive power generation of local controllable generators
-
- qDis:
-
- Reactive power exchange between distribution network and upstream network
-
- qR:
-
- Reactive power served
-
- qL:
-
- Reactive power of lines
-
- φ:
-
- Difference voltage angle between busses i and j
-
- θ:
-
- Voltage angle of busses
-
- v:
-
- Voltage magnitude of busses
-
- Δθ:
-
- Piecewise linearization variable of voltage angle of lines
-
- uL:
-
- Binary variable of lines
-
- qSh:
-
- Reactive power load shedding
-
- uLCG:
-
- Binary variable for local controllable generators
-
- pDis:
-
- Active power exchange between distribution network and upstream network
Variables
-
- χS:
-
- State of charge percent of energy storage system
-
- :
-
- Active power of energy storage system in charge state
-
- :
-
- Active power of energy storage system in discharge state
-
- :
-
- Binary variables for determine charge or discharge state of energy storage system
-
- qS:
-
- Reactive power of energy storage system
-
- :
-
- Binary variable for determine Buying or selling active power between distribution network
-
- τ:
-
- Robust uncertainty variable
-
- Loss:
-
- Total loss of network
-
- Res:
-
- Resiliency index.
Conflicts of Interest
The authors declare no conflicts of interest.
Funding
There is no funding for this paper.
Open Research
Data Availability Statement
The datasets used and/or analyzed during the current study available from the corresponding author on reasonable request.


