Specification of Sensing Coverage Zones in Two-Dimensional Acoustic Target Localization
Abstract
Target localization (positioning) by the time difference of arrival (TDoA) using previously localized wireless sensor nodes has wide applications. Three-degree sensing coverage cannot calculate accurate spatial-temporal information of the target object in two-dimensional acoustic positioning. In this article, algebraic and geometrical modeling of the two-dimensional acoustic positioning of the target has been reviewed. By using these models, it is proved that the sensing area with three-degree sensing coverage can be separated into two different zones. In the Type 1 zone, which is continuous, the target can be precisely positioned. Type 2 zones, which are three separate areas with three-degree sensing coverage, cannot accurately position the target, and there is a need for four-degree sensing coverage. Then, a relationship is presented to define the exact boundaries of these two zones. In the following, more features of this relationship have been examined. The results of this article can be used to improve the quality of the service metrics of the wireless sensor network, such as the accuracy of acoustic target positioning and tracking, along with reducing the cost of system implementation and increasing the lifetime of the network by optimal placement of wireless sensor nodes.
1. Introduction
Positioning of an object is an essential step in many applications and has been investigated in various references [1]. Tracking a distant moving object requires continuous positioning over time. Global positioning devices are suitable for extracting spatiotemporal information about objects, and they are produced and supplied with different accuracies. In some applications, the goal is to locate an object that does not belong to us; therefore, it is impossible to mount a global positioning device on it. For example, we can mention positioning the enemy’s equipment on the surface. Generally, the opponent moving target object is assumed to be not equipped with a radio transmitter and receiver to communicate with our sensing equipment.
The basic methods used to locate a set of wireless-equipped devices in ad hoc or wireless sensor networks (WSNs) are TDoA and ToA methods [2] and AoA [3]. These methods are not applicable in positioning an opponent’s objects for two main reasons. These reasons are as follows: (1) The purpose of localization in the above cases is only to calculate the location information of an insider wireless node, but in positioning an opponent target, it is necessary to determine at what time the target object was at which place. In the positioning of the enemy’s moving targets, in addition to the unknown parameters of the target object’s location, there is also an unknown time parameter. (2) In the methods mentioned above, the desired wireless nodes cooperate with the devices in the positioning process, but in the positioning of the opponent device, the target object never cooperates with the sensor nodes.
A standard method in the spatial-temporal positioning of the target object is to detect and process the temporal information of the waves that the object emits in the environment. This work is done by assuming devices equipped with suitable sensors to detect the waves emitted by the target object.
In this article, the first assumption is that the localization and time synchronization of the sensor devices have been done accurately by the services of the middleware layer. We can provide these services with different methods and with the guarantee of a specific upper limit of error. The second assumption is that the sensor devices do the required signal processing and can detect the signals sent by the target object. In this article, the waves emitted by the target object are considered sound waves, although the article’s findings are true for any wave spherically propagated in a three-dimensional (3D) environment. The effect of wave reflection on the environment is considered neglected in this article.
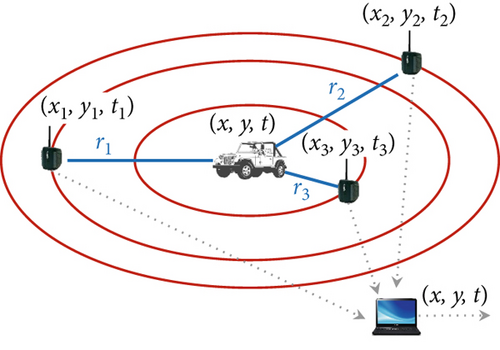
The general belief is that the sensing information of three sensor nodes is enough to locate the target object. The origin of this idea is the following two reasons: (1) due to the presence of three unknowns, having three equations is sufficient for target positioning, and (2) these equations are very similar to the positioning equations of sensor nodes in WSNs. However, this belief is wrong because (1) this is not a system of linear simultaneous equations of the first order, and (2) there is no unknown parameter time in the positioning of sensor nodes.
2. Related Works
Karl and Willig [4] categorized accurate wireless sensor node localization into lateration and angulation. The AoA is the famous angulation method. When the distance between nodes is used for localization, the method is called lateration, and when the angle between nodes is used, the method is called angulation. In lateration, distance measurement is generally prone to inaccuracy, and therefore, multilateration is done by employing more localized sensor nodes for the localization of a sensor node. The most famous multilateration methods are received signal strength indicator (RSSI), ToA, and TDoA.
Mao et al. [5] presented an overview of the measurement techniques in WSN localization. We can consider one-way or roundtrip propagation time measurements in the ToA method. Two nodes that want to find the distance between them must send the signal to each other. ToA requires cooperation between nodes. This method does not apply to opponent target node positioning. By knowing the transmitter power, the signal loss model of the environment, the path loss coefficient, and the received signal power, two wireless sensor nodes can measure the distance between themselves via the power loss model of the wireless transceiver. The RSSI method needs the cooperation of wireless sensor nodes and is not applicable for positioning opponent targets. The TDoA is the only localization method applicable for positioning the opponent target. Using hybrid methods for wireless sensor node localization increases the localization accuracy.
Pirzada et al. [6] reviewed active and passive indoor localization techniques. In their classification, in an active localization system, the target carries the tag or device with an active rule in its localization; otherwise, they know it as a passive localization method. The localization methods based on the ToA, TDoA, AoA, and RSSI are active. Maurelli et al. [7] reviewed the current approaches in passive and active localization techniques for underwater vehicles. They used their meaning for the terms active and passive localization. The mean of passive localization is that vehicles do not have control of the loop. The vehicle estimates its state using the sensing and the command history. Passive techniques estimate position based on past and current sensor information. No decision-making is performed to improve the localization quality. The vehicle is active when the control is in the loop, making specific localization decisions. The involvement of the vehicle in localization is known as active localization. Passive techniques estimate the vehicle’s position based on sensor data, but active techniques produce guidance output to minimize localization uncertainty.
Zhou et al. [8] have proposed a chaotic parallel artificial fish swarm algorithm (CPAFSA) to optimize the 3D target coverage of underwater sensor networks, specifically for water quality monitoring. CPAFSA uses chaotic selection to initialize parameters and integrates the global search capabilities of parallel operators. It also applies elite selection to avoid local optimization and improve the 3D target coverage. The authors have compared their proposed algorithm with genetic algorithm (GA) and particle swarm optimization (PSO) through simulation experiments, demonstrating its excellent performance in achieving underwater 3D target coverage. They considered the same sensing radius for assumed homogeneous sensors, and the sensing area of each sensor is a sphere.
Chang et al. [9] have studied the target localization problem in underwater acoustic wireless sensor networks (UWSNs) by processing the received signal strength (RSS) of the target object. They considered two cases: (1) known target transmit power and (2) unknown target transmit power, and they used a weighted least squares (WLS) estimator for both cases. They derived closed-form expressions of Cramer–Rao lower bounds (CRLBs), and their proposed methods show superior performance in the underwater acoustic environment. Boukerche and Sun [10] have focused on designing, developing, and analyzing algorithms and protocols for underwater acoustic sensor networks (UASNs). They focused on modeling underwater acoustic communication channels, sustainable coverage and target detection, medium access control and time synchronization design, localization algorithms, and routing protocol. They summarized existing system coverage analysis methods, strategies for sensor deployments, and underwater target detection methods. Their primary attention is on analyzing and summarizing existing state-of-the-art methods for UASN operation.
Saeed et al. [11] studied the localization accuracy of underwater optical wireless sensor networks (UOWSNs). They used ToA and AoA measurements and compared localization accuracy with and without anchor node position uncertainty. They analyzed the performance of 3D node localization for UOWSNs and derived a closed-form expression for the CRLB. They compared their proposed method with linear least square (LS) and weighted LLS methods. Their numerical results validated the analytical findings and showed that CRLB outperforms other methods.
Drioli et al. [12] studied the acoustic moving target tracking via a cluster of moving sensor agents to increase target localization accuracy compared to fixed array acoustic sensors. They used the TDoA method for positioning the target object. The dynamics of the target are assumed to be known to estimate its next position. They proposed different strategies for positioning the sensing agents and assessed them via numerical simulations. Their experimental results showed considerable performance improvements in the target tracking compared to conventional fixed-array acoustic localization.
Gola and Arya [13] have discussed UWSN deployment mechanisms and strategies, UWSN applications, benefits, and drawbacks and examined various routing and deployment approaches and their advantages/disadvantages in a survey paper. They introduced UWSN architectures like one-dimensional, 2D, 3D, and four-dimensional and reviewed the different localization techniques for UWSN. Toky et al. [14] reviewed the localization schemes for UASNs. They classified the localization methods of UASN into centralized and distributed localization schemes and then subdivided each group into stationary, mobile, and hybrid subgroups. They also grouped the localization schemes into range-based and range-free techniques. They compared the localization schemes based on accuracy, cost, and success metrics.
Ullah et al. [15] proposed energy-efficient and accurate localization schemes for underwater sensor networks named distance-based and angle-based schemes. Their localization was based on the TDoA and AoA. They concentrated on minimizing mean estimation errors (MEEs) in localization and compared their proposed schemes with other counterpart schemes through simulation. Ferreira et al. [16] studied the positioning of an unsynchronized acoustic target source underwater via a single moving sensor on the sea’s surface. They presented two approaches to localize the target via arrival directions to estimate its horizontal position and arrival times for subsequent refinement of early estimates. They localized the target and estimated uncertainty using the Fisher information matrix (FIM). They applied the proposed method in a real-world search for a lost electric glider at sea.
Luo et al. [17] studied the localization problem in UWSNs using ToA, AoA, TDoA, and RSSI algorithms. Although localization in UWSN is similar to indoor positioning with WSN, underwater’s inherent nature greatly influences the localization results. They reviewed the acoustic communication, network architecture, and routing techniques of UWSNs. They classified positioning algorithms from five different viewpoints: computation algorithm, spatial coverage, range measurement, the state of the nodes, and nodes’ communication models. For each viewpoint, a comparison of current state-of-the-art published research papers is performed in terms of evaluation metrics: coverage, localization time, accuracy, computational complexity, and energy consumption.
Piña-Covarrubias et al. [18] have studied acoustic target positioning in 2D terrestrial environments using probabilistic algorithms for optimal sensor placement and source localization. They used a greedy heuristic for near-optimal placement of sensor nodes. Their results show that increasing the number of sensor nodes decreases the probability of detection errors. They practically performed a case study of the deployment of AudioMoth devices in Tapir Mountain Nature Reserve, Belize. The accuracy of their practical result was acceptable. Azimi-Sadjadi et al. [19] used DoA measurements to track a moving target within clusters of wireless sensor nodes. They studied localization methods, LS, total least squares (TLS), maximum likelihood (ML), extended Kalman filter (EKF), unscented Kalman filter (UKF), and particle filter (PF). They compared the effectiveness and complexity of these methods using synthesized and real acoustic signature data sets. The PF method provides the lowest overall RMSE and best results, and SNR and cluster arrangement affect the algorithms’ performance.
Moreno-Salinas et al. [20] studied range-based underwater target localization using surface sensors. They provided analytical solutions for the optimal placement of two sensor nodes (trackers) for tracking two and three targets. They derived optimal sensor positions by maximizing FIM determinants. They used a kinematic trackers model and derived the FIM for the multitracker, multitarget model. Moreno-Salinas et al. [21] studied the problem of optimal sensor placement on the surface for multiple underwater target positioning. They started with one target, then studied two, and finally, more targets. They used multiobjective optimization to analyze tradeoffs in target localization. They used the determinant of the FIM and minimized it for each target. They showed that the cost function used to compute the optimal sensor positions is concave, and they computed optimal configuration using convex optimization tools in the case of three sensor nodes. It was also shown that three sensor nodes are insufficient in case of more than two targets. They adopted a tradeoff solution and used Pareto optimization to select the adequate configuration of the sensor placement. When the number of targets and sensor nodes increases, the concavity of the cost function is not provable, and a nonconvex optimization method, like the simulated annealing optimization algorithm, is used.
Qin et al. [22] proposed a robust multimodel mobile target localization (RMML) scheme based on UASNs and improved localization accuracy by selecting high-quality reference nodes. They proposed a RMML scheme. The RMML finds the optimal localization reference nodes using the lower bound of the Cramer–Rao. Selected nodes provide the position and time information, and using interacting multiple model UKF, IMM-UKF target localization is performed.
Qu et al. [23] proposed a new 3D positioning algorithm integrating TDoA and Newton’s method. They addressed the problems of fuzzy positioning and low accuracy in the four-station TDoA algorithm. Their proposed algorithm achieves high-precision positioning of TDoA and fast convergence of Newton’s method. They have used the spherical coordinate transformation method to improve fuzzy positioning and inconsistent positioning equations. Melša and Bechová [24] studied the effect of acoustic wave velocity on target localization accuracy. Atmospheric temperature, pressure, and humidity are the main factors influencing the speed of sound. They proposed a mathematical model of acoustic wave speed on the target localization accuracy using the TDoA method. Their results show that sound speed contributes to target localization, but its effect is not considerable.
Cao et al. [25] used distributed acoustic sensing optical fiber (DASF) based on phase-sensitive optical time–domain reflectometry (Φ-OTDR) for near-field target localization in shallow water. They validated the feasibility and accuracy of Φ-OTDR for locating near-field targets through simulations and experiments. They conducted an experiment for applying DASF based on Φ-OTDR in shallow water. Chang et al. [26] addressed the target localization in UAWSN using RSSI and derived the ML criterion for estimating target localization with known and unknown transmit power. They derive CRLBs for both cases. They proposed fast implementation algorithms using generalized trust region subproblem frameworks. Their simulation results show superior performance in underwater environments.
Wu et al. [27] proposed a hybrid method combining the WLS algorithm and firefly algorithm (FA) for target localization using the TDoA method. They declared that combining the WLS algorithm and FA can reduce computation costs and achieve high target localization accuracy. They perform WLS at first and use its result to restrict the FA method’s search region. Compared to other methods, the proposed hybrid-FA method shows lower localization errors. The hybrid-FA method required fewer iterations than the FA method for the same accuracy. The hybrid-FA method outperformed Newton–Raphson (NR), two-step weighted least squares (TSWLS), and GA for TDoA measurement. The hybrid-FA method’s RMSE and mean distance error were lower than other methods.
Kouzoundjian et al. [28] implemented the underwater positioning system in a shallow water environment (30 m) using the TDoA method. They tried to localize the beacon (e.g., submarine) using acoustic signals in water. They used a boat equipped with two hydrophones. They performed signal processing using the Kalman filter to track correlation peaks. Their underwater tests validate the method with a precision of about 1 m. They reported that target localization precision is related to the boat’s trajectory. Their proposed system can be transposed to other apparatus, such as drones or divers.
Jin et al. [29] presented a WLS algorithm with cone tangent plane constraint for target localization using the TDoA method. Their proposed method establishes a space-range frame and sets the reference sensor as the apex. They simulated and verified their proposed algorithm under various conditions. Results showed the accuracy and robustness of their proposed target localization under a poor external environment. The proposed algorithm is always close to the CRLB and guarantees convergence and accuracy.
2D acoustic target positioning modeling has been studied, and the best sensing coverage degree for accurate target localization has been determined [30]. Optimizing sensing area coverage in WSN with greedy and metaheuristic algorithms has been studied extensively [31–33]. Cao et al. [31] used an improved social spider optimization (SSO) algorithm to reduce energy consumption and increase network coverage in WSN. They considered the coverage problem of a 2D area and assumed that the sensing model of sensor nodes is a circle, their sensing radius is heterogeneous, the network is connected, and they used the binary sensing model of nodes. Also, they used an improved version of the SSO algorithm named the chaos social spider optimization (CSSO) algorithm for better placement of sensor nodes. Their paper mainly focuses on the placement optimization of sensor nodes using a binary sensing model of sensor nodes. The binary sensing model aims to support one-degree sensing coverage. One of the famous application areas of one-degree sensing coverage is environment monitoring. Applications like target localization in 2D space need at least 3° of sensing coverage [30].
Osamy et al. [32] published a comprehensive review regarding coverage, deployment, and localization challenges in WSNs and the application of artificial intelligence methods. They reviewed published papers in this regard from 2010 up to 2021. Metaheuristic methods have been used widely in optimization problems in WSN. Trajectory-based schemes and population-based schemes like nature-inspired, physical-inspired, and evolutionary computations have been extensively used for optimization purposes in WSN. The main focus of reviewed papers in this paper is using metaheuristic methods in localizing sensor nodes to support k-degree sensing coverage. Mainly, one-degree sensing coverage support using sensor nodes’ management or placement (deployment) has been studied. The optimization of sensor node placements to support acoustic target localization that needs different sensing coverage degrees for various sensing areas has not been studied.
Tripathi et al. [33] have studied the problem of supporting sensing coverage and connectivity in WSN by focusing on sensing models and coverage classification. Their paper reviewed published papers related to three coverage categories: area, point (target), and barrier coverage. The area coverage, known as blanket coverage, monitors the field of interest (FOI). In all published papers, a fixed sensing coverage degree is studied. We are interested in introducing that in the acoustic target localization application in 2D space; we need the support of three-degree sensing coverage in some areas and four-degree sensing coverage for others according to the position of sensor nodes and their sensing radius. Knowing the specifications of these two types of sensing zones can be used to manage sensor nodes better.
Yu et al. [34] proposed a protocol to support k-degree sensing coverage in WSN. They presented centralized and distributed protocols based on coverage contribution area (CCA) to provide k-degree sensing coverage with low sensor spatial density in a 2D square-shaped area. Their simulation results show the average number of active sensors to support k-degree sensing coverage based on the number of deployed sensors according to various sensing degrees and sensing radius of sensor nodes. Their proposed protocol can be used in applications that need fixed sensing degrees for the whole sensing area. Our interest in the current paper is to show that some applications, like target localization, need multiple sensing-coverage degrees, and knowing this permits us to provide better target localization accuracy with a decreasing number of required sensor nodes.
3. Problem Statement
3.1. 3D Geometric Interpretation of Target Positioning Equations
Let us assume the time as the third dimension and draw the time axis vertically and upward. Then, the propagation of the wave during time in the 2D environment can be represented in the form of a vertical cone, as shown in Figure 2. The geometrical interpretation of target positioning is to calculate the coordinates of the wave propagation cone’s vertex, knowing the coordinates of three distinct points on its upper fabric, which is represented by the coordinates (x, y, t) in the system of Equation (1) and Figure 1.
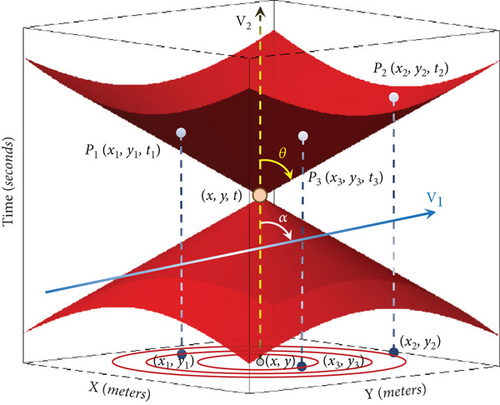
The sensor nodes can only sense the sound waves after the target object generates that wave. Therefore, the information sensed by the three sensor nodes is only related to the upper fabric of the wave propagation cone of the target object. The opening angle of this wave propagation cone in Figure 2 is equal to 2θ, where tan(θ) = v and parameter v represent the wave propagation speed in the environment [30]. For acoustic sounds, we consider v = 344 m/s.
In Figures 1 and 2, the point (x, y, t) is the unknown spatial-temporal coordinates of the target object when it emits a wave, and this record represents that the object emitted this wave at time t and the position (x, y). Sensor nodes Pi, i = {1, 2, 3} are distributed and positioned in the 2D environment around the target object, and their coordinates are displayed as (xi, yi) and the target object is located in its sensing radius. As shown in Figure 2, we can show the position of the sensor node in the 2D environment as a line perpendicular to the environment’s surface and parallel to the axis of the wave propagation cone of the target object over time. The intersection of this line with the upper fabric of the wave propagation cone determines the time when this sensor node has sensed the waves of the target object. Each sensor node will sense the wave of the target object after some time delay that is directly proportional to the distance between the sensor node and the target object. It has been proven that the three-degree sensing coverage can only accurately position the target object in some cases. The geometric interpretation of solving the target positioning equations is to calculate the 3D coordinates of the point (x, y, t) as the apex of the wave propagation cone of the target body, knowing the coordinates of the three points on its upper fabric.
3.2. The Interpretation of the Geometric Dual of the System of Target Positioning Equations
We can interpret the system of equations from another point of view in the way that each of the equations of this system is the equation of a vertical, rounded cone with a specific and identical opening angle whose vertex coordinates are points Pi(xi, yi, ti). The reported information of each sensor node is a point in 3D space, which can be considered the vertex coordinates of a sensory cone. In target localization, we look for a common point on all these sensory cones. The three sensor nodes express three hypothetical sensory cones that intersect each other at several different points, only one of which is the main spatiotemporal coordinate of the target object.
Logically, we are interested in calculating the point of intersection of the lower nappes of the sensory cones with each other. Equation (1) is quadratic, so in doing the calculations, we will also face answers from the upper fabrics of the sensory cones. In the dual problem, intersection points of the sensory cones’ upper fabrics are not our concern, and these answers are considered redundant because it is impossible to feel the waves related to an event that has not yet occurred.
4. Materials and Methods
This paper presents an abstract mathematical model of acoustic target positioning. A combination of algebraic and geometric modeling is used for verification via mathematical proofs regarding lemmas and theorems. This paper presents the findings of a theoretical study that has been verified via mathematical proofs and evaluated by computer simulation. All figures are output results of computer simulation using the MATLAB software.
4.1. The Condition of Recognizing the Correct Answer
Three different cases may happen based on the result of (4). (1) If the angle between the axis of the pencil and the axis of the wave propagation cone is less than the angle of the cone opening angle, then the pencil axis cuts both the upper fabric and the lower fabric of the wave propagation cone, and we have two answers, one related to the past and the other related to the future. We can easily remove the invalid response by simply checking the calculated response time and the sensed time reported by the sensor nodes. The time calculated as the time of generating the wave by the target should not be after the time of sensing the wave by the sensor nodes. (2) If the angle between the pencil axis and the wave propagation cone is greater than the angle of the cone opening, then the pencil axis cuts the bottom fabric of the wave propagation cone at two different points. In this case, we can not easily recognize the invalid dual answer. (3) If this angle is equal to the opening angle of the wave propagation cone, in this case, (1) the axis of the pencil cuts the bottom of the wave propagation cone at one point, and we have only one correct answer, or (2) the axis of the pencil be tangent to the top of the cone, which in this case we have infinite answers, and we do not report any answers. Table 1 summarizes the results of the three sensors’ acoustic 2D target positioning in different conditions [30].
| Case no. | Condition | The number of obtained answers and the validity of them |
|---|---|---|
| 1 | |tan(α)| < v | A valid answer and an invalid answer |
| 2 | |tan(α)| = v | A valid answer or infinite answers |
| 3 | |tan(α)| > v | Two valid answers |
However, the four-degree sensing coverage enables us to always position the target object accurately in the 2D environment. It is also possible to determine whether the system can accurately calculate the target object’s position from the sensory information values of only the three sensor nodes [30]. Providing the four-degree sensing coverage to ensure accurate positioning of the target in all points of a surveillance area requires increasing the density of wireless sensor nodes in the environment, and this significantly increases the financial cost of monitoring the environment and shortens the network’s lifetime.
This article proves that the possibility of accurately positioning the target depends on the position of the target object and the relative position of the three sensor nodes. Then, a formula for determining the sensing zones (areas) around three sensor nodes is presented for the first time. Then, it is possible to determine in which zone around the sensor nodes, with the three-degree sensing coverage, we can accurately position the target object and in which zones it is not possible. The results of this research can be used to increase the quality of the environmental monitoring service, reduce the cost of implementation, and increase the network’s lifetime.
5. Results
5.1. Specification of Sensing Zones in Three-Degree Sensing Coverage
Figure 3 shows the different sensing zones from the positioning viewpoint of the target object for two various examples accurately. The borders of these zones are determined using (18). Figure 3 is drawn via discretization of the sensing area. Figure 3a,b contains 30,000 2D sample points with uniform distribution. The sensing zones where we can accurately position the target object with three-degree sensing (determined area) are shown by circle-shaped points with a red border color and yellow forecolor. The sensing zones where we can not accurately position the target object with three-degree sensing (nondetermined area) are shown by circle-shaped points with a blue border color and green forecolor using MATLAB R2018b software.
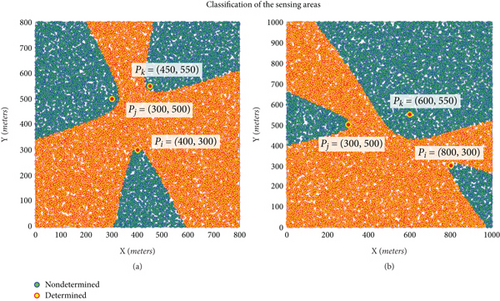
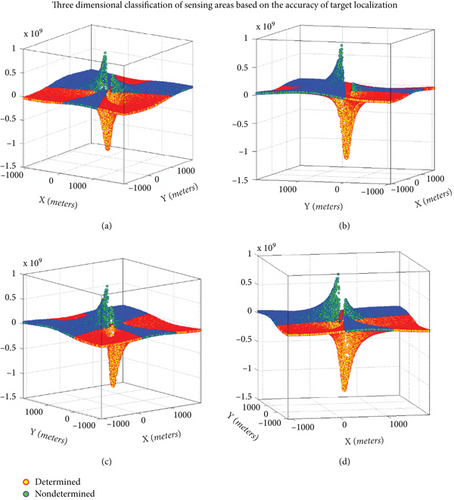
Figure 4 shows sensory areas of Figure 3a in three-dimensional form from different viewpoints generated using 50,000 sample points with uniform distribution in X and Y coordinates. In Figures 3 and 4, the sensing zones in which we can accurately position the target object with three-degree sensing are shown in light color (yellow with red border color) in the form of a continuous zone and in the dark zone (green with blue border color), which are separate areas, and precise positioning of the target object is impossible. In Figure 4, the determined and nondetermined points may appear with their border color of construction circle points. So, the determined points may appear red, and the nondetermined points may appear blue. Dark-colored (green/blue) zones require four-degree sensing coverage for accurate target positioning. A light-colored (yellow/red) zone can position the target object with three-degree sensing coverage.
5.2. Analysis of the Characteristic Equation
Equation (20) is called the general form of the positioning characteristic equation, and from now on, the above equation is referred to as the characteristic equation. If C = 0, then the above equation is in standard form.
Lemma 1. The parameter C of the characteristic equation is based on the following relation:
Proof 1. Consider the following two vectors.
Their inner product is calculated according to the following equation:
From the definition of coefficient C in (20) and the above relation, (21) is concluded.
Lemma 2. The parameter F of (20) is based on the following relationship:
Proof 2. Consider the points Pi, Pj, Pk which are the locations of the sensors in the environment in 3D space with coordinate t = 0. In this case, we have the following vectors:
According to the definition of the outer product of two vectors and the definition of the length of the vector, we have the following relationship:
From the definition of coefficient F in (20) and the above relation, we can conclude (22).
According to the definition of external multiplication, we have the following relation:
It indicates that the parameter F in (20) is equal to the negative of the square of the parallelogram area formed by the vertical image of three points Pi, Pj, Pk in 2D space.
Theorem 1. The characteristic equation represents the equation of an ellipse.
If J > 0, Δ ≠ 0, Δ/I < 0, then the conical section is an ellipse [35]. The opposite of (23) is true when all the coefficients of A, B, and C are equal to zero. According to the definition of coefficient A in (20), if dki = 0, this coefficient is equal to zero. According to the definition of dki in (15), this value is equal to zero if the points Pi and Pk coincide. Then, the vector is equal to zero, and according to Lemma 1, the coefficient C is also equal to zero.
The coefficient B in Equation (20) is equal to zero if the points Pi and Pj coincide. Then, the vector is equal to zero, and according to Lemma 1, the coefficient C is also equal to zero. Therefore, the relationship A2 + B2 + C2 = 0 is established if only three sensor nodes are located at the same point. Considering the three sensors are physically separate and cannot reside in the same place, the condition in (23) is always satisfied.
The result of the above expression is always greater than or equal to zero. According to the definition of external multiplication, the above expression is equal to zero if two vectors and be perpendicular to each other. Assuming a random distribution of nodes in the environment, the probability that the angle between these vectors is perpendicular is very low and close to zero, and therefore, the probability that the result of the above expression is equal to zero is close to zero. Consequently, it can be assumed that the criterion J of an expression is always positive.
The result of the above expression is always less than or equal to zero. According to the definition of external multiplication, the result of the expression F is equal to zero if the angle between two vectors equals 0° or 180°. This state occurs if the three sensors i, j, and k are placed on a straight line. According to the assumption of random distribution of nodes in a 2D space, the probability that three sensor nodes are located on a straight line is very low, and therefore, the probability that the term F is equal to zero is very low and close to zero. According to the above arguments, the result of the term Δ in (28) is negative and nonzero.
The above expression is always positive, considering three sensors cannot be located in the same place. Therefore, the expression Δ/I of an expression is always negative. Therefore, the characteristic equation is always J > 0, Δ ≠ 0, Δ/I < 0, which means that the characteristic equation is the equation of an ellipse.
From now on, we call the characteristic equation the characteristic ellipse.
5.3. Parametric Shape of the Characteristic Ellipse
In this section, we examine some of the characteristics of the characteristic ellipse. These features can be used in the parametric expression of the characteristic ellipse.
Theorem 2. The center of the characteristic ellipse (20) always coincides with the coordinate origin.
Proof 3. It is necessary to explain that the definition of new independent variables x and y are according to (17), and this theorem is based on the new coordinate system. The center of a conical cross-section whose general form of the equation is according to (19) is obtained by solving the following system of equations.
The result is a point with the following coordinates [35]:
Considering that the values of coefficients D and E in (20) are equal to zero, by placing them in the above equation, the coordinates of the center of the ellipse are the starting point of the coordinates. In other words, if the coefficients of the terms x and y in the general form of the equation of conic sections in (19) are equal to zero, then the center of the conic section coincides with the center of the coordinate origin. Therefore, (20) is the equation of an ellipse whose center coincides with the coordinate origin.
According to Lemmas 1 and 2 and Theorem 1, the characteristic equation represents the equation of an ellipse in the following simplified form:
If C = 0, then the above equation is in standard form, and the main diameters of the ellipse are parallel to the coordinate axes. If the coefficient C ≠ 0 in the above equation, then the elliptic equation is nonstandard.
Theorem 3. The angle of the characteristic ellipse’s semimajor and semiminor axes with the X axis of the coordinate system is according to the following equation:
Proof 4. If the conic section is nonstandard, it can be converted into a standard shape by using the conversion of the following variables [35].
The above transformation is the inverse rotation around the coordinate origin. We apply this transformation on (20) as follows:
The above relationship is simplified as follows:
Now we have to calculate the value of q so that the coefficient of the term uv in the above equation is equal to zero in the form of the following equation:
The roots of this quadratic equation are according to (34). Therefore, according to the assumption, the coefficient of the expression uv in (35) is equal to zero, and we can convert the equation into the standard form. The amount of these cycles represents the angle of the main diameters of the ellipse.
Theorem 4. The length of the semimajor and semiminor axes of the characteristic ellipse is according to the following relations:
Proof 5. According to Theorem 2, we know that the center of the ellipse of the characteristic equation corresponds to the origin of the coordinates, and using Theorem 3, we can write the equation of the lines that represent the semimajor and semiminor axes of the ellipse. The system of simultaneous equations of an ellipse and a diameter is as follows:
If we insert the value of the variable y from the equation of the line into the equation of the ellipse, we have:
After simplifying, we reach the following equation:
We consider one of the roots of this equation and get its y value using the line equation. The coordinates of one of these points are as follows:
The distance from this point to the origin of the coordinates (the center of the ellipse) represents the length of the semimajor/semiminor axis of the ellipse. The length of this line is calculated according to the following equation:
The length of this ellipse diameter is called a1 for the diameter whose angle coefficient is q1 and by inserting the value of q1 from (34) in the above equation and simplifying the expression depending on whether the term C is positive or negative, we have:
The negative term should be used if C is a negative value. In a similar way, the length of the other radius, which is on a line with the angle coefficient q2, is according to the following equation:
□
The general parametric equation of the ellipse is as follows:
According to Theorem 2, the coordinates of the center of the characteristic ellipse correspond to the origin of the coordinates, and the parameter φ can be calculated based on Theorem 3. The following trigonometric relations make it possible to use the results of Theorem 3 in the parametric equation of the ellipse without the need to calculate the angle of the main diameter of the ellipse.
The parameter a of the semimajor axis and the parameter b of the semiminor axis can be calculated using the results of Theorem 4.
6. Discussion
6.1. Example of the Characteristic Ellipse
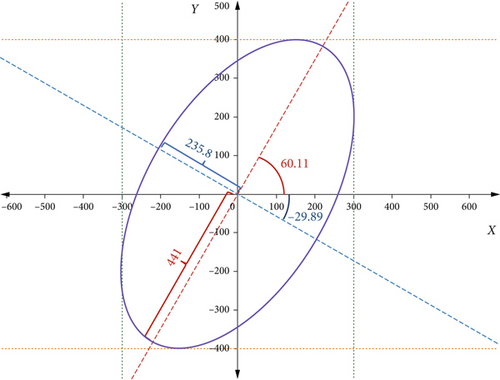
6.2. Analysis of the Main Equation
In the previous part, we stated that X and Y parameters are the coordinates of the ellipse perimeter of the characteristic equation. The center of this ellipse is always the coordinates’ origin, so each parameter’s change range is a symmetrical interval around the origin of the coordinates. Therefore, the values of each of the above parameters can be positive or negative.
Each of the equations in (41) represents the equation of a hyperbola. In the first hyperbolic equation, the points Pi(xi, yi) and Pj(xj, yj), and in the second hyperbolic equation, the points Pi(xi, yi) and Pk(xk, yk) are the coordinates of the centers of the hyperbola. In the first equation of the set of simultaneous equations in (41), when the parameter X is positive, we face a part of the hyperbola that is inclined toward the point Pi(xi, yi), and when the parameter X is negative, we face a part of the hyperbola is inclined toward the point Pj(xj, yj). For different X and Y parameter values, these hyperbolas intersect at certain points, the borders of the different sensing zones in question, as shown in Figures 3 and 4.
However, the parameters X and Y are not independent of each other, and according to proven lemmas and theorems, they are the boundary points of the characteristic equation, which is in the form of an ellipse. For more clarification, let us study the example further.
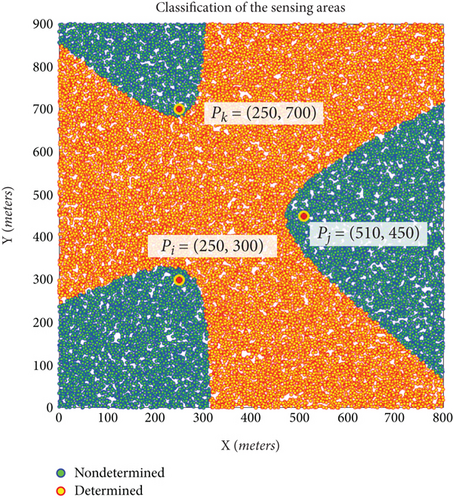
By changing the independent parameter θ, the values of x and y parameters are created by calculating the intersection of the discussed hyperbolas. Figure 7 shows the hyperbolas created by changing the independent parameter θ in the 69°–129° range. The crossing points of these hyperbolas by changing the independent parameter θ from 69° to 129° show the formation of the parabolic region in the right side of Figure 6.
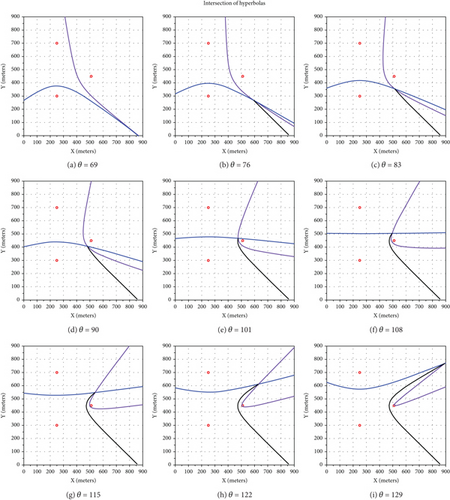
6.3. Application and Proposed Evaluation Method
This paper introduced two types of sensing zones in the common sensing areas of three sensor nodes, determined and nondetermined zones, in 2D acoustic target localization. The specifications of these two zones have been characterized. When the target object is in a determined area of at least three sensor nodes, it can be localized accurately. Otherwise, the target object is not in the determined area of these three sensing nodes. It means that the target object is in a nondetermined area, and we must support four degrees of sensing coverage for accurate localization of the target object in this area. Otherwise, target localization equations give two answers: feasible and infeasible (Case 3 of Table 1). The probability of choosing an accurate target position by random selection is near 0.5 [30].
We can use metaheuristic optimization methods to maximize the accurately localizable points ratio by better placement of sensor nodes and using the least number of them for optimization purposes.
7. Conclusions
This article focuses on the application and middleware layer of WSN, and with a review of the principles of 2D acoustic target positioning using the delay of the sound waves emitted in the environment (the TDoA method), it was stated that the three-degree sensing coverage can only position the target accurately in some cases. However, with the four-degree sensing coverage, the spatiotemporal information of the target object can always be determined precisely. However, the cost of providing four-degree sensing coverage is high. This article showed that the sensing area around the three sensor nodes can be separated into two zones.
A continuous zone (region) shown in light color (red/yellow) in Figures 3 and 4 is an area that can accurately position the target object with three-degree sensing coverage. The second zone, made up of three separate parts (areas) and shown with a darker color (blue/green) in these figures, cannot accurately locate the target object with the three-degree sensing coverage. In this article, a constitutive equation is presented and proved to be able to define these zone boundaries. We tried to show more features of this characteristic equation, presenting several lemmas and theorems and proving them.
Only simple support of three-degree sensing coverage does not guarantee accurate acoustic target positioning in a 2D field, and four-degree sensing coverage is not required in all areas. Support of four-degree sensing coverage increases implementation cost by using more wireless sensor nodes, or we must wake up more sensor nodes instead of setting them in sleep mode (for more power saving) and decreases the network’s lifetime. Three-degree sensing coverage decreases acoustic target positioning accuracy.
Therefore, four application and middleware layer quality of experience (QoE) metrics (network’s implementation cost, network’s lifetime, sensing coverage degree, and target positioning accuracy) are in tradeoff with each other. The results of this article permit us to determine the location of n wireless sensor nodes in the environment so that, in addition to using the least number of sensor nodes, the entire sensing area can be covered with minimal required sensing coverage degree, leading to accurate target positioning.
In this research, the effective sensing radius of the sensors is not stated, and this radius depends on the type of sensor. The results of this research can be extended to the 3D acoustic positioning of the target. In future work, the problem of locating wireless sensor nodes in an environment to optimize the acoustic target positioning accuracy criterion, reduce the cost, and increase the network lifetime using metaheuristic optimization algorithms is considered.
Conflicts of Interest
The authors declare no conflicts of interest.
Author Contributions
Conceptualization: M.G.S.A.-k. and S.P. Methodology: S.P. and M.G.S.A.-k. Software: S.P. Validation: S.P., M.G.S.A.-k., and M.A. Formal analysis: M.G.S.A.-k. and S.P. Investigation: M.G.S.A.-k. Resources: M.G.S.A.-k. Writing—original draft preparation: M.G.S.A.-k. and S.P. Writing—review and editing: M.A. Visualization: M.G.S.A.-k. and S.P. Supervision: S.P. Project administration: S.P. and M.G.S.A.-k. All authors have read and agreed to the published version of the manuscript.
Funding
No funding was received from any governmental, commercial, or nonprofit organizations for this research.
Open Research
Data Availability Statement
This paper does not have and use any raw data. The codes and models supporting this study’s findings are available on request from the corresponding author upon reasonable request.


