LIFE-CARE: IoT–Cloud-Enabled Smart Heart Disease Prediction System for Smart Healthcare Environment Using Deep Learning
Abstract
Heart disease prediction is a challenging task which assists medical authorities to make timely and precise decisions about patient health. Predictive analysis in smart healthcare can enable the reactive healthcare to be proactive with assistance of machine learning (ML) and artificial intelligence (AI) technologies. Existing works often lack complexity and heterogeneity as they trained similar inputs for their models and unaware of varied input data. This research proposed a fully automated heart disease prediction framework from the real-time data named LIFE-CARE that enables precise and timely predictive analysis. The propounded research utilized medical IoT sensors and electronic health records (EHRs) for acquiring the patient heart status and forwarded them to the multicloud server via gateway and distributed edge server (DES) for heart disease prediction. In between that, we preprocess the raw medical data in terms of data filtering and normalization at the DES. For heart disease prediction, we utilize collaborative transfer learning–enabled separable transformer (CTL-ST) which processes the varied input by adopting domain adaptation and knowledge distillation techniques thereby achieving better prediction results. At that time of implementation, the proposed LIFE-CARE model achieves performance results of accuracy of 98.72%, precision of 98.25%, recall of 98.79%, specificity of 98.55%, and F-score of 98.78% which is better than the state-of-the-art heart disease prediction models.
1. Introduction
The Internet of Things (IoT) is a major catalyst for advancements in information and communication technology, steering various industries toward greater automation and decentralized intelligence. The IoT continuously evolves and influences all aspects of our lives, much like a dynamic entity [1]. Although they have developed independently, cloud computing and IoT features are mutually supportive and enhance each other. In recent years, these two technologies have converged to form what is now known as the cloud–IoT paradigm. This convergence opens up vast opportunities for developing innovative services and applications [2]. Embedded systems based on IoT are evolving into interconnected smart devices equipped with sensors. The primary issue with smart devices was their inadequate storage capacity and processing power, which cloud computing has addressed by offering extensive processing and storage capabilities [3]. To enhance smart healthcare systems, integrating IoT sensors with cloud computing is essential. In smart healthcare systems, real-time patient monitoring is a key feature. An intelligent framework that leverages deep learning (DL) and artificial intelligence (AI) is crucial for delivering high-quality, cost-effective healthcare quickly [4]. Smart healthcare systems are increasingly utilizing affordable and advanced IoT sensors. These include wearable devices that track various health metrics such as blood pressure (BP), heart rate, respiration rate, electroencephalogram (EEG), electrocardiogram (ECG), electromyogram (EMG), blood sugar levels, and cholesterol levels [5]. The real-time data generated by IoT sensors is intricate and demands effective handling methods, including big data analytics, cloud computing, AI, and DL. Figure 1 shows types of heart diseases (HDs).
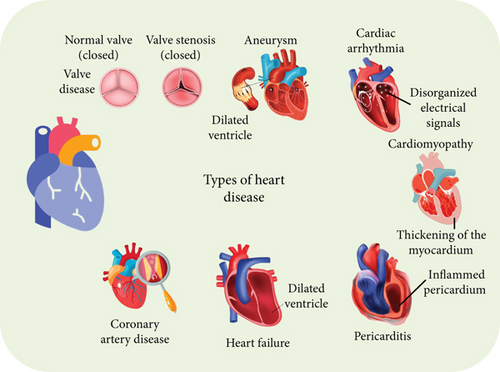
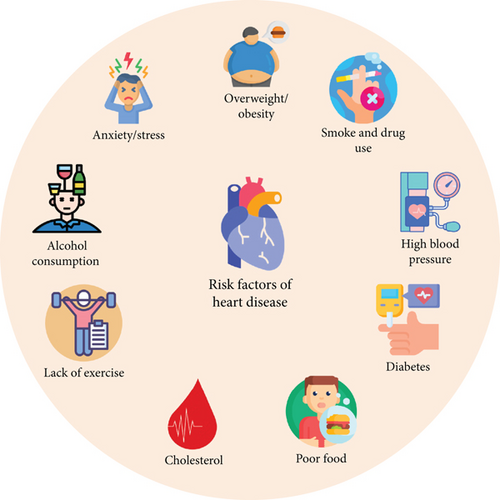
A significant challenge in smart healthcare systems, where numerous IoT sensors generate vast amounts of data, is the development of a framework that delivers cost-effective and efficient solutions for all stakeholders [6]. Advances in AI have significantly enhanced its effectiveness in healthcare. AI has simplified the diagnosis of symptoms, enabling earlier detection of diseases [7]. DL models identify diseases by analyzing patterns in data from previous patients. Additionally, these models assist healthcare professionals in identifying common causes of diseases and can help patients adjust their habits to prevent illness [8]. A significant amount of data related to heart patients is generated and stored in public databases. Therefore, there is a need to create an innovative solution that combines cloud computing and DL to accurately predict HDs. Analytics involves both quantitative and qualitative assessments of relevant data to support effective decision-making, while predictive analytics uses advanced methods to forecast future events based on existing data [9–12]. Figure 2 shows the risk factors involved in HD.
- 1.
IoT-enabled data integration and preprocessing: LIFE-CARE adeptly combines information from a range of medical IoT devices, such as sensors for BP, heart rate, respiration rate, EEG, ECG, EMG, blood sugar, and cholesterol levels. The collected data undergoes preprocessing through a Gw, which includes filtering and normalization steps. This thorough preprocessing ensures that the data sent to the MCS is accurate and uniform, thereby improving the dependability of the predictive analyses that follow.
- 2.
Collaborative transfer learning with separable transformer: The model features a CTL-ST, which uses collaborative knowledge distillation to perpetually train and enhance predictive models. This method facilitates the integration of insights from various models, resulting in more reliable and precise predictions. Continuous updates and refinements ensure a dynamic and adaptable system that delivers timely and accurate HD forecasts.
- 3.
Multicloud infrastructure for enhanced prediction: LIFE-CARE employs a MCS framework to process and analyze normalized data from multiple patients. This setup enables scalable and adaptable data handling and model training. By connecting the power of a multicloud environment, the model gains access to increased computational resources and collaborative learning opportunities, leading to more precise and dependable HD predictions.
2. Literature Survey
In this section, the researchers have used different methods to develop an IoT-based HD prediction system. The existing heterogeneity problem faces the most significant challenge, and this issue arises from the various range of data source and format, such as heterogenous sensor data, different patient demographics, and various healthcare standards, which are essential for integrating to form a cohesive predictive model. From the below related works, we have analyzed the existing problems in the IoT-based HD prediction system using wearable devices. Here, Nancy et al. [21] introduced a cutting-edge smart healthcare monitoring system that merges IoT technology with cloud computing to forecast HD using DL methodologies. The system captures real-time data from wearable sensors and IoT devices to monitor cardiovascular health continuously. Umar et al. [22] presented an IoT-based smart monitoring system tailored for individuals with acute heart failure. By employing a network of IoT-enabled medical devices, the system collects and transmits essential health metrics such as heart rate, BP, and oxygen saturation to a central monitoring unit. Raju et al. [23] have proposed a smart HD prediction system that integrates IoT technology with fog computing and utilizes a cascaded DL approach. The system uses edge computing (EC) resources alongside cloud analytics to process and interpret heart health data from IoT devices efficiently. Islam et al. [24] innovated a DL-based IoT system designed for remote health monitoring and early detection of potential health issues in real time. The system utilizes IoT sensors to gather continuous physiological data from patients, which is then analyzed using advanced DL algorithms. This real-time analysis allows for early identification of health problems, enabling timely medical interventions and improving overall patient care. The author in [25] presented a Health Cloud which is an advanced system for tracking the health status of heart patients through the integration of ML and cloud computing technologies. The system aggregates health data from various sources and processes it using sophisticated ML techniques in the cloud. Zhang et al. [26] created a novel approach that combines physics-based modeling with DL techniques for the functional assessment of cardiovascular diseases (CVDs) within an IoT-enabled smart health system. By integrating domain-specific physical principles with advanced DL algorithms, the system enhances the accuracy and reliability of cardiovascular assessments. Yuan et al. [27] have introduced a robust AI-based model designed for predicting HD within the framework of the Internet of Medical Things (IoMT). The model supports both binary and multiclass classification to identify various types of heart conditions. By employing stable and scalable AI techniques, the system ensures accurate predictions and effective risk stratification, thereby enhancing early detection and management of HD. Islam et al. [28] innovated a system named as Predicts that combines IoT technology with ML to assess and predict risk levels of CVD. The system collects health data from IoT-enabled devices and applies ML algorithms to analyze this information and estimate individual risk levels. Absar et al.’s [29] research evaluates the effectiveness of a ML-enhanced smart system for predicting HD. Furthermore, the system integrates various ML techniques to analyze health data and generate predictive insights. Mishra et al. [30] proposed an IoT-enabled system for HD prediction that utilizes a three-layer DL model combined with a metaheuristic optimization approach. Moreover, the system analyzes ECG data collected from IoT devices to detect signs of HD with high precision. Dami et al. [31] explored a DL-based methodology for predicting cardiovascular events within the framework of the IoT. By applying IoT devices to collect extensive health data, the proposed approach employs advanced DL algorithms to analyze and predict potential cardiovascular issues. Reddy et al. [32] present a smart HD monitoring system that integrates IoT technology with a metaheuristic-based fuzzy-LSTM (long short-term memory) model. Additionally, the system utilizes IoT devices to gather real-time health data, which is then processed by the fuzzy-LSTM model optimized through metaheuristic techniques. This approach is aimed at enhancing the accuracy and reliability of HD monitoring and prediction, offering a sophisticated tool for proactive cardiovascular health management. Gupta et al. [33] have presented DEEP-CARDIO as a recommendation system designed for predicting CVD through an IoT network. The system collects and analyzes health data from IoT-enabled devices using DL algorithms to provide accurate predictions and recommendations for cardiovascular health. By integrating real-time data processing with predictive analytics, DEEP-CARDIO is aimed at facilitating early intervention and personalized treatment strategies for HD. Nancy et al. [34] have introduces a fog-based smart system for predicting CVD, utilizing a modified gated recurrent unit (GRU) network. The system uses fog computing to process data from IoT devices closer to the edge, reducing latency and improving response times. The modified GRU model enhances predictive accuracy by effectively capturing temporal dependencies in cardiovascular data, aimed at supporting timely and informed decision-making in cardiovascular care. Iqbal et al. [35] developed a real-time big data analytics model for healthcare, focusing on improving the quality of service (QoS) in cardiac disease prediction using IoT devices. The model processes vast amounts of health data generated by IoT sensors to enhance prediction accuracy and operational efficiency. By integrating advanced analytics with real-time data processing, the system is aimed at optimizing cardiac disease prediction and supporting high-quality healthcare delivery. Furthermore, the author in paper [36] innovated FETCH which is an advanced system that integrates DL with fog computing and IoT technology for healthcare monitoring and diagnosis. The system uses fog computing to process data closer to the source, reducing latency and enhancing real-time analysis. Roy et al. [37] have presented Conv-random forest–based IoT, a DL model that integrates convolutional neural networks (CNNs) with random forest algorithms for the classification and analysis of valvular HDs. The model utilizes IoT devices to collect detailed cardiovascular data, which is processed through a combined CNN and random forest framework. The author in [38] has introduced an IoT-based remote monitoring system designed specifically for tracking patients with heart failure. The system employs a network of IoT devices to continuously collect and transmit vital health metrics, such as heart rate and BP, to a central monitoring platform. Zhuhai et al. [39] developed a wearable ECG monitor that utilizes DL techniques for real-time detection of CVD. Moreover, the wearable device continuously records ECG signals, which are then analyzed using advanced DL algorithms to identify potential cardiovascular issues. Sam et al. [40] have presented an edge-based device for HD prediction that uses IoT technology. The device processes health data from IoT sensors directly at the edge of the network, minimizing latency and enhancing prediction accuracy.
As medical datasets in the healthcare sector continue to expand in size and complexity, there is an increasing need for automated systems powered by DL technologies to help medical professionals make accurate and efficient decisions. Despite this progress, a significant challenge for DL methods is maintaining accuracy when managing extensive datasets. To solve this issue, LIFE-CARE handles the heterogeneity of data sources by providing a flexible edge-based and multicloud architecture. This system effectively manages data variability and ensures that predictions remain accurate and relevant across different healthcare settings and device types. Overall, LIFE-CARE represents a significant advancement in creating a robust, adaptive, and collaborative HD prediction system. Moreover, the model employs a CTL-ST, which addresses the need for using knowledge from multiple models to improve predictive performance. Finally, this collaborative approach allows for continuous model updates and improvements through knowledge distillation, ensuring the model evolves with new data and insights. Table 1 compares the existing and proposed research gaps.
| Ref. no. | Objective | Method/algorithm | Limitation |
|---|---|---|---|
| [21] | To predict HD using cloud-connected IoT devices and DL | DL | Dependence on cloud connectivity and data privacy concerns |
| [22] | To monitor acute heart failure patients through IoT devices | Real-time data collection and analysis using IoT sensors | Potential for data loss due to connectivity issues |
| [23] | To predict cardiovascular disease (CVD) using IoT by incorporating ML with DL | Incorporating ML with DL | That model lacks with interoperability issues |
| [24] | To early detect health issues using DL and IoT for remote monitoring | DL to analyze real-time data from IoT devices | High computational resource requirements and network dependency |
| [25] | To monitor heart patient health via ML and cloud computing | ML algorithms process health data in the cloud | Data privacy and security concerns with cloud storage |
| [26] | To assess cardiovascular function using a physics-guided DL approach | Integrates physical models with DL for data analysis | Complexity of integrating physical models with DL |
| [27] | To predict HD using AI for both binary and multiple class classification | AI models for classification of HD types in IoMT environments | Model stability and accuracy can vary across different IoMT setups |
| [28] | To predict cardiovascular disease risk levels using IoT and ML | ML algorithms analyze IoT sensor data to assess risk levels | Dependence on accurate sensor data and potential false positives |
| [29] | To evaluate effectiveness of a ML system in HD prediction | ML algorithms analyze patient data for predictive accuracy | Efficacy may vary based on data quality and model tuning |
| [30] | To predict HD using ECG data with a three-layer DL and metaheuristic approach | Three-layer DL model combined with metaheuristic optimization | Computational complexity and potential overfitting |
| [31] | To predict cardiovascular events using DL with IoT data | DL | Data integration challenges and model generalization issues |
| [32] | To monitor HD using a metaheuristic-based fuzzy-LSTM model | Combines fuzzy logic with LSTM networks optimized by metaheuristic methods | Complexity of model tuning and potential for high computational costs |
| [33] | To recommend CVD interventions using IoT data and prediction models | IoT network data analyzed with DL for prediction and recommendations | Reliance on IoT network stability and recommendation accuracy |
| [34] | To predict cardiovascular disease using a fog-based system with modified gated recurrent unit (GRU) | Modified GRU processes data at the fog layer | Requires efficient fog computing infrastructure and model optimization |
| [35] | To improve quality of service in cardiac disease prediction using real-time big data analytics with IoT | Big data analytics model processes real-time data from IoT devices | Handling large volumes of data and ensuring real-time performance |
| [36] | To integrate fog computing and IoT for healthcare monitoring and diagnosis using DL | Mask-guided attention U-Net | Integration complexity and potential for fog computing resource constraints |
| [37] | To classify and analyze valvular HDs using CNN and random forest within an IoT framework | CNN with random forest | Combining models may increase computational requirements and complexity |
| [38] | To monitor heart failure patients remotely using IoT devices | Remote monitoring of patient health through IoT sensors | Data accuracy and device reliability issues |
| [39] | To detect cardiovascular diseases in real time using a wearable ECG monitor and DL | Wearable ECG device combined with DL for real-time detection | Device comfort and data accuracy concerns |
| [40] | To predict HD using an edge computing device within an IoT framework | Edge computing device processes IoT data for HD prediction | Edge device processing power and data synchronization challenges |
3. Preliminaries
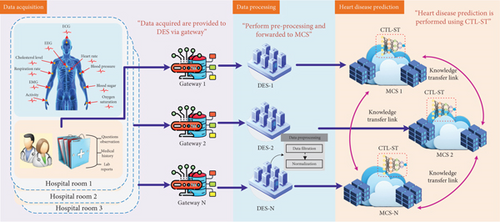
In fault analysis application of unsupervised domain adaptation, diverse source of training data with known labels, along with the unlabeled testing data, can be gathered from various equipment operating conditions. Precisely, the source domain data yso from are drawn from different but related distributions , where represents the dataset for the th source domain dataset and indicates the number of samples in the source domain. The label corresponds to the health status, with ℵ denoting the total number of categories in the health status. The domain of the target dataset is drawn from the distributed target , where denotes the number of samples in the target domain, . Unlike the source domains, which have known status labels, the target domain lacks these labels but shares the same label space, a scenario referred to as closed-set domain adaptation. The goal of cross-domain fault diagnosis is to develop an intelligent network model that can learn domain-invariant and distinguishable features by minimizing the discrepancy between distributions. This approach is aimed at reducing the risk of incorrect predictions on the target domain, with unsupervised domain adaptation. In HD prediction, IoT devices such as wearable heart monitors and health trackers are instrumental in gathering continuous health data. Integrating these devices with transfer learning techniques can significantly enhance predictive models for CVD conditions. Transfer learning involves adapting a model that has been trained on extensive datasets to a specific, smaller dataset related to heart health. This method is especially useful in medical applications where acquiring large amounts of labeled data can be challenging. For example, a model trained on general health information can be fine-tuned using data from IoT devices focused on cardiovascular metrics. This approach not only improves the model’s ability to identify early signs of HD but also minimizes the need for extensive computational resources and training time. Transfer learning can also aid in detecting rare heart conditions by applying insights from models trained on related health issues. By combining IoT data with transfer learning, healthcare systems can provide more accurate and timely HD predictions, allowing for early intervention and personalized care. This innovative integration of IoT and transfer learning is advancing the field of preventative healthcare, making it more responsive and tailored to individual patient needs. Figure 3 shows the overall architecture of the proposed LIFE-CARE model.
4. LIFE-CARE Model
This section explains the IoT–cloud-enabled heart prediction framework for HD patients. This research is intended to simplify the workload of medical professionals using IoT, EC, and cloud computing technologies, respectively. In order to monitor the patient’s heart status, we have utilized sensors such as blood pressure sensor (BPS), temperature sensor (TS), blood glucose sensor (BGS), heart rate sensor (HRS), and ECG signal. Technically, for every patient paj = {pa1, pa2, ⋯, pan}, we acquire patient-specific heart status analysis which is forwarded to the distributed Gw. The gathered medical IoT data from the GWj are forwarded to DESj for data preprocessing. The sensed medical data of the patients by GWj are represented as Yd, d = 1, 2, ⋯, D. Yd is provided to DESj which performs preprocessing in dual folds such as data filtering and data normalization, respectively. The preprocessed data is then forwarded to MCSj for HD prediction.
4.1. Data Collection Layer
- •
HRS: It captures the heart rate data that consist of resting hearty rate variability and trends during physical stress and activity. This sensor also captures abnormal heart patterns such as bradycardia, tachycardia, and irregular heartbeats. On the whole, this sensor data serves as prime indicator of cardiac function and employed in early predictive heart conditions.
- •
ECG sensor: It monitors the heart electrical activity that shows detailed insights into heart rhythm and conduction pathways. It detects significant heart issues such as myocardial infractions, arrhythmias, heart block, and ischemia.
- •
BPS: It measures the diastolic and systolic BP that enables examination of hypotension and hypertension. In addition to that, BP variability related to heart monitors led to deep prediction accuracy.
- •
TS: It tracks the body temperature that can indicate systematic information and inflammation as the elevated body temperature strains the cardiovascular system and it also acts as biomarkers that effectively indicate the heart conditions and complications.
- •
BGS: It determines the glucose levels and identifies the prediabetic and diabetes states, since diabetes is a major comorbidity for HD that leads to conditions such as coronary artery disease (CAD) and heart failure.
- •
EEG: The brainwave activity is recorded to examine the neurological factors such as sleep disorders and stress that indirectly impact the cardiac health.
4.2. Data Preprocessing Layer
The sensed heart status data Yd are composed of noise and can be unevenly distributed. Here, the heart status data refers to not only the data from HRS but from other signals such as ECG, EEG, BPS, TS, and BGS. All the data are collaboratively denoted as Yd and subjected to preprocessing. For noise removal and data filtering, we adopt Kalman filter (KF), and for normalization, we utilize Z-score method, respectively. The detailed mathematical equation for data preprocessing is explained as follows.
4.2.1. Data Filtering
4.2.2. Data Normalization
4.3. Collaborative HD Prediction Layer
From the above equation, the window function of the signal is denoted as wi[m], the discrete input signal is denoted by sj[m], the size of hop is denoted as G, and Ms denotes the length of STFT. After that, we calculate the squared magnitude of spectrogram as STFT and mapping the mel scale frequency.
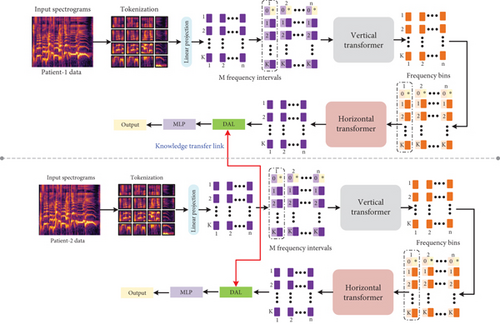
The designed CTL-ST is composed of dual sequential transformer modules, domain adaption, and knowledge blocks, respectively. The dual sequential transformer blocks accept varied dimension tokens. The tokens can be separated based on the time axis which is illustrated in Figure 4. The architecture depth can be increased F times by the proposed CTL-ST. The processed token is then provided to the multilayer perceptron (MLP) for final HD prediction result.
4.3.1. Linear Projection and Tokenization
The input to the initial stage is spectrogram with frequency bins and time slots. The proposed research divides the spectrogram input into k · m token with size of v × v. The size of patch considered in this work is 1 × 1 for processing patches in the finest level with better visualization. The token patches are further provided to the linear projection block which performs token projection into dim-dimensional vectors. The linear projection tensor output can be denoted as T ∈ ℝm×k×dim in which Tj,i denotes the projected token and latent dimension is denoted by dim ∈ M.
4.3.2. Upright Transformer
The projected tokens are separated into subsamples in time domain and can be denoted as T:,i = [T1,i, T2,i, ⋯, Tk,i] ∈ ℝk×dim which thereby obtain m data samples. Note that every data sample contains k tokens. Furthermore, the token class T[CLS] can be replicated to perform positional embedding on every token. The additional m individual data samples are further processed by the upright transformer.
4.3.3. Horizontal Transformer
The data sample output by the upright transformer is denoted by . The attained data samples are amalgamated into tensor Tver ∈ ℝm×k×dim. Furthermore, the class token can be decoupled and then average pooling applied to the class token as . The tensor Tver can be separated into frequency domain of data subsamples as . The subsamples can be generated to form m tokens. Similar to the upright transformer, the token class can be replicated in k times to every data sample . We additionally performed position embedding on every token in which the obtained samples are provided as an input to the horizontal transformer.
4.3.4. Transformer Module
4.3.5. Domain Adaption Layer
From the above equation, λ denotes the reproducing kernel Hilbert space (RKHS) which is embedded with the k-th kernel in which ker(yso, yta) = 〈θ(yso), θ(yta)〉 in which 〈..〉 denotes the inner vector products. The feature mapping function is denoted as θ(.) which denotes the feature mapping function in the source domain to the RKHS. yso and yta denotes the instances of source and target domains, respectively.
From the above equation, Fe(.) denotes the function of feature extraction. By diminishing the domain loss in the CTL-ST, the similar distribution classes are firmly aligned better to form better predictions.
5. Experimental Results
5.1. Dataset Description
For experimental analysis, to identify the occurrence of HD from data of heart patients, here we adapted two datasets from the repository of UCI ML data collection which is freely accessible and utilized widely. Here, two benchmark HD datasets are used, such as comprehensive HD dataset and Cleveland HD dataset which are articulated as follows.
5.1.1. HD Dataset
The HD dataset utilized in the proposed LIFE-CARE diagnosis system is considered from extensively adapted and freely accessible data collection, which has been sanctioned by enormous researchers. Here, two benchmark HD datasets are used, such as inclusive HD dataset including (Long Beach VA + Statlog + Cleveland + Hungarian + Switzerland) and Cleveland HD datasets. These adapted datasets comprise specific characteristic will be considered to make decision whether or not to diagnosis the HD patient. The datasets are as follows.
5.1.2. Cleveland Dataset: Dataset 1
Cleveland dataset encompass classes of 2, occurrences of 303, and attributes of 15 made obtainable through Cleveland Clinic Foundation and Medical Center; additionally, it might acquire in the UCI repository. This is the multivariate dataset containing 76 variables considered for validation. Specifically, it consists of 302 occurrences and 76 properties, anyhow only 15 characters out of 78 are utilized for overall research. Those 15 characteristics are detected as subset of Cleveland databases. Moreover, the 14 characteristics are taken as overall input characteristics. For instance, the patient is addressed as HD negative if it is 0 and HD positive if it is 1.
5.1.3. Long Beach VA + Statlog + Cleveland + Hungarian Switzerland: Dataset 2
This dataset is generated by combining five recognized HD datasets available on IEEE. This dataset is a combination of Long Beach VA + Statlog + Cleveland + Hungarian + Switzerland dataset with significant features including maximum heart rate attained, fasting blood sugar, serum cholesterol, and chest pain type. In this dataset are 1190 instances, 2 classes, and 11 features. It is cooperative effort concerning from the Medical Center, the Cleveland Clinical Foundation, the Statlog (Heart) Foundation, the Hungarian Institute of Cardiology, the Long Beach V Clinical Foundation, and Switzerland. Table 2 states the total number of samples for individual datasets.
| HD datasets | Number of samples |
|---|---|
| Switzerland | 123 |
| Long Beach VA | 200 |
| Hungarian | 294 |
| Cleveland | 303 |
| Statlog (Heart) | 270 |
| Total | 1190 |
5.2. Evaluation Metrics
5.3. Simulation Setup
In our work, collaborative transfer learning is utilized for performing precise HD diagnosis in IoT environment. The number of nodes is inevitably chosen according to accuracy standards and 18% of dropout value with 0.1–0.2 of random weight acknowledgment. Furthermore, it has 0.16 of learning rate and decay rate is 0.98. Here, the amount of epochs is considered to be variable, and then, momentum value is 0.84 and 256 batch size. In this work, IoT data is obtained from wireless body sensor network (WBSN) transmitted to edge server for preprocessing and then sent to cloud server for classifying HD patient. The trial was enacted in i2k2 Cloud platform with TensorFlow ML package including Cassandra and Apache Spark for storage infrastructure and server, respectively.
5.4. Comparative Analysis
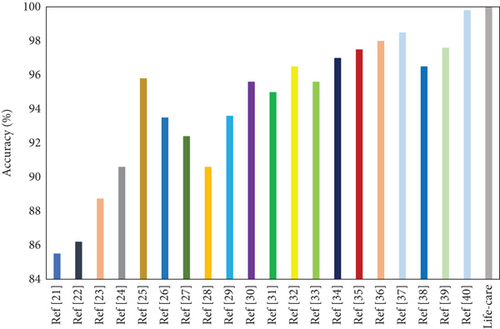
The proposed work is evaluated according to the prediction accuracy with cutting-edge techniques which attach the dataset of HD. Table 3 lists the analysis comparison study of the proposed LIFE-CARE model accuracy with existing models as per maximizing accuracy. Figure 5 displays the comparative result of the proposed model with state of the art. The result of comparison with correlated existing HD diagnosis systems shows that the performance of the proposed system exceeds that of prior works.
| Ref. no. | Method/algorithm | Accuracy (%) |
|---|---|---|
| [21] | DL | 85.5 |
| [22] | Real-time data collection and analysis using IoT sensors | 86.2 |
| [23] | ML with DL | 80.15 |
| [24] | DL to analyze real-time data from IoT devices | 90.6 |
| [25] | ML algorithms process health data in the cloud | 95.8 |
| [26] | Integrates physical models with DL for data analysis | 93.5 |
| [27] | AI models for classification of HD types in IoMT environments | 92.4 |
| [28] | ML algorithms analyze IoT sensor data to assess risk levels | 90.6 |
| [29] | ML algorithms analyze patient data for predictive accuracy | 93.6 |
| [30] | Three-layer DL model combined with metaheuristic optimization | 95.6 |
| [31] | DL | 94.99 |
| [32] | Combines fuzzy logic with LSTM networks optimized by metaheuristic methods | 96.5 |
| [33] | IoT network data analyzed with DL for prediction and recommendations | 95.6 |
| [34] | Modified GRU processes data at the fog layer | 97 |
| [35] | Big data analytics model processes real-time data from IoT devices. | 97.5 |
| [36] | Mask-guided attention U-Net | 98 |
| [37] | CNN with random forest | 98.5 |
| [38] | Remote monitoring of patient health through IoT sensors | 96.5 |
| [39] | Wearable ECG device combined with DL for real-time detection | 97.5 |
| [40] | Edge computing device processes IoT data for HD prediction | 98.2 |
| Proposed | CTL-ST | 98.92 |
Large-scale IoT-driven tasks in healthcare systems demand rapid processing due to their context-sensitive and time-critical nature. The rapid growth in IoT devices and the data they generate have led to a significant increase in data flow, which places considerable strain on service and bandwidth resources. The centralized cloud computing model struggles with connectivity and latency issues, as it cannot efficiently manage these challenges on its own due to inherent limitations in handling large-scale data and bandwidth demands.
To address these issues, decentralized EC models have been developed, which enable computation and storage to occur closer to the data source. Moreover, this model adapts MCS with collaborative transfer learning capabilities. This edge–cloud hierarchy significantly reduces delays and mitigates latency, providing a more efficient framework for managing IoT data.
5.5. Result and Discussion
The experimentation is conducted to estimate the proposed model with changing number of samples reaching from 10% to 100% on generic learning approach including ML, DL, and the proposed model CTL-ST method. Table 4 illustrates the performance analysis in basis of evaluation metrics of accuracy, precision, recall/sensitivity, specificity, and F1 score of ML, DL, and CTL-ST models. Besides, Figures 6a, 6b, 6c, 6d, and 6e signify the impact of accuracy, precision, recall, specificity, and F1 score attained by ML, DL, and CTL-ST. The records are maximized from 10% to 100% for the experiment analysis of considered three learning approaches.
| Data (%) | Accuracy | Precision | Recall | ||||||
|---|---|---|---|---|---|---|---|---|---|
| ML | DL | CTL-ST | ML | DL | CTL-ST | ML | DL | CTL-ST | |
| 10 | 90.41 | 92.26 | 94.89 | 90.62 | 92.33 | 94.85 | 90.57 | 92.42 | 94.99 |
| 20 | 90.58 | 92.68 | 94.92 | 90.81 | 92.78 | 94.96 | 90.92 | 92.73 | 95.05 |
| 30 | 90.76 | 92.45 | 95.64 | 90.99 | 92.49 | 95.66 | 90.68 | 92.88 | 95.68 |
| 40 | 90.93 | 92.88 | 95.36 | 90.74 | 92.54 | 95.24 | 90.75 | 92.53 | 95.34 |
| 50 | 90.89 | 93.74 | 95.78 | 91.02 | 93.29 | 95.45 | 91.08 | 93.95 | 95.19 |
| 60 | 91.05 | 93.56 | 96.23 | 91.25 | 93.86 | 96.23 | 91.36 | 94.09 | 96.13 |
| 70 | 91.55 | 93.82 | 96.86 | 91.60 | 93.68 | 96.47 | 91.14 | 94.34 | 96.76 |
| 80 | 91.14 | 93.93 | 97.33 | 91.44 | 93.98 | 97.02 | 91.68 | 94.21 | 97.44 |
| 90 | 91.78 | 94.58 | 97.16 | 91.82 | 94.42 | 97.68 | 91.74 | 94.63 | 97.09 |
| 100 | 92.08 | 94.96 | 98.72 | 92.13 | 94.73 | 98.25 | 92.35 | 94.85 | 98.79 |
| Data (%) | Specificity | F1 score | |||||||
| ML | DL | CTL-ST | ML | DL | CTL-ST | ||||
| 10 | 90.01 | 92.28 | 94.42 | 90.11 | 92.35 | 94.58 | |||
| 20 | 90.68 | 92.78 | 94.67 | 90.57 | 92.63 | 94.74 | |||
| 30 | 90.53 | 92.43 | 95.95 | 90.74 | 92.82 | 95.69 | |||
| 40 | 90.38 | 92.57 | 95.29 | 90.42 | 92.49 | 95.33 | |||
| 50 | 90.73 | 92.89 | 95.68 | 90.85 | 92.92 | 95.98 | |||
| 60 | 91.25 | 93.14 | 96.38 | 91.29 | 93.56 | 96.47 | |||
| 70 | 91.62 | 93.88 | 96.85 | 91.67 | 93.22 | 97.43 | |||
| 80 | 91.81 | 93.30 | 97.52 | 91.58 | 93.94 | 96.92 | |||
| 90 | 91.54 | 94.38 | 97.23 | 91.82 | 94.42 | 97.68 | |||
| 100 | 91.96 | 94.69 | 98.55 | 91.99 | 94.72 | 98.78 | |||
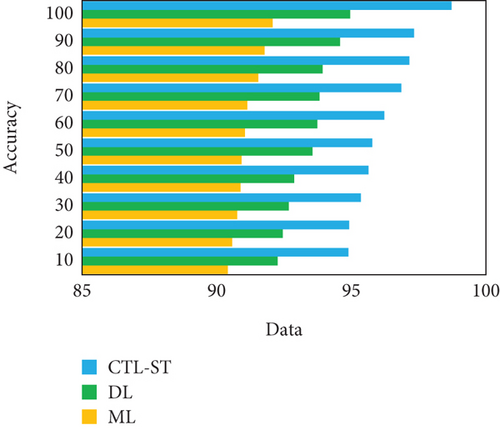
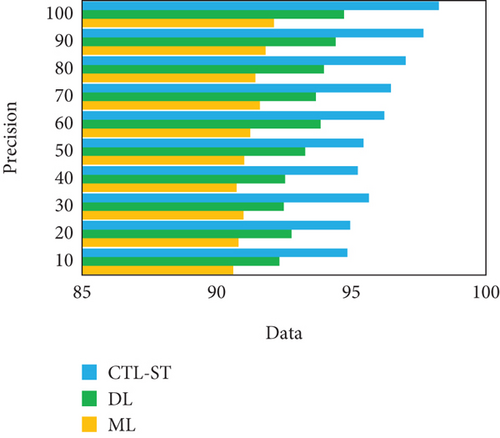
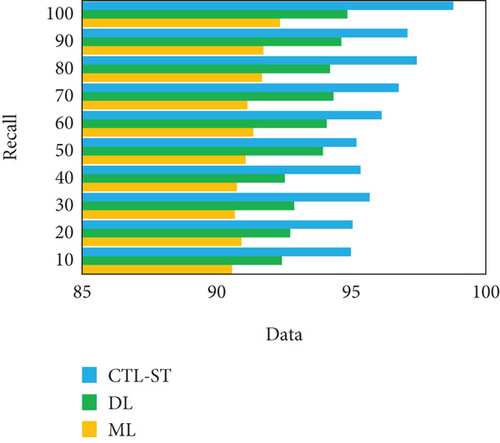
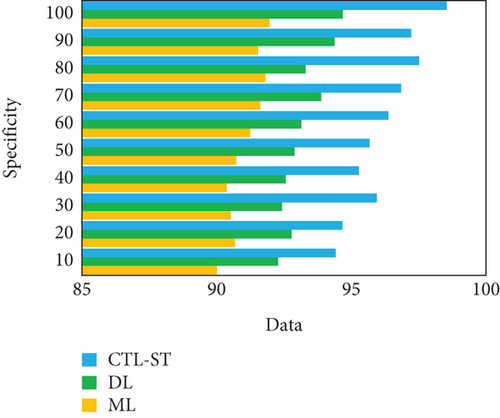
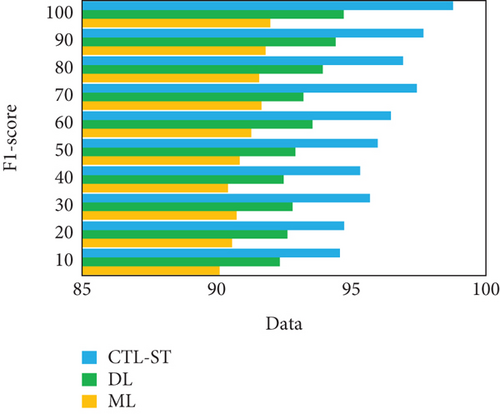
The result of analyzing the performance metrics of the proposed CTL-SL, ML, and DL approaches exposes that the proposed model outperforms the performance of other two learning approaches. Overall performances of the proposed CTL-ST model, ML, and DL methods are compared in Table 5 and Figure 7. Considering multiple performance standards, it is judicious to suppose that the proposed work outperforms other learning methods. In terms of predicting cardiac disease, ML and DL techniques have made considerable strides. The strong performance metrics of traditional ML techniques, with their fewer complex algorithms, are demonstrated by their 95.17% accuracy, 95.19% precision, 95.28% recall, 95.58% specificity, and 95.69% F1 score. These techniques, however, are constrained by the fact that they frequently necessitate manual feature engineering and are unable to automatically extract complicated features from raw data. Furthermore, different kinds of medical data, such those from different sensors utilized in IoT-enabled environments, can be difficult for ML models to integrate. When fresh data becomes available, these constraints may hinder their capacity to adjust and get better over time.
| Performance metrics | ML | DL | CTL-ST |
|---|---|---|---|
| Accuracy (%) | 95.17 | 97.23 | 98.72 |
| Precision (%) | 95.19 | 97.30 | 98.76 |
| Recall (%) | 95.28 | 97.43 | 98.84 |
| Specificity (%) | 95.58 | 97.66 | 98.86 |
| F1 score (%) | 95.69 | 97.82 | 98.92 |
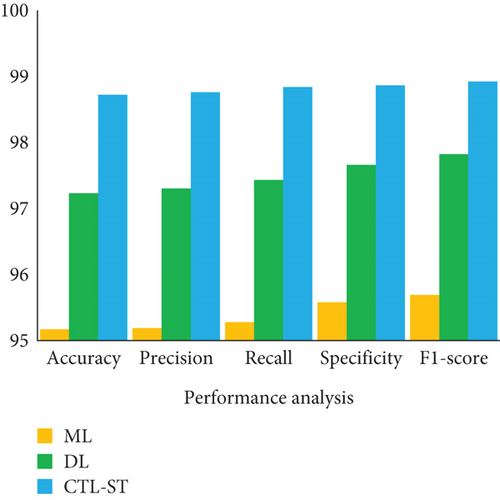
DL techniques, on the other hand, provide better results on all metrics: 97.23% accuracy, 97.30% precision, 97.30% recall, 96.66% specificity, and 97.82% F1 score. The power of DL is found in its capacity to automatically extract hierarchical characteristics from large, complicated datasets, hence improving its prediction power. Despite these benefits, DL models can be difficult to comprehend and frequently require large amounts of data and computer power. The suggested model, “LIFE-CARE,” outperforms both ML and DL techniques with remarkable accuracy of 98.72%, precision of 98.76%, recall of 98.84%, specificity of 98.86%, and an F1 score of 98.92%. It does this by utilizing CTL-ST. The strength of this model lies in its collaborative knowledge distillation technique, which offers more accurate and robust predictions by continuously improving the prediction capabilities through shared learning across models. This iterative improvement combines the advantages of edge-based and cloud-based processing to constantly increase performance, thereby addressing the shortcomings of both ML and DL.
5.6. Real-Time Performance Analysis of the LIFE-CARE Model
In order to examine the applicability of LIFE-CARE model on real-world settings, we create a hypothetical scenario with respect to number of patients and IoT devices on varied combinations. To be clearer, we also show how the designed model performed on varied number of patient volume and IoT devices, respectively.
5.6.1. Scenario Arrangement
- •
Scalability—the capability of the designed model to effectively withstand with amount of IoT devices and patients without compromising the model performance
- •
Model update frequency—the amount of frequency at which the designed model updates/transfers knowledge from another model
- •
Processing time—the amount of time taken to examine and generate model predictions
- •
Prediction accuracy—the percentage of precise HD prediction results
5.6.2. Hypothetical Result Analysis
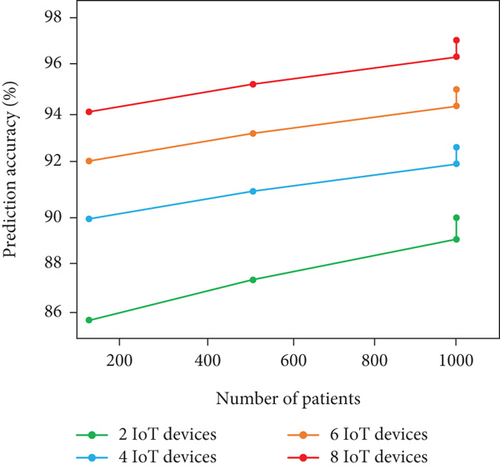
In this supplementary section, we built four hypothetical scenarios with varied number of patients and IoT devices. Here is a detailed breakdown of the scenario analysis.
5.6.2.1. Scenario I: 100 Patients With 2 IoT Devices
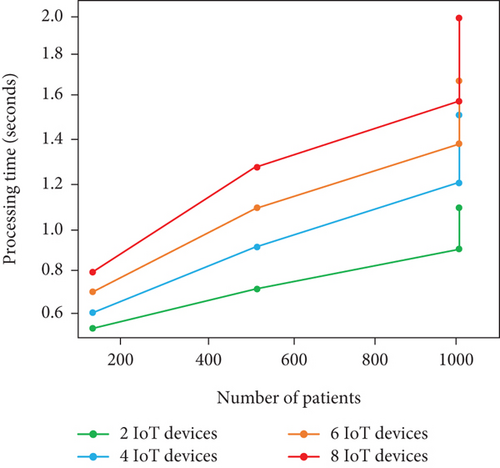
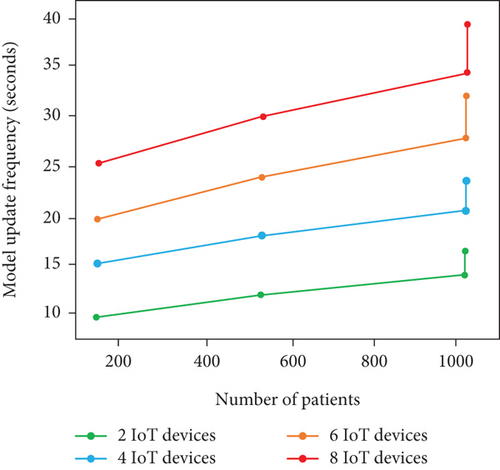
In this scenario, patients utilized heart rate and BPS, respectively. As the patient number and IoT devices are limited, the scalability of the model is relatively higher with 0.4 s as the processing time. The frequency of model update is about every 8 s with prediction accuracy of 90%.
5.6.2.2. Scenario II: 500 Patients With 4 IoT Devices
In this scenario, patients utilized cholesterol level, ECG, heart rate, and BPS, respectively, for HD status acquisition. As the devices and patients get slight increases than Scenario I, we attain only moderate model performance with processing time of 1.5 s per patient, frequency of model update about 15 s, and prediction accuracy of 93%. From the analysis, adding more IoT devices can significantly enhance the prediction accuracy with higher processing time and model update frequency than Scenario I.
5.6.2.3. Scenario III: 1000 Patients With 6 IoT Devices
In this scenario, patients utilized cholesterol level sensor, respiration rate sensor, EEG sensor, ECG sensor, and BPS for HD data acquisition. As the patients attain their maximum limit of 1000 and devices increase, we obtain model update frequency of 28 s with 1.7 s as processing time per patients and prediction accuracy of 97%. By examining this scenario, the prediction accuracy is high than the other two scenarios with higher processing time and model update frequency. The scalability is better; however, higher patients and devices adversely affect the model update frequency.
5.6.2.4. Scenario IV: 1000 Patients With 8 IoT Devices
In this scenario, we adopt cholesterol level sensor, blood sugar sensor, respiration rate sensor, EMG sensor, EEG sensor, ECG sensor, HRS, and BPS, respectively. As the patients and IoT devices reach the scenario maximum limit, there is higher processing time and model update frequency of 3 s and 50 s, respectively, whereas the accuracy attained is 99%. Firmly, there is increment in prediction accuracy and decrement in model scalability in terms of processing time and update frequency, respectively, due to larger number of devices.
In summary, we obtain higher prediction even though the number of IoT devices and patients gets increased. The reason for such higher prediction accuracy is the availability of comprehensive data. In terms of processing time and model update frequency, the performance gets decreased due to increment in patient and IoT devices. The scalability of model shows better on certain limit (i.e., 500 patients with 4 IoT devices) and lags with beyond threshold limit. Table 6 and Figures 8a, 8b, and 8c show the real-time analysis of LIFE-CARE model.
| # of patients | # of IoT devices | Model update frequency (s) | Processing time (s) | Prediction accuracy (%) |
|---|---|---|---|---|
| 100 | 2 | 8 s | 0.4 s | 90% |
| 500 | 4 | 15 s | 1.5 s | 93% |
| 1000 | 6 | 28 s | 1.7 s | 97% |
| 1000 | 8 | 50 s | 3 s | 99% |
5.7. Result Outcomes for Collaborative Transfer Learning
- •
Enhanced prediction accuracy: The adoption of collaborative knowledge distillation in the designed CTL-ST enables the proposed research to learn from varied sources and models, respectively. This knowledge distillation amplifies the prediction accuracy even though the patient data is diverse.
- •
Robustness in diverse scenarios: The diverse IoT sensors such as EEG and heart rate are effectively handled by the proposed LIFE-CARE model. To be clearer, the model can be diverse across different sensory inputs and patient conditions. In addition to that, the continuous update mechanism additionally amplifies the model generalizability.
- •
New data adaptability: The proposed LIFE-CARE model can have the ability to learn from the newer data based on the upcoming heart status patterns. This adaptable nature firmly amplifies the performance of HD prediction.
- •
Flexibility and scalability: The integration and collaboration of DES and MCS highly support data scalability. The adoption of DES and MCS allows to participate wider range of patients and IoT devices and make it more suitable for IoT-enabled healthcare environment.
6. Conclusion
In this research, we adopt an IoT–multicloud-enabled heart prediction system for HD prediction using real-time sensor data. This research adopts medical IoT sensors and EHRs for acquisition of patient health status. The acquired data are then passed to the DES via Gw for preprocessing. The preprocessed data is then provided to the MCC for HD prediction using CTL-ST algorithm. Our model resolves the problem of heterogeneity by accepting the varied input of different patient and acquiring knowledge from the other models through TL and domain adaption techniques. By examining the hearty failure factors of the patients, the survival rate of the patients can be improved through timely prediction.
The effectiveness of the designed CTL-ST is trained on heart failure UCI dataset with various performance metrics. The results show that the proposed work outperforms the existing works.
Disclosure
No third-party individuals or external services were involved in the research or preparation of the manuscript.
Conflicts of Interest
The authors declare no conflicts of interest.
Author Contributions
We confirm that all authors have contributed significantly to the manuscript preparation and research activities. E. Michael Priya: conceptualization, methodology, experimentation, validation, and final approval. K. Sundara Krishnan: data analysis, writing (review and editing), and visualization.
Funding
No funding was received for this research.
Acknowledgments
No AI software was used at any stage of manuscript preparation, data collection, writing, or editing.
Open Research
Data Availability Statement
The data that support the findings of this study are openly available in Cleveland Dataset at https://archive.ics.uci.edu/ml/datasets/Heart+Disease.


