Tripartite Evolutionary Game Model of Stakeholders in IoT
Abstract
As a new paradigm to provide services by acquiring and processing data, Internet of Things (IoT) has become one of the hot topics in academic and industrial areas. In this paper, we construct a tripartite evolutionary game model consisting data providers, service providers, and demanders. High quality of service mainly depends on the high quality of data and is important for improving the quality of experience of demanders. The model also considers the collusion between data providers and service providers, which can make it more realistic. To prevent free-riding and false-reporting problems, reward and punishment strategies are provided. Finally, the system stability of the equilibrium points of the model is verified through comprehensive simulation experiments, and effective methods are proposed to motivate all stakeholders to choose the best strategy. Through the representative evolutionary game model, the paper provides a new solution to the sustainable development of IoT.
1. Introduction
- 1.
Data providers, who directly determine the quality of data and indirectly determine the quality of service and quality of experience of demanders in IoT, need to be appropriately motivated [6–8]. This is because data providers need to collect sensing data, which need to consume resources, such as battery power, communication resources, and storage resources. Meanwhile, data providers also need to spend a certain amount of time in the data collection. In order to ensure the high quality of the collected data, appropriate rewards or punishments are needed [9, 10]. And most of the reward or punishment strategies usually are based on money [11, 12]. Because of the selfish characteristics of data providers, they usually expect to obtain more reward with less cost, which may lead to low quality of data in IoT [13, 14]. The phenomenon can be regarded as free-riding [15, 16].
- 2.
Service providers, who determine the quality of services, process data from data providers and provide services to demanders. Most of the existing studies usually assume that the service providers are completely truthful, who only accept high quality of data and refuse low quality of data [17–19]. However, the service providers and data providers may collude [20, 21]. That is to say, if data providers do not monitor data quality, it may lead to low-quality data being accepted by service providers and the data providers may get more benefit from the demanders. This kind of collusion will cause low quality of data in IoT.
- 3.
Demanders, as the starters in IoT, need high quality of services to satisfy their requirements. Meanwhile, they need to pay for service providers and data providers if the services are accepted. However, due to the selfish nature of demanders [22–24], they may falsely report the quality of service and reduce the payment (or even refuse to pay). This phenomenon can be regarded as false-reporting [25–27]. It will discourage service providers to provide high quality of services and may cause service providers to provide low quality of services by colluding with data providers, which is not beneficial to the development of IoT.
Therefore, in order to solve the abovementioned problems, existing studies have proposed some solutions, most of which mainly focus on the bounded rational and the information asymmetry of the three stakeholders [28–30]. For example, Huang et al. proposed a trading model based on the evolutionary game theory, which can analyze the competition of service providers according to an iteration algorithm and can obtain Nash equilibriums [31]. The trading model can adjust the amount of resources provided to service providers and the corresponding price usually can attract more demanders. Wang et al. applied evolutionary game theory to model the dynamic interaction among demanders, workers, and related platforms, which can be used to control the quality of spatial crowdsourcing scenario of urban air pollution monitoring [32]. Liu et al. proposed a method to analyze the aggregated offloading decisions of demanders through evolutionary game [33]. And this method can achieve better performance in workload balancing. Li et al. constructed a three-party evolutionary game model to address the interest conflicts among task requesters, platform, and crowd workers [34].
- 1.
Based on the bounded rationality and incomplete information of the three stakeholders in IoT, as well as reasonable hypotheses, a tripartite evolutionary game model for data providers, service providers, and demanders is designed to better align with real-world IoT applications.
- 2.
Taking into account the collusion between data providers and service providers, replication dynamic differential equations and indirect Lyapunov approach are used to analyze the system stability of the system equilibrium points under different conditions [37].
- 3.
The influence of rewards, punishments, collusion costs, and monitoring costs on the strategies of the three stakeholders is analyzed and discussed. The strategies to prevent free-riding and false-reporting problems in IoT are designed.
- 4.
The effectiveness of the proposed evolutionary game model is verified by comprehensive simulation experiments, and sound proposals are given to promote the sustainable development of IoT.
The rest of the paper is organized as follows. The second part establishes a tripartite evolutionary game model according to replication dynamic differential equations of the three stakeholders, and the Jacobian matrix of the three stakeholders is constructed to analyze the evolutionary stable strategies according to indirect Lyapunov approach. In the third part, the tripartite evolutionary game model is comprehensively simulated under different conditions and corresponding suggestions are put forward. Finally, the paper is concluded and the future work is discussed.
2. Model and Methods
In this paper, we analyze the strategies of the three stakeholders according to reasonable hypotheses in IoT [38]. Then a tripartite evolutionary game model is built according to replication dynamic differential equations and first-order partial differential equations. Finally, the evolutionarily stable strategy (ESS) of the three stakeholders is analyzed and discussed by indirect Lyapunov approach.
2.1. The Strategies of the Three Stakeholders
Data providers, service providers, and demanders are usually bounded rational and cannot get complete information in IoT. Each stakeholder is restricted and influenced by the others. To pursue the optimal profits of their own, the three stakeholders usually cannot obtain the best strategy only through one-shot game. The three stakeholders need to make the best strategies based on repeat game, which is important for establishing a reasonable tripartite evolutionary game model to reflect the true interests of the three stakeholders. In this section, a tripartite evolutionary game model is constructed. The tripartite evolutionary game model of the three stakeholders can be depicted as follows. The data providers collect sensing data and transmit the data to related service providers. The service providers can process the received data and provide the generated services to demanders. If the quality of data is high, it will be accepted by the related service providers. Otherwise, if the quality of data is low, the related service providers may refuse the data or collude with the data providers and accept the low-quality data. The collusion occurs because the benefit of data providers and service providers comes from the demanders. If service providers accept low-quality data and the related low-quality service is accepted by demanders, the data providers and service providers can get more benefit. This phenomenon is natural in real IoT applications, which also complies with the selfish characteristics of data providers and service providers. The disadvantage of the collusion is that the demanders may refuse low-quality services, which cause that there is no benefit for data providers and service providers.
In order to apply evolutionary game theory to analyze the strategy selection of the three stakeholders, we assume that the data providers have trusted strategies or untrusted strategies and the service providers have monitored strategies or unmonitored strategies, while the demanders have right strategies or wrong strategies. For data providers, the trust strategy α1 expresses the meaning that the data providers provide high quality of data, while the untrusted strategy α2 expresses the meaning that the data providers provide low quality of data. The probability of α1 is x (x ∈ [0, 1]) and the probability of α2 is 1 − x. For service providers, the strategy β1 expresses the meaning that the service providers monitor the quality of data strictly. The strategy β2 expressed the meaning that the service providers do not monitor the quality of data. The probability of β1 is y (y ∈ [0, 1]) and the probability of β2 is 1 − y. For demanders, the right strategy γ1 expressed the meaning that demanders take the right decision, accept high quality of services, and refuse low quality of services. The wrong strategy γ2 expressed the meaning that the demanders misestimate the quality of the received services, that is to say, they refuse high quality of services while accept low quality of services. The probability of γ1 is z (z ∈ [0, 1]) and the probability of γ2 is 1 − z.
The role of the strategies of the three stakeholders is analyzed as follows. The trusted strategy of data providers plays a key role in the development of IoT. While the untrusted strategy of data providers is a serious impediment to the development of IoT. The monitored strategy of service providers can accurately estimate the quality of data, while the unmonitored strategy of service providers accepts all the received data. The right strategy of demanders is beneficial for demanders themselves, while the wrong strategy of demanders is not good for the benefit of demanders themselves.
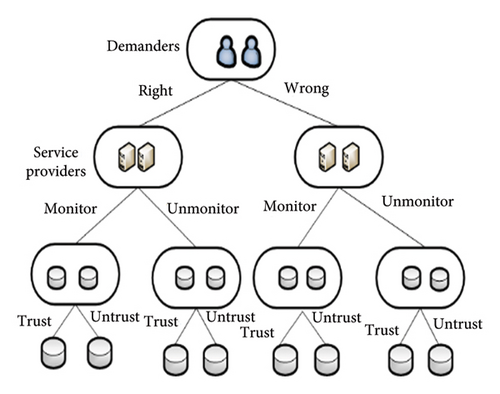
The tripartite game tree of the three stakeholders is depicted in Figure 1. In real-world IoT applications, the demanders may adopt correct strategies to obtain high-quality services or make wrong decisions by choosing low-quality services. Correspondingly, service providers also have two strategic choices: trusting the data quality provided by data providers without detecting the received data, or distrusting the data providers and conducting quality inspections on the data. For data providers, they also have two strategic options: providing genuine data or offering false data.
2.2. Constructing the Payoff Matrix
In IoT, the objective of the three stakeholders is to get more benefit. The cost, benefit, collusion, reward, and punishment for the three stakeholders are analyzed as follows.
For data providers, we assume that the expected cost is C1 if the strategy is the trusted strategy α1, while the expected cost is C2 if the strategy is the untrusted strategy α2. The symbol C1 represents the cost incurred by data providers for offering real and reliable data, while the symbol C2 represents the cost incurred by data providers for offering false and unreliable data. The expected cost of generating high quality of data is usually much bigger than the expected cost of generating low quality of data, which can be denoted as C1 > C2. The symbol B1 denotes the total cost that the demanders are willing to pay to obtain related services. The symbol B1 is also the expected benefit for data providers and service providers. We use θ (0 < θ < 1) to represent the proportion of the payment received by the data provider, and 1 − θ represents the proportion of the payment received by the service provider. So, the expected benefit for data provider is θB1 and the expected benefit for the service provider is (1 − θ)B1. If the data providers collude with untrusted service provider, the cost of collusion is C3. The punishment for data provider is reputation loss if he takes untrusted strategy and the value of the reputation loss is P1. The reward for data provider is R1 if he takes trusted strategy. The reward R1 can be regarded as the additional returns that data providers can obtain in IoT ecosystem.
For service providers, the expected cost is D1 if the quality of the received data is high and they take trusted strategy β1, while the cost is D2 if they collude with data providers and take untrusted strategy β2. The cost of processing high quality of data is usually bigger than the cost of processing low quality of data, which can be denoted as D1 > D2. According to the above analysis for data providers, the benefit for service providers is (1 − θ)B1 if the service is accepted by a demander. If service providers collude with data providers who provide low quality of data, the service providers can get the amount of collusion fee C3 which is equal to the collusion cost of data providers. The punishment for service providers is also reputation loss if they take untrusted strategy and the reputation loss is P2. The reward for service providers is R2 if they take trusted strategy.
For demanders, the cost is B1 which is equal to the benefit of data providers and service providers if demanders accept the received service whether they take right strategy or wrong strategy. The benefit for the demander is B2 if he takes the right strategy and accepts the high quality of service, while the benefit is 0 in the other situations. The punishment for demanders is P3 if the demanders take wrong strategy and refuse high quality of services. The reward for demanders is R3 if they take right strategy and accept high quality of service.
To better understand the parameters in this paper, Table 1 shows the main parameters in the tripartite evolutionary game model and explains their meanings. These key parameters include the costs and benefits of the three major participants, the penalties or rewards that may be incurred from their mutual interactions, and the probabilities of their respective strategies. Accordingly, the payoff matrix of the tripartite evolutionary game model is constructed and presented in Table 2.
| Parameters | Description |
|---|---|
| C1 | The cost of a data provider if his strategy is the trusted strategy α1 |
| C2 | The cost of a data provider if his strategy is the untrusted strategy α2 |
| C3 | The cost of collusion |
| M | The monitor cost of service providers who take monitor strategy β1 |
| B1 | The expected benefit of a data provider and the related service provider |
| B2 | The expected benefit of a demander if the quality of service is high |
| P1 | The reputation loss of a data provider |
| P2 | The reputation loss of a service provider |
| P3 | The punishment for a demander who refuses high-quality service |
| D1 | The cost of a service provider who takes the monitored strategy |
| D2 | The cost of a service provider who takes the unmonitored strategy |
| R1 | The reward of a data provider who provides high-quality data |
| R2 | The reward of a service provider who provides high-quality service |
| R3 | The reward for a demander who accepts high-quality service |
| θ | The proportion of the payment received by a data provider |
| x | The probability of the trusted strategy α1 |
| y | The probability of the monitored strategy β1 |
| z | The probability of the right strategy γ1 |
| Demanders (γ1) | Demanders (γ2) | |||
|---|---|---|---|---|
| Service providers (β1) | Service providers (β2) | Service providers (β1) | Service providers (β2) | |
| Data providers (α1) | (θB1 − C1 + R1, (1 − θ)B1 − D1 − M + R2, B2 − B1 + R3) | (θB1 − C1 + R1, (1 − θ)B1 − D1 + R2, B2 − B1 + R3) | (−C1 + R1, −D1 − M + R2, −P3) | (−C1 + R1, −D1 + R2, −P3) |
| Data providers (α2) | (−C2, −M + R2, 0) | (−C2 − C3 − P1, C3 − D2 − P2, 0) | (−C2, −M + R2, 0) | (θB1 − C2 − C3 − P1, (1 − θ)B1 + C3 − D2 − P2, −B1) |
2.3. Evolutionary Stability Strategies of Stakeholders
Based on the payoff matrix of the tripartite evolutionary game model, we can analyze the evolutionary stability strategies of the three stakeholders. The system stability of the three stakeholders can be analyzed as follows.
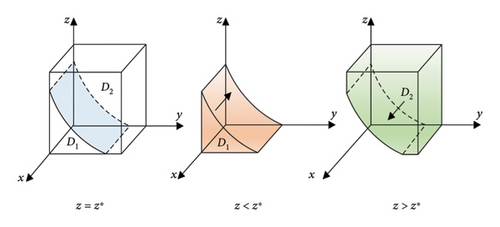
The probability of the data providers choosing to offer real and credible data in a stable state must meet F(x) = 0 and (∂F(x)/∂x) < 0. Since ∂G(z)/∂z > 0, G(z) is an increasing function with respect to z. So, when z = [y(C3 + P1 − θB1) + (C1 + θB1 − R1 − C2 − C3 − P1)]/(2 − y)θB1 = z∗, G(z) = 0.
At this time, (∂F(x)/∂x) ≡ 0, the probability is unstable. When z < z∗, G(z) < 0, we can see that (∂F(x)/∂x) < 0 and F(x) = 0 if x = 0. So x = 0 is the ESS of the data providers. Otherwise x = 1 is the ESS. Figure 2 shows the evolution phase map of data providers.
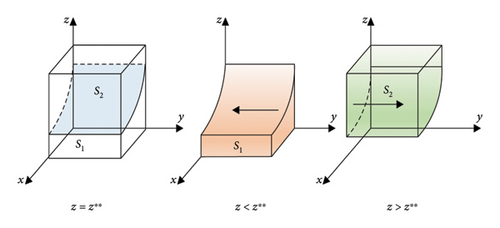
When F(y) = 0 and (∂F(y)/∂y) < 0, the probability for service providers to choose the monitoring strategy in a steady state. Since ∂H(z)/∂z > 0, H(z) is an increasing function with respect to z. So, when z = −(D2 + R2 + P2 − (1 − θ)B1 − C3)/((1 − θ)B1) + M/((1 − x)(1 − θ)B1) = z∗∗, H(z) = 0, (∂F(y)/∂y) ≡ 0. Service providers will not have a stable strategy. When z < z∗∗ and y ≡ 0, H(z) < 0. It can be calculated that (∂F(y)/∂y) < 0, which means that y = 0 is the ESS. Otherwise y = 1 is the ESS. The phase diagram of the service providers’ strategy evolution is shown in Figure 3.
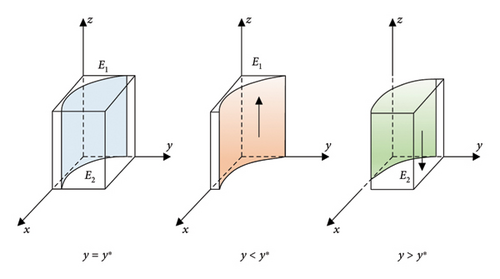
The probability of the demanders choosing the right strategy in a stable state must meet F(z) = 0 and (∂F(z)/∂z) < 0. Since ∂K(y)/∂y < 0, K(y) is a decreasing function with respect to y. So, when y = (x(B2 − 2B1 + P3 + R3) + B1)/((1 − x)B1) = y∗, K(y) = 0.
At this time, (∂F(z)/∂z) ≡ 0, the probability is unstable. When y < y∗ and z ≡ 1, it can be calculated that (∂F(z)/∂z) < 0, which means that z = 1 is the ESS. Otherwise z = 0 is also the ESS. The phase diagram of the demanders’ strategy evolution is shown in Figure 4.
If F(x) = 0, F(y) = 0, and F(z) = 0, we can get eight local equilibrium points of IoT ecosystems, which are E1(1, 1, 1), E2(1, 1, 0), E3(1, 0, 1), E4(1, 0, 0), E5(0, 1, 1), E6(0, 1, 0), E7(0, 0, 1), and E8(0, 0, 0).
According to the stability theory of Lyapunov’s first method, if all the real parts of all eigenvalues of an equilibrium point of the Jacobian matrix J are negative, the corresponding equilibrium point is an evolutionary stable point of IoT ecosystem. If there is one or more eigenvalues which are nonnegative, the corresponding equilibrium point cannot be an evolutionary stable point of IoT ecosystem. The related equilibrium points and their eigenvalues are presented in Table 3.
| Equilibrium point | Eigenvalue λ1 | Eigenvalue λ2 | Eigenvalue λ3 |
|---|---|---|---|
| E1(1, 1, 1) | M | C1 − (C2 + θB1 + R1) | B1 − (B2 + R3 + P3) |
| E2(1, 1, 0) | M | C1 − (C2 + R1) | (B2 + R3 + P3) − B1 |
| E3(1, 0, 1) | −M | B1 − (B2 + R3 + P3) | C1 − (θB1 + C2 + C3 + P1 + R1) |
| E4(1, 0, 0) | −M | (B2 + R3 + P3) − B1 | (C1 + θB1) − (C2 + C3 + P1 + R1) |
| E5(0, 1, 1) | 0 | (C2 + R1 + θB1) − C1 | (C3 + M) − (D2 + R2 + P2) |
| E6(0, 1, 0) | 0 | (C2 + R1) − C1 | [(1 − θ)B1 + C3 + M] − (D2 + R2 + P2) |
| E7(0, 0, 1) | −B1 | (D2 + R2 + P2) − (C3 + M) | (C2 + C3 + R1 + P1 + θB1) − C1 |
| E8(0, 0, 0) | B1 | (C2 + C3 + R1 + P1) − (θB1 + C1) | (D2 + R2 + P2) − [C3 + M + (1 − θ)B1] |
- •
Situation 1: When B1 − (B2 + R3 + P3) < 0 and C1 − (C2 + C3 + P1 + R1 + θB1) < 0, all the eigenvalues of E3 are negative. In this scenario, the strategies of the three stakeholders are (trusted, unmonitored, right). In this scenario, data providers always provide high quality of data, service providers do not monitor the quality of data, and demanders always take the right decision and accept high quality of service. This is an ideal system state of IoT ecosystem because it can prevent false reporting problem and free-riding problem occurrence.
- •
Situation 2: When (B2 + R3 + P3) − B1 < 0 and (C1 + θB1) − (C2 + C3 + P1 + R1) < 0, all the real parts of eigenvalues of E4 are negative. In this scenario, the strategies of the three stakeholders are (trusted, unmonitored, wrong). In this scenario, data providers always provide high quality of data and service providers do not monitor the quality of data, while demanders take the wrong decision and refuse the high quality of service. This is a bad system state of an IoT ecosystem because it can cause false-reporting problems.
- •
Situation 3: When (D2 + R2 + P2) − (C3 + M) < 0 and (C2 + C3 + R1 + P1 + θB1) − C1 < 0, all the real parts of eigenvalues of E7 are negative. In this scenario, the combination strategies of the three stakeholders are (untrusted, unmonitored, right). In this scenario, data providers always provide low quality of data and service providers do not monitor the quality of service, accept collusion fee from data providers, and accept the low-quality data while demanders take the right decision and refuse the low quality of services. This is also a good system state of an IoT ecosystem because it prevents the false-reporting problems.
3. The Simulation Results and Discussion
In order to verify the correctness and effectiveness of the tripartite evolutionary game model proposed in this paper, three groups of simulation experiments are designed. The first group experiments verify the correctness of the system stability of the equilibrium point E3 in situation 1, E4 in situation 2, and E7 in situation 3. The second group experiments verify the influence of different rewards and punishments of the three stakeholders under situation 1, situation 2, and situation 3, respectively. The third group experiments verify the effectiveness of the tripartite game model under different initial values of the strategy selection of the three stakeholders.
3.1. Experimental Analysis for IoT Stability
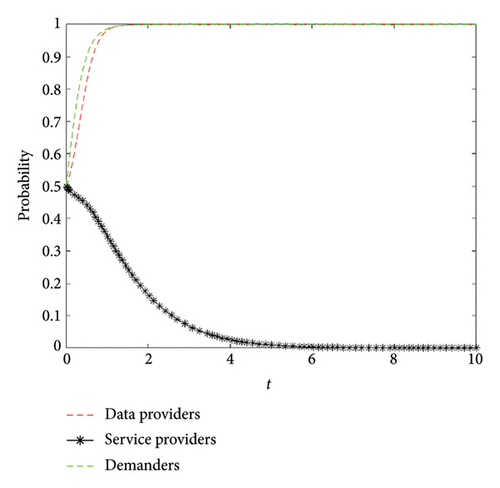
According to the theory analysis in Section 2, we conduct experiments to verify the existence of the system equilibrium points, which are E3, E4, and E7. In situation 1, we set B1 = 10, B2 = 12, C1 = 3, C2 = 1, C3 = 1, D1 = 4, D2 = 1, P1 = 1, P2 = 1, P3 = 1, M = 1, R1 = 1, R2 = 1, R3 = 1, and θ = 0.5, which satisfy the constraints of situation 1. The simulation result is depicted in Figure 5, which is in line with our reasoning results, i.e., the strategy combination of data providers, service providers, and demanders is (trusted, unmonitored, right). This is because the data providers, service providers, or demanders can earn more if they take trusted strategy, unmonitored strategy, and right strategy. So as time goes on, the data providers, service providers, or demanders are more inclined to select trusted strategy, unmonitored strategy, and right strategy.
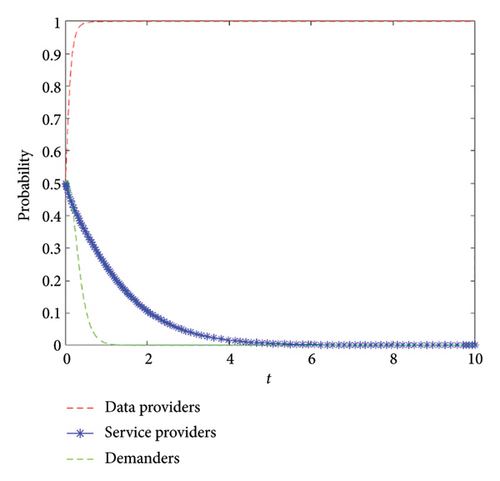
Then, we verify the existence of system equilibrium point E4 in situation 2. We set B1 = 20, B2 = 12, C1 = 3, C2 = 1, C3 = 1, D1 = 4, D2 = 1, P1 = 8, P2 = 1, P3 = 1, M = 1, R1 = 8, R2 = 1, R3 = 1, and θ = 0.5, which satisfy the constraints of situation 2. The simulation result is depicted in Figure 6, which is in line with our theory results, i.e., the strategy combination of data providers, service providers, and demanders is (trusted, unmonitored, wrong). Although the quality of data is high and service providers provide high quality of services, the demanders are more inclined to refuse the services because the price of the service is too high.
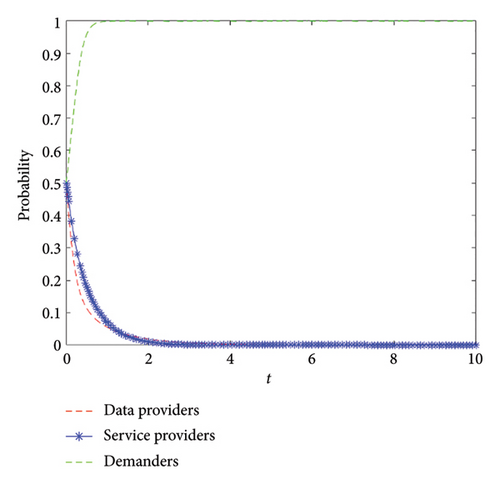
Finally, we verify the existence of the system equilibrium point E7 in situation 3. We set B1 = 10, B2 = 12, C1 = 12, C2 = 1, C3 = 3, D1 = 4, D2 = 1, P1 = 1, P2 = 1, P3 = 1, M = 1, R1 = 1, R2 = 1, R3 = 1, and θ = 0.5, which satisfy the constraints of situation 3. The simulation result is depicted in Figure 7, which is also in line with our theory analysis, i.e., the strategy combination of data providers, service providers, and demanders is (untrusted, unmonitored, right). Because the quality of data is low, which causes the quality of service to be low, the demanders refuse the low quality of services.
3.2. Effects of the Punishment and Reward
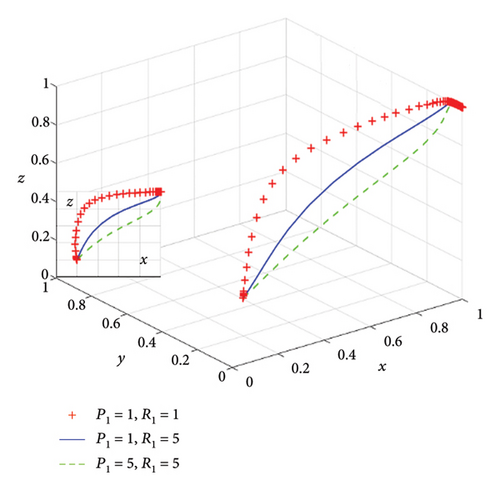
It can be seen that data providers tend to provide low quality of data, service providers tend to choose data without monitoring, and demanders tend to refuse high-priced services if there is no reward or punishment. Under the condition of situation 1 and with all the other parameters unchanged, we set P1 = 1, R1 = 1; P1 = 1, R1 = 5; P1 = 5, and R1 = 5, respectively, in situation 1. The evolution results of the three stakeholders over time are depicted in Figure 8, where the bottom left is XOZ view. Under the premise of satisfying situation 1, it can be observed that the higher the probability of data providers adopting a trusted strategy, the higher the probability of demanders accepting the final services. This also shows that an appropriate decrease in punishment or reward can accelerate the speed of accept the final service.
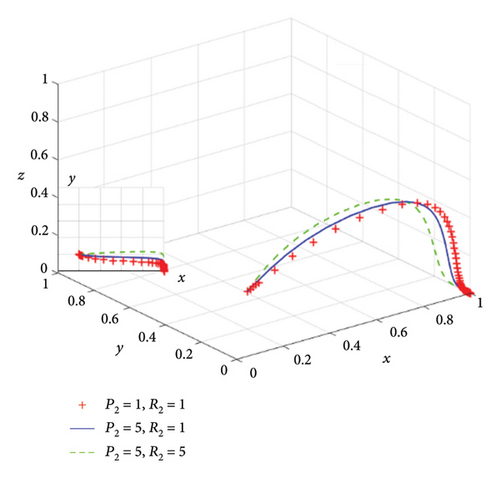
With all the other parameters unchanged, we set R2 = 1, P2 = 1; R2 = 1, P2 = 5; and R2 = 5, and P2 = 5, respectively, in situation 2. The evolution results of the three stakeholders over time are depicted in Figure 9, where the bottom left is XOY view. Under the premise of satisfying situation 2, it can be observed that the lower the probability of monitoring data quality, the higher the probability of providing high-quality data. We also can see that the punishment or reward has limited influence on service providers.
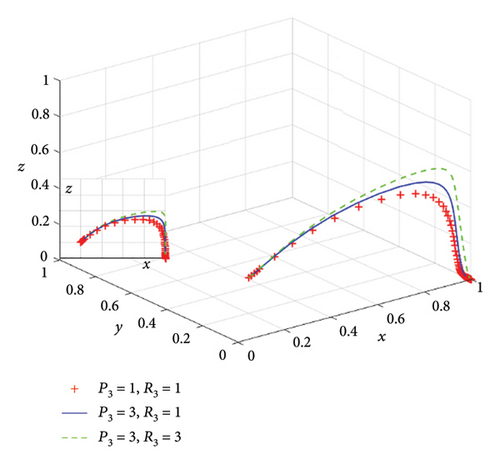
With all the other parameters unchanged, we set R3 = 1, P3 = 1; R3 = 1, P3 = 53; and R3 = 3, P3 = 3, respectively, in situation 2. Figure 10 shows the influence of punishment and reward on demanders. Under the premise of satisfying situation 2, it can be observed that the greater the amount of punishment or reward for demanders, the higher the probability that demanders will adopt the trusted strategy. We also can see that the punishment or reward has limited influence on the demanders.
3.3. Experiments to Verify the Correctness of the Evolution Results
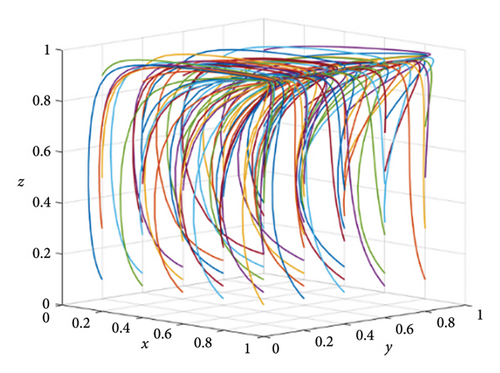
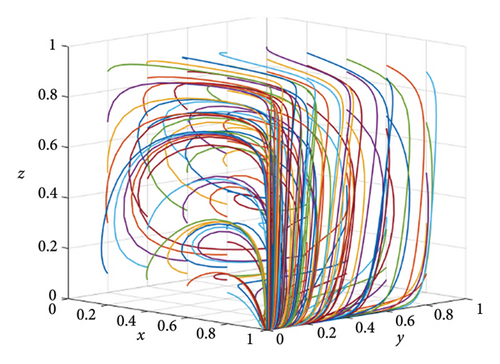
Figures 11, 12, and 13 show the tripartite evolution results of situation 1, situation 2, and situation 3, respectively. Figure 11 shows the tripartite evolution results of situation 1 under different strategies of the three stakeholders in IoT ecosystems. As shown in Figure 8, it can be seen that the final evolution stable point is (1, 0, 1) in situation 1, which is beneficial for the development of IoT ecosystems. Figure 12 shows the tripartite evolution results of situation 2 under different strategies of the three stakeholders in IoT ecosystems. As shown in Figure 9, it can be seen that the final evolution point is (1, 0, 0) in situation 2, which causes false-reporting problems. Figure 13 shows the tripartite evolution results of situation 3 under different strategies of the three stakeholders in IoT ecosystems. As shown in Figure 13, it can be seen that the final evolution point is (0, 0, 1) in situation 3, which cannot prevent free-riding problems.
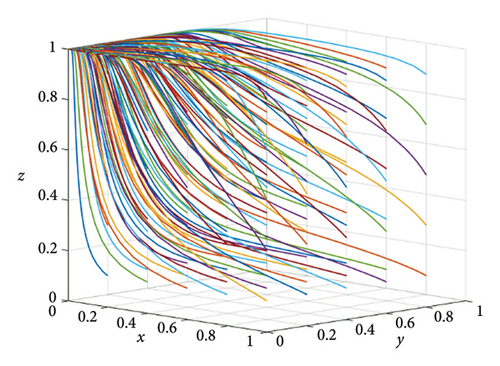
From the simulation results and above analysis, it can be seen that the tripartite evolutionary model proposed in this paper can truly reflect the conflicts of interest existing in IoT ecosystems. In addition, in response to the conflicts of interest, the rewards and punishments of the three stakeholders play an important role, which can promote the stable development of IoT ecosystems.
4. Conclusion
In this paper, a tripartite evolutionary game model among data providers, service providers, and demanders is proposed. The model considers interests among the three stakeholders and collusion between data providers and service providers to make it more realistic. Then, the tripartite evolutionary game model is analyzed using the replication dynamics method, and the evolutionary stable strategies of the three stakeholders are derived by applying the indirect Lyapunov approach. Finally, we analyze the effects of the value of punishments and rewards on the three stakeholders.
In future work, we will consider edge computing paradigms in the applications of IoT ecosystems [40]. Privacy and security are of utmost importance for IoT applications, especially in the fields of healthcare and home automation. Therefore, participants providing privacy and security services for these applications can be regarded as stakeholders, giving rise to a scenario of four-party evolutionary game, which will be built and analyzed based on the proposed tripartite evolutionary game model. Besides, we also consider more factors and research studies on improving quality of data [41], reducing service delay [42], and promoting satisfaction of demanders [43, 44], which can maximize the value of an IoT ecosystem [45, 46].
Conflicts of Interest
The author declares no conflicts of interest.
Funding
This research was supported by the Ningxia Provincial Natural Science Foundation of China (2024AAC03166) and the “Computer Vision and Virtual Reality” innovation team of North Minzu University.
Acknowledgments
The author would like to thank the reviewers and the editor for their valuable comments and suggestions on improving this paper. This research was funded by the Ningxia Provincial Natural Science Foundation of China (Grant No. 2024AAC03166) and the “Computer Vision and Virtual Reality” innovation team of North Minzu University.
Open Research
Data Availability Statement
The data that support the findings of this study are available from the corresponding author upon reasonable request.


