Chaos of Exponential Logistic Map
Abstract
In this paper, chaos of a new exponential logistic map modulated by Gaussian function is investigated. Firstly, the stability of the fixed point is analyzed, and the occurrence of period doubling bifurcation in the system is verified theoretically. Subsequently, the chaotic behavior of the system is analyzed using bifurcation diagrams, phase portraits, and Lyapunov exponents. The numerical results confirm the existence of chaos in the exponential logistic map within a specific parameter range. In addition, the proposed map has additional parameter degrees of freedom compared to the existing generalized logistic maps, which provides different chaotic characteristics and enhances design flexibility required for diverse applications. At last, we further study the two-dimensional coupled exponential logistic map and find that the system enters chaos through two routes: period doubling bifurcation and Hopf bifurcation.
1. Introduction
Chaotic dynamics has received increasing attention over the last few decades due to its wide range of application in the simple population models [1], financial system [2, 3], computer science [4, 5], image encryption [6–8], and epidemic models [9, 10]. At the same time, several classical chaotic systems have been proposed in the literature, such as the Chen and Ueta system [11], the Lorenz system [12], and the logistic map [13–15]. In fact, the logistic map plays an important role in bifurcation theory [16], which is a commonly used tool in nonlinear dynamics and has been widely studied in fields such as physics [17–19].
Conventional chaotic systems, especially discrete one-dimensional maps, are highly rich in information and indications which constitute a large portion of the basic study of chaos theory. However, dynamics modeling of natural phenomena and stochastic processes, as well as secure communication in the field of signal processing, all require the proposal of new chaotic systems. In the last decade, a large number of extensions of a traditional logistic map have been presented and exhibited different dynamic characteristics. For example, Sayed [20] et al. investigated a set of generalized logistic maps where the conventional map is a special case. In [15], three different generalized discrete logistic maps were introduced with arbitrary powers which could generate different chaotic behaviors. Rocha et al. [21–23] defined and investigated some derivative maps from generalized logistic maps which are summarized in Table 1.
| Map | Expression of the sequence |
|---|---|
| The generalized logistic map | |
| The generalized discrete logistic map | |
| Blumberg’s map | |
| Richards’ map | |
| Gompertz’s map | |
| Generic logistic map |
The generalized logistic maps exhibit various dynamical behaviors similar to the traditional logistic map such as Hopf bifurcation and chaos. Moreover, simulations and performance evaluations show that the generalized logistic map can produce chaos with large parameter ranges and better chaotic behaviors compared with the traditional logistic map. Especially, because of the ergodicity of chaos and its sensitive dependence on initial values, the generalized logistic maps–based cryptographic algorithms have suggested some new and efficient ways to develop image encryption techniques [24–26]. Therefore, although many results have been presented, the chaotic dynamics of the generalized logistic map is kept open and deserves further investigation [27].
However, the abovementioned chaos research based on generalized logical maps is still limited to the power function extension of the traditional logical map. Especially, as shown in Table 1, all generalized logical maps under specific parameters can degenerate into traditional logical maps. Therefore, although generalized logistic maps have enriched the study of chaos dynamics to some extent, their applications still face limitations. Firstly, the chaotic regions of these generalized logistic maps often rely on extreme parameter settings, which are significantly different from real ecosystem observation data, such as insect population fluctuation parameters. Secondly, the oversimplification of sensitivity to initial conditions in generalized logical maps makes it difficult to capture the buffering effect of geographic isolation or genetic diversity on chaos in natural systems.
Based on such reasons, we proposed a new logistic map modulated by the Gaussian function instead of the traditional generalized form. We hope that the results of this paper can broaden the research perspective of the generalized logistic map and provide some useful tools for the application of chaos.
The rest of the paper is organized as follows. In Section 2, the detailed description of the exponential logistic map based on the Gaussian function is given firstly. And then, the stability analysis of fixed points and theoretical verification of the existence of period doubling bifurcations are presented. At last, the chaotic behaviors of the new map are discussed through the bifurcation diagrams and Lyapunov exponents. In Section 3, we further investigated the chaos of two-dimensional coupled exponential logistic map. A brief conclusions and discussion are summarized in Section 4.
2. The Exponential Logistic Map
From the literature [28], we know that time series play a very important role in understanding the behaviors of the nonlinear dynamical system. To study the time series, System (2) is calculated numerically for b = 0.1 and μ ∈ [0.8, 4.23], and the results are summarized as follows.
2.1. The Analysis of Time Series
Figure 1 is the time series generated by the exponential logistic map in System (2) for several values of the parameter μ. It can be seen from Figure 1(a) that the system output is monotonous and eventually stabilizes at a fixed point x = 0 when μ = 0.8. However, we are interested in the asymptotic behaviors of the dynamical system rather than its transient initial behavior. In fact, the asymptotic behaviors observed in the exponential logistic map exhibit significant diversity with the variation of parameter μ. When μ = 1.5, the system evolution converges to a stable fixed point x = 0.7368, as shown in Figure 1(b). The result in Figure 1(c) shows that when μ = 2.4, the time series first oscillates around x = 1 and then converges to a point gradually. In comparison with Figures 1(b) and 1(c), the dynamic behavior of the system is no longer a stable fixed point, but a two-period point as shown in Figure 1(d) when μ = 2.8. As μ increases, the time series will experience sustained oscillations with four-period, eight-period, and 16-period. When μ = 4, System (2) has infinite periods no matter what the initial conditions are. It means that the system evolutions have a typical erratic nature. Slight variations in the initial value produce dramatically different results over time and this is just the primary characteristic of chaos, as shown in Figure 1(e). At μ = 4.23, the time series has a three-period point which is shown in Figure 1(f). According to the Sarkovskii theorem and Li and Yorke theorem [29, 30], if a function has a three-period point, then it has all periods, which means that chaos can be achieved within a certain range of control parameters.
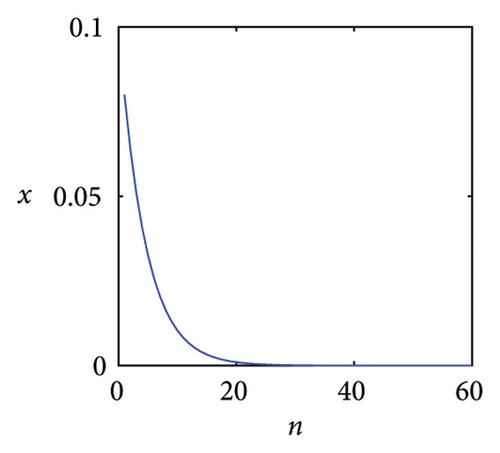
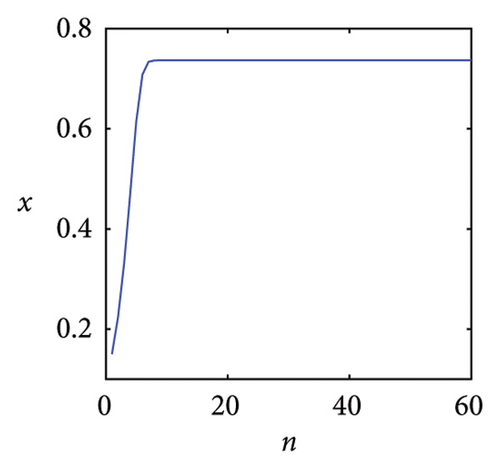
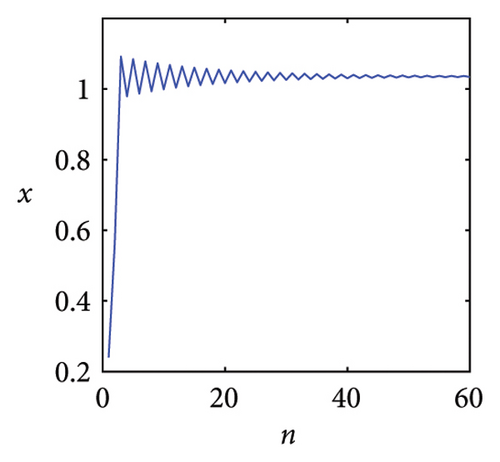
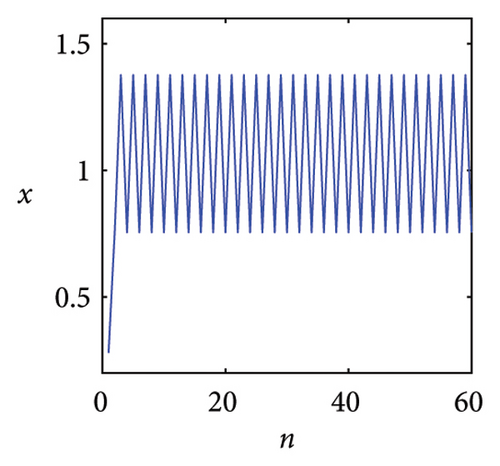
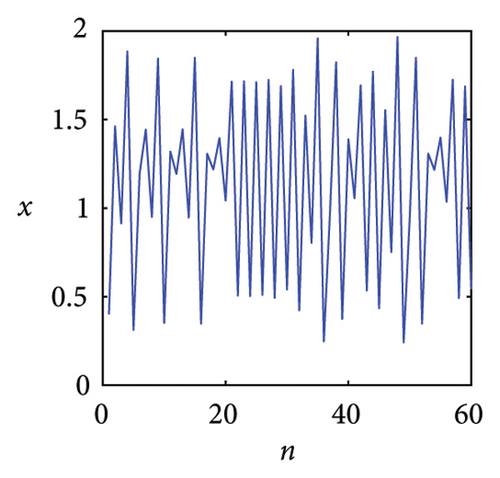
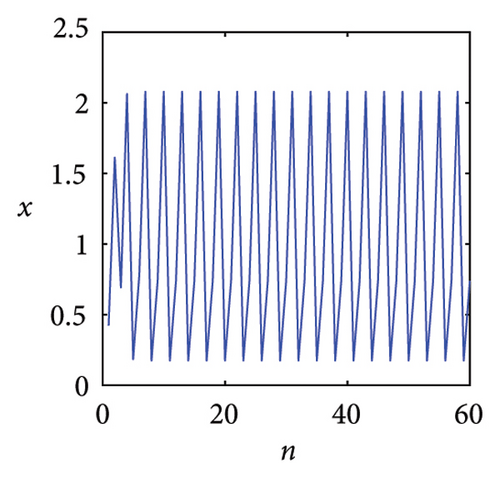
Based on the above analysis, we can observe that the time series of the exponential logistic map is clearly dependent on the change of parameter μ. And obviously, chaotic phenomena can be generated by adjusting the parameters of the exponential logistic map.
2.2. Stability Analysis of Fixed Points
Obviously, when μ < 1, the system has only one trivial fixed point x = 0.
So, the fixed point is stable since .
According to the calculation results of (6), the stable interval of the fixed point x = 0 is .
Through simple calculations, we obtain that the stable interval for fixed point is in the range of , while the stable interval for fixed point is in the range of .
2.3. Verification of Period Doubling Bifurcation
The eigenvalues of the Jacobian matrix of a dynamical system reflect the rate of change in different directions, and an eigenvalue of −1 means that in some directions, the rate of change is opposite to its current state, which may cause changes in the periodic behaviors of the system. In brief, when the eigenvalues of the Jacobian matrix are −1, the system may experience period doubling bifurcation.
According to Theorem 3.5.1 in [31], if the eigenvalues of the Jacobian matrix are −1 at a fixed point and the stability condition and transversality condition are satisfied, the system will experience period doubling bifurcation.
The transversality condition ensures that the system eigenvalues pass through the unit circle at a nonzero rate when the parameters change, avoiding the degradation of bifurcations.
The sign of (13) determines the stability and direction of bifurcation of the two-period orbits.
The verification of conditions (12) and (13) confirms the occurrence of a period doubling bifurcation. Therefore, a two-period cycle bifurcates from for . As μ continues to increase, the eigenvalues of the two-period solution reach −1 again, and the two-period solution bifurcates into a four-period solution, and so on, forming an infinite cascade of period doubling bifurcation sequences.
To further verify the occurrence of period doubling bifurcation in System (2), Figure 2 shows the function f(x) and the quadratic iterated function f2(x) for different parameters μ ≥ 1. From Figure 2(a), it can be seen that when , the system has three fixed points (or one-period points) A, B, and O. When in Figure 2(b), in addition to the three fixed points, there are two two-period Points C and D around the one-period Point B, which indicates the occurrence of period doubling bifurcation.
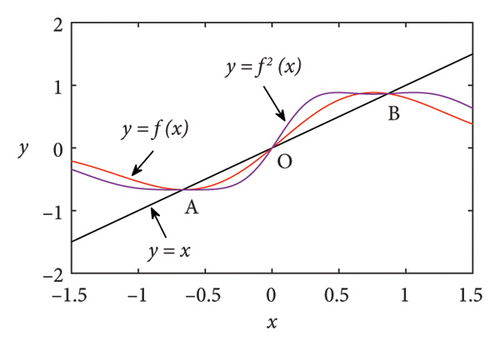
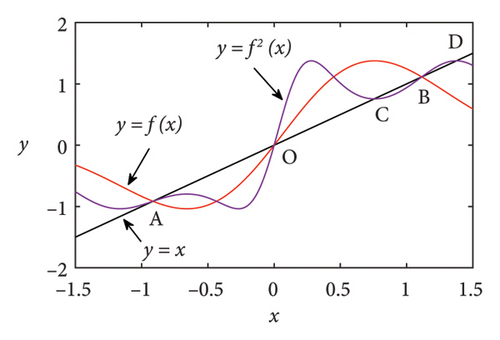
In the following section, some numerical simulation results are presented to investigate the chaos of the exponential logistic map. Moreover, some dynamical behaviors of System (2) are obtained for μ ∈ [−15, 15] with the parameter μ increasing in step sizes of 0.002. The initial state of the system is taken as x0 = 0.1.
2.4. Bifurcation Diagram of the Exponential Logistic Map
To further discuss the chaotic characteristics of the system, we should use a bifurcation diagram which visualizes a system’s attractors as a function of some parameters [32]. Bifurcation diagrams exhibit some characteristic properties of the asymptotic solution of a dynamical system as a function of a control parameter and allow one to see briefly where the qualitative change occurs in the asymptotic solution.
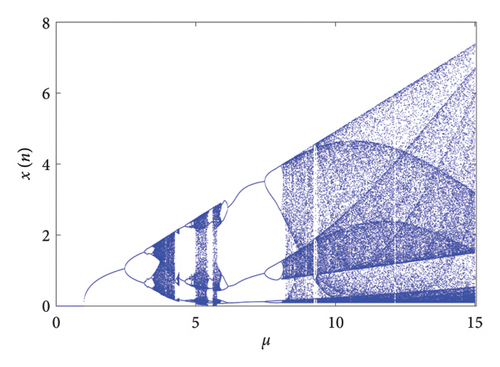
For each value of μ, we iterate System (2) 2000 times to construct the bifurcation diagram as shown in Figure 3. From this diagram, we can observe that the exponential logistic map exhibits period doubling cascades leading to chaotic attractors.
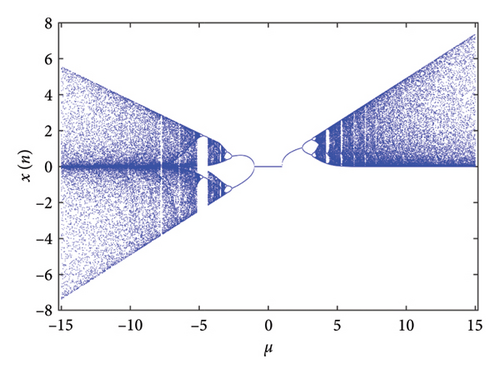
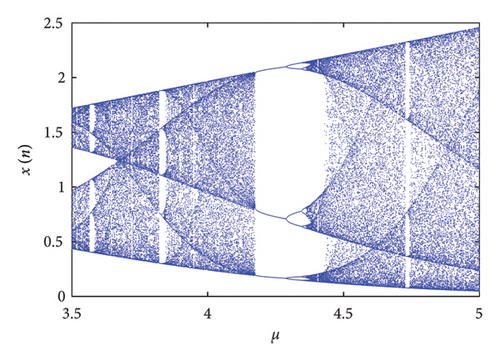
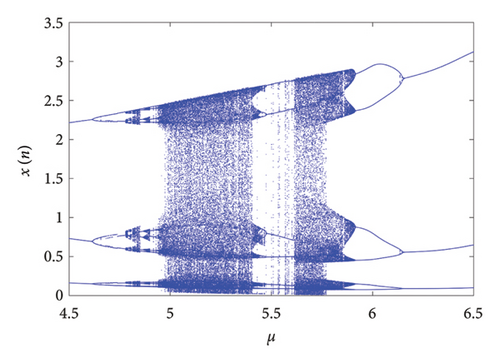
When μ ∈ [−1.01, 1.01], the solution trajectories of System (2) appear as a stable fixed point. As the parameter μ increases to interval [1.01, 2.48], the system response of the exponential logistic map is still relatively simple, manifested as a one-period bifurcation. However, the fixed point begins to lose stability and exhibits period doubling bifurcation at μ = 2.48 and μ = −1.01. As the parameter μ continues to increase toward the positive and negative half axes, a cascade of further period doublings occurs yielding four-period bifurcation and eight-period bifurcation. At μ ≈ 3.67 or μ ≈ −3.66, the solution trajectories enter chaotic state, and the attractor changes from a finite to an infinite set of points. It is worth noting that, in fact, the bifurcation diagram reveals an unexpected mixture of order and chaos, with periodic windows interspersed between chaotic clouds of dots. The large window beginning near μ ≈ 4.158 contains a stable three-period cycle. For making the periodic window visible under naked eyes, Figure 4 provides a partially enlarged view of Figure 3 with 3.5 ≤ μ < 5.
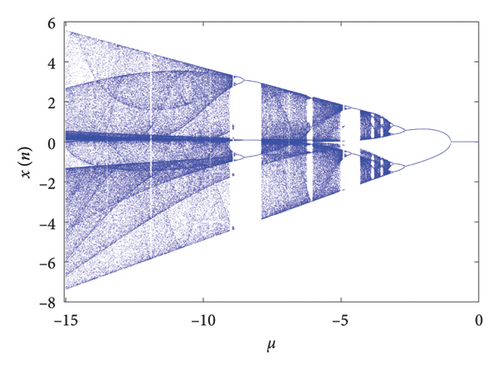
For a negative value of μ, we found a novel phenomenon illustrated in Figure 5. The system still enters chaos through period doubling bifurcation, but the bifurcation diagram shows more complexity because the period doubling bifurcation occurs twice. This phenomenon is not discovered in the generalized logistic map. Moreover, it can be found from Figure 5 that the interval of the chaotic attractor is larger than the generalized discrete logistic map, and it is more conducive to practical application.
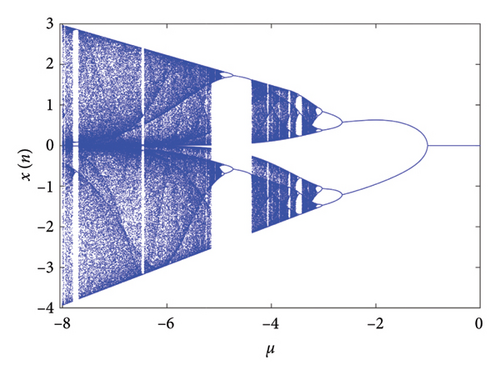
In order to more effectively describe the characteristics of the new exponential logistic map, we made a comparison of the different characteristics between the generalized discrete logistic map and the exponential logistic map. As shown in Table 2, in comparison with the generalized discrete logistic map, the exponential logistic map generates chaos over larger ranges and exhibits better chaotic behaviors. Additionally, the output sequence of the system is no longer limited to the interval [0, 1], thus having more flexibility that fits the most recent applications such as quantitative financial modeling, pathological diagnosis and treatment, secure communication, weather forecasting, and various other fields.
| Parameter | Generalized discrete logistic map | Exponential logistic map |
|---|---|---|
| Expression | ||
| Range of sequence xn | [0, 1] | (−7.4, 7.4) |
| Range of parameter μ | [0, 4] | [−15, 15] |
| Bifurcation versus μ | μ = 3.021 | μ = 2.48, μ = −1.01 |
| Chaotic region | [3.655, 4] | [3.67, 15], [−3.66, −15] |
2.5. Lyapunov Exponent of the Exponential Logistic Map
Lyapunov exponent is mainly used to measure the exponential divergence rate of adjacent orbits in dynamical systems and is one of the important numerical features to quantitatively analyze chaotic motion. Usually, a positive Lyapunov exponent means exponential separation of adjacent orbits and therefore a chaotic indicator, while a negative exponent indicates normal system behaviors [33].
Definition 1. The Lyapunov exponents for a system xn+1 = f(xn) with an initial value x0 can be defined as
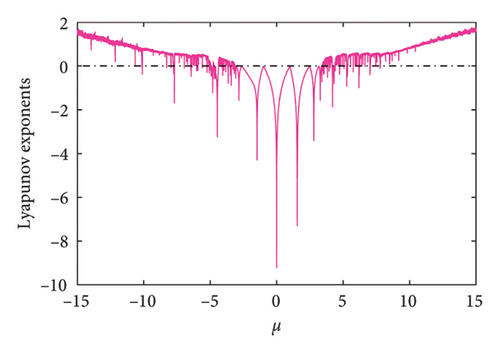
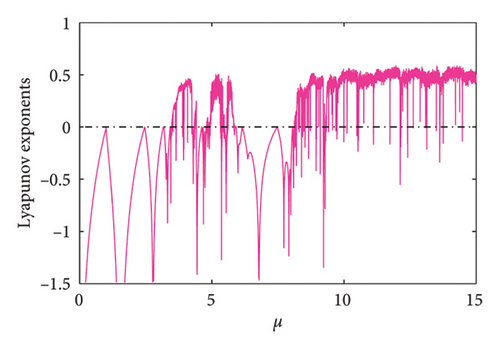
The Lyapunov exponents of the exponential logistic map are shown in Figure 6. From the figure, it can be seen that the region with a positive Lyapunov exponent is consistent with the chaotic region in Figure 3.
3. Coupled Exponential Logistic Map
Based on the current academic research studies, high dimensional chaotic maps have more complicated structures and better antijamming performances. In recent decades, the chaos of the two-dimensional logistic map with coupled terms has been studied through experimental and theoretical methods [34–36]. Based on the previous section, we proposed a new two-dimensional coupled exponential logistic map and investigated its bifurcation and chaos. For convenience, we only consider the expression with quadratic coupling terms in this paper.
3.1. The Analysis of Phase Portraits
In order to conduct a comprehensive study on the dynamical behaviors of System (15), we used phase portraits to investigate the evolution of the systemic behaviors with the change of μ. Some numerical simulation results are obtained as shown in Figures 7 and 8.
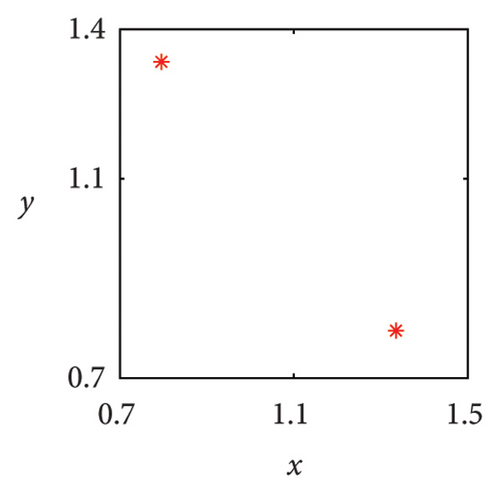
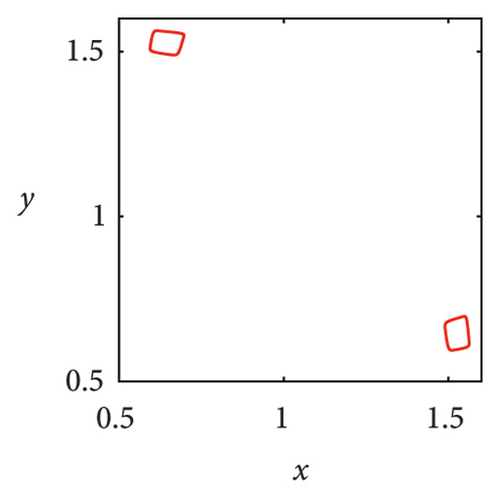
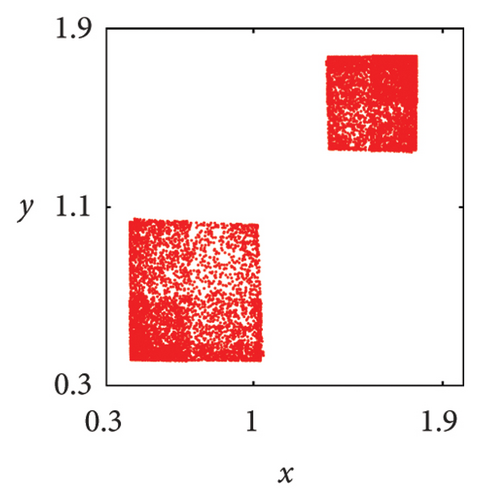
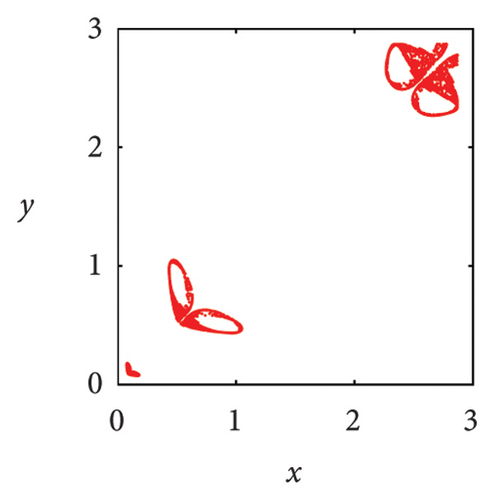
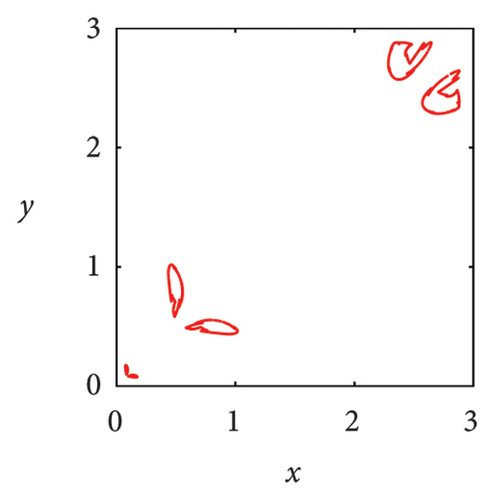
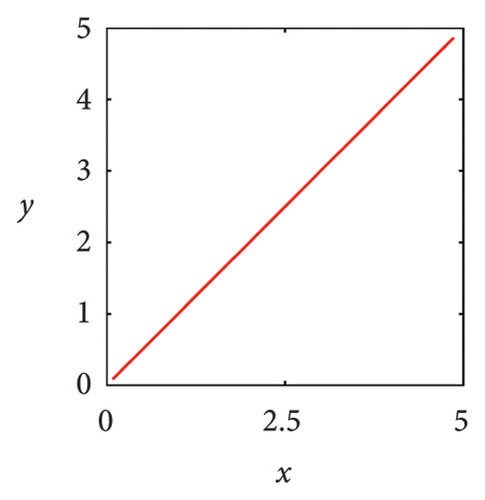
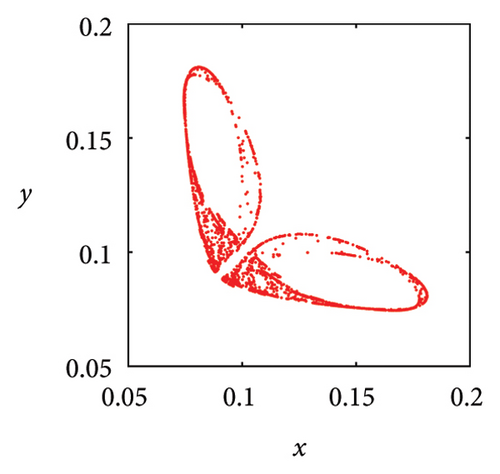
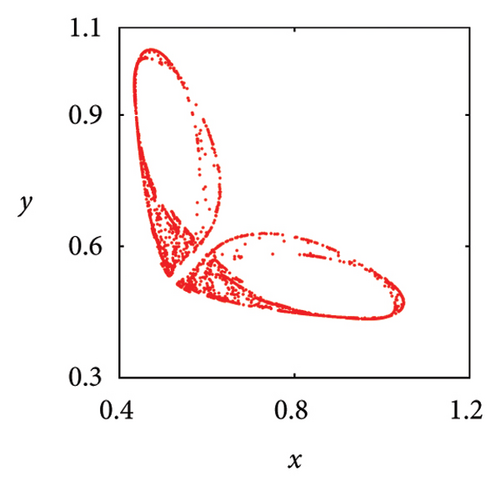
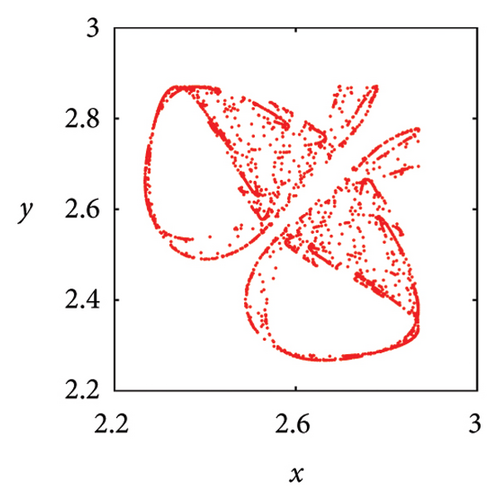
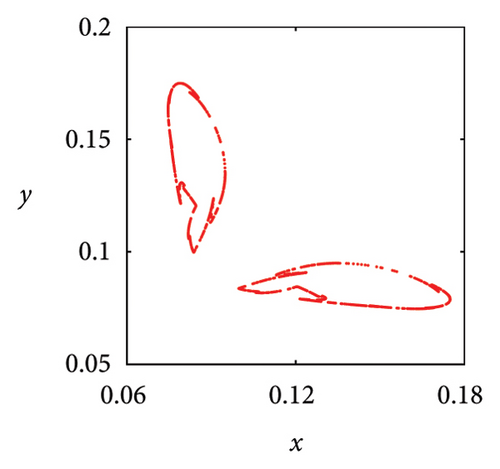
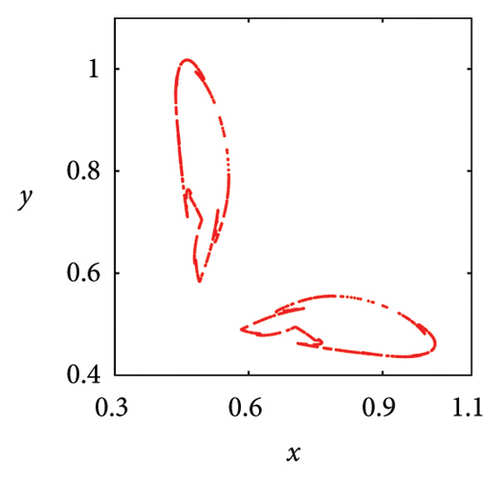
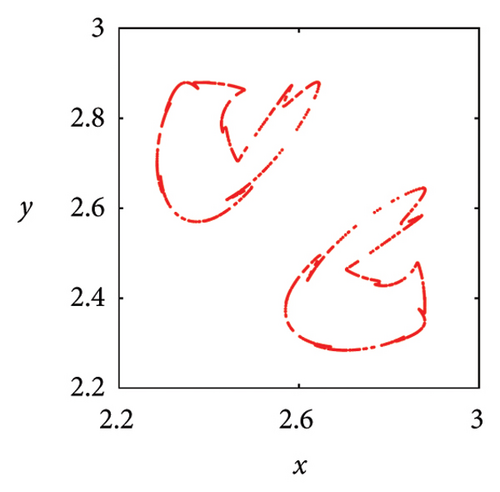
In Figure 7(a), it can be seen that when μ = 2.7, the system state is two symmetric two-period points about y = x. As the parameter μ increases, these two fixed points undergo a complex frequency locking and Hopf bifurcation, ultimately losing stability and evolving into two symmetric limit cycles, as shown in Figure 7(b). In Figure 7(c), phase portrait appears as two square attractors, and the system orbit is restricted to move within the attraction domain. In the case of μ = 5.83, there are three pairs of strange attractors in phase portrait as shown in Figures 7(d) or 8(a), 8(b), and 8(c), which is a typical characteristic of chaos. The phase portrait of the two-dimensional coupled exponential logistic map with μ = 5.85 is plotted in Figures 7(e) or 8(d), 8(e), and 8(f). Despite subtle changes in parameters μ, the system degenerates into three pairs of limit cycles which indicate that the corresponding state of the system is a periodic window. When the parameter increases to μ = 9.86, an interesting phenomenon is that the phase portrait manifests as a straight-line segment and the corresponding function expression is y = x in Figure 8(f).
3.2. The Analysis of Bifurcation Diagram
Figure 9 is the bifurcation diagram of System (15) with the parameter μ. As can be seen from the figure, the two-dimensional coupled exponential logistic map has a stable two-period orbit and two unstable fixed points at μ = 2.4. It means that a new limit cycle with a double period is generated. As period doubling continues to happen, we can see that the system slowly enters chaotic. When parameter μ is greater than 3.82, the bifurcations ramp up until the system is capable of eventually traversing any value and it is known as the period doubling route to chaos. However, for some specific values of μ, the system becomes nonchaotic and with periodic results, which are characterized by periodic oscillations, nonperiodic and their interspersed behaviors.
The bifurcation diagram shows that there is a large periodic window on the path of the system entering the chaotic region, which indicates that the two-dimensional coupled exponential logistic map enters chaos through intermittent burst patterns that alternate between periodicity and chaos. This feature can be integrated into a semiconductor chaotic encryption chip, and the carrier frequency can be dynamically modulated by intermittent chaotic signals to achieve high resistance to interception in hardware-level secure communication. Another noticeable phenomenon is that the system has experienced the alternating occurrences of period doubling bifurcation and chaos which is enlarged and shown in Figure 10. These phenomena include all sudden destruction or creations of chaotic attractors may result from the collision of an unstable periodic orbit and a coexisting chaotic attractor, which is called chaos crisis by Grebogi [37].
When μ < 0 in Figure 11, we found the dynamical behaviors of the two-dimensional coupled exponential logistic map have some specific characteristics. As μ increases, the system is observed to undergo a transition from chaos to period doubling bifurcation and then suddenly enter a stable state. According to the bifurcation diagram, this phenomenon occurs twice, which indicates that the coupled logistic map has rich dynamic behaviors.
Based on the phase portraits and bifurcation diagrams, we found that the two-dimensional coupled exponential logistic map enters chaos through period doubling bifurcation and Hopf bifurcation.
3.3. The Analysis of Lyapunov Exponent
Definition 2. [9] Let f′(x) denote the Jacobin matrix of System (15), that is,
Let
Then, the Lyapunov exponents of f(x) can be defined as
Based on Definition 2, the Lyapunov exponent spectrum of the two-dimensional coupled exponential logistic map is calculated as shown in Figure 12. Without loss of generality, the first 1000 iterations of the system are abandoned to ensure that the orbit is converged to attractors.
From the figure, it can be seen that the positive Lyapunov exponent corresponds to the chaotic region in Figure 9. Moreover, the Lyapunov exponent spectrum of the system also reflects the intermittent bursts of chaos and periodic alternation in the system.
From an ecological perspective, the exponential logistic map in System (2) can be regarded as a special population growth model. The exponential term simulates the Gaussian regulation of environmental carrying capacity, which indicates that when the population density xn deviates from the optimal value b, the reproductive rate will exhibit a bell-shaped curve decline.
When the parameter μ increases to the critical value , the population size xn enters periodic fluctuations from a steady state due to the influence of certain periodic factors, such as annual alternation of abundance and scarcity.
When the parameter further increases, the system enters chaos, and the population size shows unpredictable and violent oscillations, reflecting the uncontrolled growth or decline of the population under the collapse of the ecosystem or extreme environmental fluctuations.
Similarly, the two-dimensional coupled exponential logistic map in System (15) can be regarded as a population growth models composed of two populations with synergistic and reciprocal relationships. The Gaussian term reflects the self-regulation within each population, while the cross-term rxnyn reflects the mutualistic symbiosis between populations, such as pollinators and plants.
Period doubling bifurcation in System (15) reflects synchronous periodic fluctuations in the number of two species, while Hopf bifurcation reflects the generation of quasi-periodic oscillations or limit cycles in the system, corresponding to asynchronous fluctuations after niche differentiation, such as alternating advantages caused by uneven resource allocation.
4. Conclusions
In this work, we propose a new exponential logistic map modulated by Gaussian functions. Based on the time series analysis, we first study the time evolution of the exponential logistic map under different parameters. And then, the existence of period doubling bifurcation in the system is verified through rigorous mathematical theory. We further investigate the bifurcation diagrams and Lyapunov exponent spectra of the exponential logistic map under different parameters using numerical methods. The numerical results indicate the presence of chaos in the system. Furthermore, we investigate the chaos of the two-dimensional coupled exponential logistic map. The results indicate that the two-dimensional coupled exponential logistic map has richer dynamic behaviors than the exponential logistic map.
Further research will focus on the existence of multistability and hidden attractors in exponential logistic maps and two-dimensional coupled exponential logistic maps.
Conflicts of Interest
The authors declare no conflicts of interest.
Author Contributions
All authors contributed equally to this work.
Funding
The authors acknowledge financial support by Sichuan Province Science and Technology Support Program (No. 2018JY0256).
Acknowledgments
The authors acknowledge financial support by Sichuan Province Science and Technology Support Program (No. 2018JY0256).
Open Research
Data Availability Statement
The data that support the findings of this study are available from the corresponding author upon reasonable request.


