Comprehensive Measures, Regional Differences, and Dynamic Evolution of e-Commerce Level in China Based on the e-Commerce Data of 31 Provinces From 2013 to 2021
Abstract
At present, the digital transformation in the global economy is accelerating. In order to understand the development of e-commerce in China correctly, the study establishes eight secondary indicators to estimate the level of e-commerce in China from 2013 to 2021 with the entropy weight–CRITIC method. Using the Dagum Gini coefficient, we investigated the overall, intraregional, and interregional differences in the level of e-commerce in China. Through Kernel density estimation and Markov chain analysis, the study explored the dynamic evolution characteristics of their distribution. From 2013 to 2021, the level of e-commerce in China exhibited a fluctuating upward trend, with an overall growth rate of 71.82%, but the overall level of e-commerce was still low, showing a strong presence in the east and a weak presence in the west. It is evident that the differences in the level of e-commerce mainly came from regional variations, with an average contribution rate of 72.98%. From the perspective of the dynamic evolution of distribution, the level of Chinese e-commerce exhibited strong stability and characteristics of club convergence. Considering the spatial factors, the convergence of Chinese e-commerce levels is evident. Based on the results, the study will propose a series of countermeasures and suggestions for adopting a regional coordinated development strategy to reduce the gap in e-commerce levels between different regions.
1. Introduction
In the context of the continuous improvement of information technology, e-commerce has been widely used and developed worldwide due to its advantages of all-day opening and offering convenient purchasing options [1]. Released by the Ministry of Commerce, the “China’s E-commerce Report in the First Three Quarters of 2023” showed from January to September 2023, the national online retail sales reached 10.8 trillion yuan, an increase of 11.6%, which is 4.8% points higher than the total retail sales of consumer goods. With the aim of facilitating the steady, sustainable, and healthy development of the digital economy, numerous regions across China have adopted a series of effective measures to enhance the level of e-commerce [2]. However, despite the overall prosperity of e-commerce in China, there are significant differences in the development levels of e-commerce among different regions [3]. These differences are mainly manifested in infrastructure conditions, industrial structures, and the degree of Internet development [4]. In the long run, it will not only affect the coordinated development of the national economy but also limit the potential of e-commerce to drive economic growth. It is necessary for us to measure the level of e-commerce, explain the reasons for significant disparities, and subsequently take effective measures to improve the level of e-commerce.
e-Commerce constitutes a direct pathway to take advantage of information technology and make enormous profits [5, 6]. In recent years, enormous number of cholars have conducted in-depth studies on e-commerce. Nowadays, the studies on e-commerce are mainly focused on the development of e-commerce [7–9], cross-border e-commerce [10–12], regional e-commerce [13–15], and other aspects. In this literature, the development of e-commerce is influenced by various factors, including the management system, data acquisition, government policies, and service innovation [8]. Based on the development of e-commerce, Huang and Chang [16] examined the impact of consumers’ willingness on e-commerce transactions by establishing a correlation model between consumers’ perceived trust and value. Gironda and Peterson [17] conducted a comparative analysis among different countries and discovered that policies and the external environment were the key factors that contributed to the disparities in national e-commerce levels. Huang, Jing, and Li [18] calculated the total transaction volume and market share of e-commerce companies in major regions of China, summarized the characteristics of regional e-commerce in China, and found that there was an inherent impact between the development of e-commerce and industry as well as national consumption. It can be seen that adopting e-commerce as the primary development mode of the digital economy can partially eliminate traditional trade barriers [19], thereby facilitating the transformation and upgrading of the economic structure and fostering the integration of various industries in the digital era [20].
Enhancing the construction of the e-commerce level serves as a crucial impetus that can continuously propel the digital development of the economy [21]. With the development of continuous and dynamic advancements in science and technology, cross-border e-commerce has been progressively emerging as a critically significant element within the realm of economic globalization, playing an indispensable role in reshaping global economic patterns and facilitating international trade exchanges. Agrawal and Wildasin [22] centered their attention on the impact exerted by technological innovation on fiscal revenue. Against the backdrop of technological innovation facilitating the development of cross-border e-commerce, they carried out in-depth research on cross-border e-commerce tax policies. The findings of their study demonstrated that alterations in technology would lead to the reallocation of tax revenue, shifting it from regions with high tax rates to those with low tax rates. Aqlan [23] emphasized the essential role of information technology and logistics technology in paving the way for the development of cross-border e-commerce. Xiao and Zhang [24] discovered that China was at the forefront of establishing a comprehensive policy framework for cross-border e-commerce, encompassing all elements within the industrial ecosystem. Therefore, we should strengthen the top-level advantage in the field of e-commerce and focus on strengthening the system construction to adapt to the new trend in the field of cross-border e-commerce.
Across different regions, the development of e-commerce has witnessed substantial transformations. Future economic development will also be influenced by the relative degree to which regions are able to draw in, grow, and retain information technology–intensive firms. Notably, information technology has exerted a profound impact on the economic landscapes of both the urban and rural areas. Specifically, villages characterized by e-commerce-intensive industries are capable of directly generating employment opportunities for the local populace, thereby playing a crucial role in promoting rural economic prosperity and narrowing the urban–rural economic gap [25]. Msoffe and Ngulube [26] take the rural areas of developing countries as the main research object and point out that the benefits of e-commerce development in rural areas of developing countries have been unsatisfactory due to backward ways of obtaining information, single channels, lack of rural infrastructure, and insufficient effectiveness. Nevertheless, with the support of contemporary Internet technology, the future prospects of e-commerce are becoming increasingly clear. The relative degree to which regions attract, develop, and maintain information technology–intensive industries will further contribute to future economic prosperity. This model has already spurred the development of e-commerce in various regions across the globe and has played a positive and constructive role in facilitating commercial and trade exchanges among different countries.
The relevant research on the development of e-commerce has provided a specific theoretical basis for the result analysis and policy recommendations put forward in this paper [7–15]. Nevertheless, certain shortcomings also exist. First, some scholars adopt the annual e-commerce transaction volume as a measurement metric, while others resort to indicators such as the proportion of online retail transaction volume to the total retail sales of goods in society. These indicators, on their own, are rather singular and prove challenging when it comes to comprehensively gauging the developmental status of e-commerce within China. Second, the current academic research on e-commerce predominantly centers around cross-border e-commerce, with relatively inadequate attention being paid to the development level of regional e-commerce as well as the origins of regional e-commerce disparities. Moreover, the majority of research periods terminate around 2018, which makes it arduous to precisely assess the alterations in e-commerce levels among China’s provinces. Lastly, there has been a lack of systematic and comprehensive studies regarding the development and evolution of e-commerce within the four major regions of China. Therefore, it is extremely necessary to conduct in-depth research on this topic. In light of the aforementioned issues, this article endeavors to establish a comprehensive evaluation index system and employs the comprehensive weight TOPSIS method to comprehensively measure the level of e-commerce in China from 2013 to 2021. Then, by employing the Dagum Gini coefficient, an analysis will be conducted on the spatial agglomeration pattern and the sources of differences in the development level of e-commerce within the four major regions of China from the perspective of regional differentiated development. Finally, the Kernel density method will be utilized to explore the evolutionary trend of the e-commerce development level throughout the observation sample period, with the aim of discerning the commonalities in the trend evolution of the e-commerce development level among different regions. The results of this study will provide important theoretical support and practical guidance for promoting the coordinated development of e-commerce in different regions of China and formulating relevant policies.
The main contribution of the study is embodied in two dimensions: theoretical significance and practical significance. In theory, the index system of the level of e-commerce in China is scientifically constructed. The study will start from a macro perspective, making up for the shortcomings of existing studies, which are mainly qualitative analysis. From a practical point of view, the construction of a scientific e-commerce indicator system can help us analyze from different dimensions and provide strong support for the four major regions of China to formulate e-commerce development policies. In general, the study facilitates a comprehensive understanding and analysis of the spatial and temporal variations, as well as the dynamic evolution, of e-commerce development across different regions in China.
Therefore, the study will be structured into four parts. The second section will focus on elucidating the formulation, methodology, and data sources of China’s e-commerce development index. Subsequently, the third section will delve into an examination of the spatial and temporal patterns, as well as the dynamic evolutionary trends, of China’s e-commerce development. Then, the fourth section will delve into the factors contributing to the disparities in the development of e-commerce within China. Lastly, the fifth section will focus on strategies to promote the sustained growth of e-commerce in China within the framework of economic globalization and propose practical measures and countermeasures based on the analysis findings.
2. Development of an e-Commerce Index System, Methodologies for Research, and Sources of Data
2.1. E-commerce Index System Construction
In recent years, many scholars have constructed index systems to evaluate the development of e-commerce, centering around aspects such as the number of online stores, user preparedness, infrastructure, and legal basis [27, 28]. Lesma and Okada [29] established an e-commerce evaluation index system with online marketing ability, electronic payment, customs efficiency, logistics efficiency, and legal basis. Murthy, Kalsie, and Shankar [30] summarized the development indicators of e-commerce as the development of information and communication technology on the basis of investigating the change rules of several development variables and several digital variables, including secondary indicators such as communication service and fixed-line telephone subscription. Zhang and Jiao [31] categorized China’s e-commerce development evaluation index system based on information and communication infrastructure, primary and advanced applications of ICT, enterprise digitalization, and the development of the ICT industry. Fan and Wu [32] constructed the evaluation indicators for the development level of China’s e-commerce from four aspects, including production, consumption, circulation, and the government.
The aforementioned scholars have endeavored to employ comprehensive indicators such as e-commerce indices or construct index systems for evaluating the development level of e-commerce. Nevertheless, the quantity of indicators utilized by them is relatively limited, and the disparities are considerable. Additionally, previous studies predominantly adopted communication infrastructure and the number of online stores as the primary measurement metrics, overlooking the purchase and sales volumes of e-commerce. Consequently, it is arduous to precisely gauge the development status of e-commerce in China, which is disadvantageous for analyzing the regional differences and dynamic evolution of the e-commerce development level. Because of the large provincial scopes and data availability, the index system construction of e-commerce exists difference, which can affect the study to measure the development of e-commerce correctly.
Based on the provincial level in China, the study will explore the construction of indexes deeply. On the one hand, the study will add two key indicators, including the purchase volume and sales volume of e-commerce, because they can reflect the transaction scale and activity of e-commerce activities. On the other hand, the study will take into account both the regional informatization level and the e-commerce transaction level. In the regional informatization level, the indicators such as computer usage and the number of enterprise websites reflect the basic conditions for the development of e-commerce. And in the e-commerce transaction level, indicators such as the number and proportion of enterprises participating in e-commerce transactions further improve the evaluation system from the perspective of the participation of market entities.
Based on China’s provinces, the study will improve the index system, by exploring the construction of indexes, adding some essential indexes, including the amount of purchasing and sales volumes in e-commerce, and taking into account both the level of regional informatization and the level of e-commerce transactions. Guided by the new development concepts of innovation, coordination, green, openness, and sharing, this study takes the regional informatization level and e-commerce transaction level as the dimensions for building the e-commerce development index, with the intention of considering the characteristics of different regions and correctly evaluating the development level of e-commerce in China. The study will construct eight secondary indexes (as shown in Table 1), including the use of computers at the end of the period, the number of computers used per 100 people, the number of websites owned by enterprises, the number of websites owned by 100 enterprises, the number of enterprises with e-commerce transactions, the proportion of enterprises with e-commerce transaction activities, e-commerce sales, and e-commerce purchases. These indexes are designed to accommodate regional disparities and detect the evolution of e-commerce in China, thereby facilitating the government in formulating policies to enhance the development level of e-commerce.
| First-level index | Second-level index | Definition of index | Index property |
|---|---|---|---|
| Regional informatization level | Number of computers used at the end of the period | Total number of computers in use at year end | + |
| Number of computers used per 100 people | Number of people ∗ 100 | + | |
| Number of websites owned by the enterprise | Total number of websites owned by the enterprise at the end of the year | + | |
| Number of websites per 100 companies | Number of enterprises at the end of the year ∗ 100 | + | |
| e-Commerce transaction levels | Number of enterprises with e-commerce transactions | The number of enterprises that have conducted e-commerce transactions | + |
| Proportion of enterprises with e-commerce activities | Number of enterprises in e-commerce transactions | + | |
| e-Commerce sales | Sales of goods and services achieved by enterprises through e-commerce platforms | + | |
| e-Commerce purchases | The total amount of goods and services purchased by enterprises through e-commerce platforms | + | |
2.2. Research Methods
2.2.1. Entropy Weight–CRITIC Method
Aiming at calculating the development level of e-commerce, many people use the analytic hierarchy process method and the generalized entropy weight method [33–35]. However, the analytic hierarchy process method may make it difficult to select indicators and sensitive to outlier processing, and the measurement results have a large deviation from the true value, which is not conducive to measuring the weight of e-commerce indicators. Moreover, the generalized entropy weight method will lead to a large error in the measurement of the overall e-commerce level, affect the accuracy of data, and have a large amount of computation and more calculation processes [36, 37]. The CRITIC method only considers the correlation between the volatility within the data indicators and the indicators, without considering the degree of dispersion of the values [38].
-
Step 1: Use the range method to standardize each index.
() -
In this formula, Xij and Zij represent j original and standardized e-commerce level index value of province i, respectively.
-
Step 2: Calculate the information entropy Ej and data proportion Aij of each index in the system Zij of the level of e-commerce.
()() -
Step 3: Calculate the mean and standard deviation Sj of the j th index in the index system of e-commerce level.
()() -
Step 4: Calculate the index conflict Rj and information content Cj of e-commerce level.
()() -
where Xij represents the correlation coefficient between evaluation index i and j, where the greater Cj is, the greater the role of the j th evaluation index in the entire evaluation index system.
-
Step 5: Calculate the entropy weight of each index Wej.
() -
Step 6: Calculate the CRITIC method weight Wcrj of each index.
() -
Step 7: Calculate the weight of entropy weight–CRITIC method Wj.
() -
In the formula, Wej + Sj reflects the dispersion degree and volatility of the value of indicator j and the greater the value, the higher the importance of the indicator.
-
Step 8: Calculate the weighted index Rij of each index of e-commerce level.
2.2.2. Dagum Gini Coefficient
-
Step 1: Calculate the overall Gini coefficient G for all provinces.
() -
In the formula, j and h represent different regions, i and r represent different provinces, Q represents the total number of provinces, k represents the total number of regions in one country, represents the average level of e-commerce development in all provinces, and Qj and Qh represent the total number of provinces in j and h, respectively.
-
Step 2: Calculate the numerical value of Gjj and Gjh, which represent the Gini coefficient in j and the coefficient of j and h.
()() -
In the formula, represents the mean value of e-commerce level in j province and represents the mean value of e-commerce level in h province.
-
Step 3: Calculate the intraregional gap Gw, interregional gap Gb, and super-variable density Gt according to the method of subgroup decomposition.
In the formula, djh represents the difference of e-commerce level between region j and region h and Fj and Fh represent the cumulative distribution function of e-commerce level in region j and region h.
2.2.3. Kernel Density Estimation
In the formula, f(x) represents the density function of random variable x, N represents the number of observations, Xi represents the independent and equally distributed observations, represents the mean value of observations, h represents the bandwidth, and K(x) represents the Gaussian kernel density function.
2.2.4. Analytical Method of Markov Chain
In the formula, the status of Xt in the period of t + 1 is only related to its status in the period of t.
In the formula, ni refers to the total number of provinces in a state in period t and nij refers to the transition from a state in period t to b state in period t + 1. Pab forms a Markov n∗n dimensional matrix. The diagonal element of the matrix represents the probability that the level of e-commerce is stable in the current state. The greater the probability value, the worse the mobility of e-commerce level. The nondiagonal elements of the matrix represent the probability of state transition of e-commerce level.
In the formula, Yj refers to the e-commerce level index of the region in a certain year and Wij refers to the element in row i and column j of the spatial weight matrix W. In the study, a spatial proximity matrix is adopted. Wij = 1 indicates that regions i and j are adjacent, and Wij = 0 indicates that regions i and j are not adjacent.
2.3. Data Sources
The study focuses on analyzing data from 31 provinces directly under the Central Government of China. Regions including Hong Kong, Macao, and Taiwan are excluded due to data unavailability. The data used in the study are mainly sourced from the China Statistical Yearbook, the China Environment Statistical Yearbook, the China Urban Statistical Yearbook, the China Population and Employment Statistical Yearbook, and the portal website of NBS of China (https://www.stats.gov.cn/). For the missing data of individual years and provinces, the study has been filled by the linear interpolation method.
The study aims to measure the level of e-commerce development in China from 2013 to 2021. In order to better reflect the differences between regions, the study divides China into four regions, including northeast, eastern, central, and western regions. According to the basic evaluation results of the level of China’s e-commerce, the four-point method is used to divide the level of China’s e-commerce into four levels: low level (0, 0.150], medium and low level (0.150, 0.200], medium and high level (0.200, 0.267], and high level (0.267, 1].
3. Result Analysis
3.1. Temporal and Spatial Pattern of e-Commerce Level in China
3.1.1. Comprehensive Weight of China’s e-Commerce Level Index
Table 2 displays the relative weights assigned to key indicators of China’s e-commerce development. Analysis of the primary indicators reveals that the regional level of informatization holds the highest weight at 51.17%, significantly influencing the overall e-commerce development in China. From a secondary indicators standpoint, the primary indicators include the ratio of computers per 100 individuals, the quantity of enterprise-owned websites, and the volume of e-commerce transactions, with respective weights of 0.151, 0.141, and 0.128. Conversely, the least significant indicator is the quantity of computers in use at the conclusion of the period, carrying a weight of 0.098. The analysis suggests that the degree of digitalization among both enterprises and individuals in China has a noticeable positive impact on the progress of e-commerce.
| First-level index | Second-level index | Trophy method weight | CRITIC method | CRITIC method weight | Weight | Total weight | |
|---|---|---|---|---|---|---|---|
| Sj | Rj | ||||||
| Regional informatization level | Number of computers used at the end of the period | 0.146 | 0.168 | 2.288 | 0.084 | 0.098 | 0.512 |
| Number of computers used per 100 people | 0.065 | 0.170 | 4.663 | 0.174 | 0.151 | ||
| Number of websites owned by the enterprise | 0.140 | 0.193 | 3.091 | 0.131 | 0.141 | ||
| Number of websites per 100 companies | 0.014 | 0.174 | 4.724 | 0.180 | 0.122 | ||
| e-Commerce transaction level | Number of enterprises with e-commerce transactions | 0.160 | 0.182 | 2.656 | 0.106 | 0.125 | 0.488 |
| Proportion of enterprises with e-commerce activities | 0.042 | 0.172 | 4.108 | 0.155 | 0.120 | ||
| e-Commerce sales | 0.210 | 0.163 | 2.263 | 0.081 | 0.116 | ||
| e-Commerce purchases | 0.224 | 0.174 | 2.334 | 0.089 | 0.128 | ||
3.1.2. The Basic Evaluation Results of the Level of e-Commerce in China
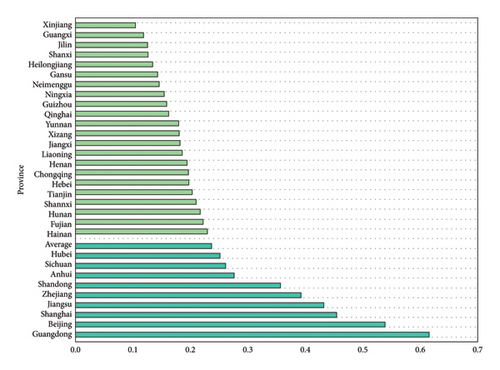
The data presented in Figure 1 illustrate the average assessment results of China’s e-commerce level in 31 provinces from 2013 to 2021. China’s e-commerce development has shown a fluctuating upward trajectory, increasing from 0.166 in 2013 to 0.2847 in 2021, indicating a growth rate of 71.82%. Throughout the observational period, the average level of e-commerce development in the nation was 0.237. Notably, nine provinces such as Hubei, Sichuan, and other places surpassed this national average, constituting 29.03% of the surveyed areas.
The data presented in Figure 2 illustrates that the level of e-commerce development in the eastern region exceeds the national average, showing a consistent upward trend. Specifically, the e-commerce development index in the eastern region increased from 0.270 in 2013 to 0.444 in 2021, indicating a significant growth rate of 64.53%.
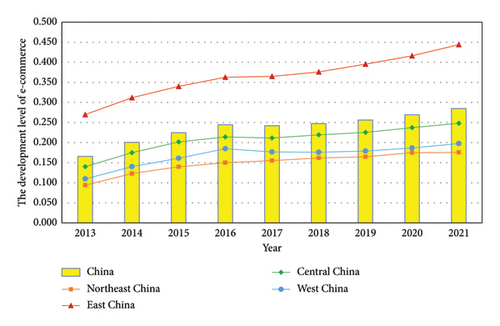
During the observation period, the levels of e-commerce development in northeast China, central China, and western China were all below the national average. Notably, central China exhibited a higher level of e-commerce development compared to the northeast and western regions, showing a consistent upward trajectory. Specifically, the e-commerce development index in central China increased from 0.140 in 2013 to 0.248 in 2021, marking a growth rate of 77.16%. In contrast, the western region consistently outperformed the northeast in terms of e-commerce development, displaying a fluctuating yet upward trend. The e-commerce development index in the western region increased from 0.110 in 2013 to 0.198 in 2021, indicating a growth rate of 80.38%. Despite ranking lowest among the major regions in China, northeast China demonstrated a positive growth trend in e-commerce development, increasing from 0.094 in 2013 to 0.176 in 2021, with a growth rate of 86.80%. These findings indicate that the growth rate of e-commerce development in northeast China surpassed that of other regions in the country, with western China following closely behind in second place.
While e-commerce is experiencing growth at a national level, there remains a significant issue of unequal distribution among regions within our country. Specifically, the central and western regions are displaying fluctuating growth trends, while the eastern and northeastern regions are consistently growing. The spatial distribution of e-commerce development in China is characterized by a pattern of strength in the east and weakness in the west, as illustrated in the provided figure, which is consistent with the research results of Liang and Li [13].
3.1.3. Regional Differences in the Level of e-Commerce Development in China
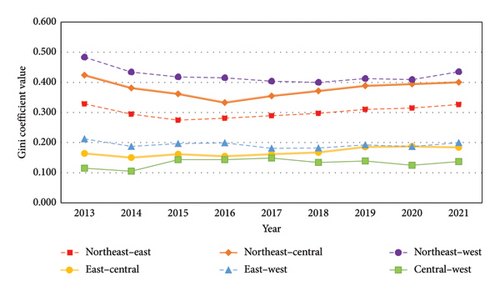
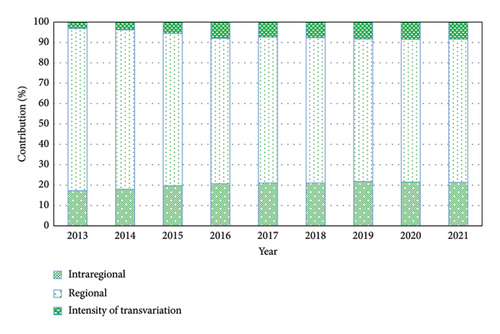
In order to accurately reflect the interregional, intraregional, and super-variable density differences, the line and bar charts in Figures 3, 4, and 5 can reflect the corresponding variation trends.

The data presented in Figure 3 illustrates the distribution of subgroups with regional disparities in the level of e-commerce development in China. Analysis of the four regions reveals that the intragroup Gini coefficients in the eastern and western regions have exhibited minimal fluctuations, indicating an overall increasing trend. Specifically, the value distribution in these regions has increased from 0.125 and 0.087 in 2013 to 0.133 and 0.092 in 2021, respectively. In contrast, the northeast region experienced a pattern of initial decline followed by an increase, reaching its lowest point in 2016 with a Gini coefficient of 0.191. Subsequently, it displayed an upward trajectory, reaching a peak of 0.254 in 2021. The central region demonstrated a fluctuating upward trend, characterized by significant fluctuations, peaking at 0.154 in 2019, and displaying a slight downward trend in the subsequent 2 years. The aforementioned scenario illustrates a significant intragroup Gini coefficient in northeast China between 2013 and 2021, indicating notable disparities in e-commerce advancement across provinces within the region. These discrepancies have been observed to widen over time. In contrast, the central region exhibits a moderate level of e-commerce development, as reflected by its intermediary intragroup Gini coefficient distribution. Conversely, the eastern and western regions exhibit relatively smaller Gini coefficient subgroups with minimal fluctuations, indicating a more consistent level of e-commerce development among provinces in these areas.
Figure 4 illustrates the subgroup distribution of interregional variances within the four primary regions of China spanning the years 2013 to 2021. The data depicted in the figure indicate that the interregional disparities between the northeast region and the remaining three regions exhibit a significantly higher magnitude compared to the variances observed among other regions. Furthermore, the interregional gaps between the eastern and western regions are depicted as gradually diminishing over time. In contrast, the interregional differences between the central region and the western region are relatively smaller in scale when compared to the disparities observed among other regions. Additionally, the distribution of subgroups within the regions demonstrates a more uniform pattern.
Figure 5 illustrates the primary factors influencing the varying levels of e-commerce development in China. Over the observed period, the contribution rates of interregion, intraregion, and super-variable density exhibited a decreasing trend. Notably, the disparities in e-commerce development across regions in China predominantly stem from interregional distinctions, with an average contribution rate of 72.98% and an intergroup contribution rate exceeding 69%. Conversely, the impact of uneven e-commerce development within regions is relatively minor, which is consistent with empirical observations.
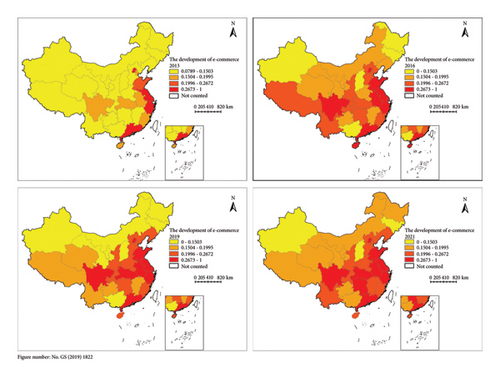
As can be seen from Figure 6, it illustrates the evolution of China’s e-commerce development across regions from 2013 to 2021. Initially, in 2013, most regions exhibited a low level of e-commerce development, whereas by 2021, over half of the regions had transitioned to a medium-high or high level. The prevailing distribution pattern continues to reflect a disparity, characterized by a stronger presence in eastern regions compared to western regions, with coastal areas showing greater development than inland regions. In 2013, only five regions, including Beijing, Jiangsu, Zhejiang, Shanghai, and Guangdong, were classified as high-level areas for e-commerce. The number has since increased to ten by 2021, with the addition of Sichuan, Hunan, Hubei, Anhui, and Shandong to the list. Concurrently, the number of low-level areas has shown a gradual decline over the same period. These trends suggest a progressive enhancement in the e-commerce landscape of China, attributed to the ongoing processes of economic globalization.
3.2. The Dynamic Evolution of e-Commerce Level in China
3.2.1. The Dynamic Evolution of e-Commerce Development Distribution in China
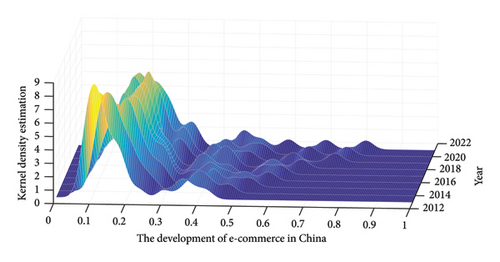
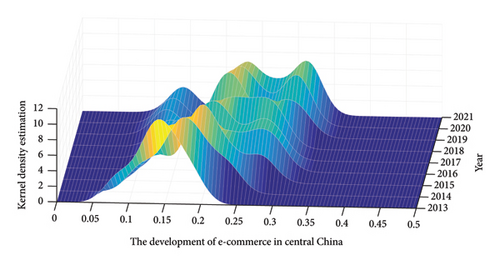
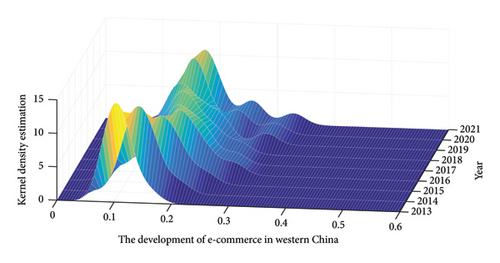
The kernel density analysis was conducted to assess the progress of e-commerce development across 31 provinces and regions in China, as depicted in Figure 7. The analysis revealed a distribution pattern characterized by major and minor peaks, indicating a multipeak distribution. The main peak was predominantly observed in regions with lower levels of e-commerce development, while the minor peak was concentrated in areas with higher e-commerce levels, indicating an imbalance in the e-commerce development landscape in China. The overall trend displayed a rightward shift, signifying a consistent enhancement in the general e-commerce level in China, aligning with the findings derived from the Dagum Gini coefficient analysis. The wave crest initially decreased and then increased, indicating a convergence of evaluation entities toward a similar level from a state of dispersion. Furthermore, a right-skewed phenomenon was observed, indicating that China’s e-commerce development is still at a relatively early stage.
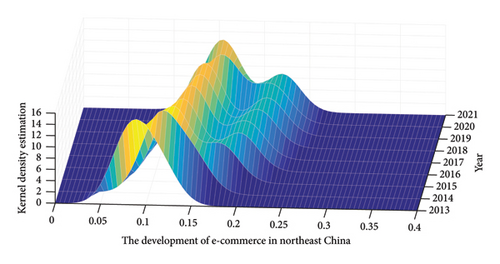
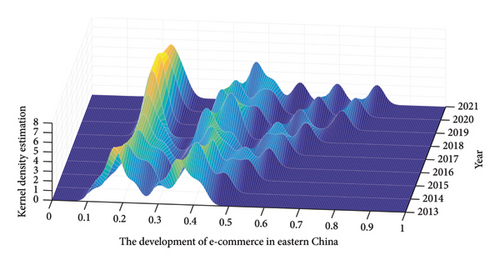
According to Figure 8, from 2013 to 2021, the level of e-commerce in northeast China showed a right-shifting trend. There were a major peak and a minor peak in this region, indicating that the region is two-peak distribution and had a certain polarization trend, and the northeast region showed a transition trend from single peak to double peak, indicating that the polarization phenomenon in the northeast region is gradually strengthening. The wave crest in the Eastern region moved to the right as a whole, indicating that the level of e-commerce in the eastern region was steadily improving. With the passage of time, the wave crest showed an increasing trend, and the wave crest width gradually widened, indicating that the aggregation level in the eastern region increased and gradually tended to the same level. The wave crest in the central region of China gradually moved to the right, indicating that the level of e-commerce in the central region is steadily improving. With the passing of time, the peak value in this region showed a decreasing trend, indicating that the aggregation level in this region decreased and the level of e-commerce tended to be dispersed. The wave crest in this region gradually transitions from single-peak distribution to two-peak distribution, indicating that the level of e-commerce in the central region of China had a certain polarization phenomenon and a certain unbalanced development phenomenon. It was evident that the evolution of e-commerce in the western area of China was shifting from an unimodal distribution to a bimodal distribution, indicating a gradual differentiation in e-commerce levels within the region. The main peak in the western region showed a distinct and consistent height, indicating a relatively stable variation in e-commerce levels across various areas. Moreover, the predominant peaks in the western region cluster mainly at lower levels of e-commerce advancement, indicating an overall low level of e-commerce development in the region.
3.2.2. The Long-Term Shift Trend of the Level of e-Commerce in China
Exploring the changing landscape of China’s e-commerce advancement, we computed the conventional Markov transfer probability matrix and spatial Markov transfer probability matrix based on the derived index of Chinese e-commerce level. Table 3 displays the conventional Markov transfer probability matrix representing the progression of e-commerce development in China. The table shows that the highest values in the matrix are located along the diagonal, indicating a high level of stability in the e-commerce development in China.
| t/t + 1 | I | II | III | IV |
|---|---|---|---|---|
| I | 0.716 | 0.284 | 0 | 0 |
| II | 0.048 | 0.677 | 0.274 | 0 |
| III | 0 | 0.051 | 0.831 | 0.119 |
| IV | 0 | 0 | 0.033 | 0.967 |
China’s e-commerce had a probability of 0.716 for being at a low level, 0.284 for experiencing an upward shift, 0.967 for reaching a high level, and 0.033 for undergoing a downward transition. The probabilities suggested a significant inclination toward club convergence in the developmental stage of China’s e-commerce. Moreover, China faced challenges in advancing its e-commerce levels, with probabilities of transitioning between different levels as follows: from low to medium-low level at 0.284, from medium-low to medium-high level at 0.275, and from medium-high to high level at 0.119. Conversely, transitioning downward in e-commerce development was less likely, with a 0.048 chance of remaining at a low level, no possibility of moving from a high level to a low level, and a 0.033 probability of transitioning from a high level to a medium level. The findings indicated a relatively stable e-commerce development landscape in China, with easier upward transitions across levels and more challenging downward movements.
Table 4 presents the spatial Markov transfer probability matrix illustrating the level of e-commerce development in China. The data revealed that the diagonal elements within the transition probability matrix were notably larger than the other elements. Despite accounting for spatial factors, the level of e-commerce development in China showed distinct characteristics of club convergence. As the spatial lag type increases, the stability of middle and low levels gradually strengthened. When the spatial lag type is low, the probability of downward transition in medium-high and high-level regions was 0. Conversely, as the spatial lag type increases, the likelihood of downward transition in medium-high and low-level regions decreased gradually, while the probability of upward transition in medium-high level regions increased progressively. It can be seen that the level of e-commerce in China has a certain promoting relationship with the spatial distribution.
| Type of spatial lag | I | II | III | IV | |
|---|---|---|---|---|---|
| I | I | 0.750 | 0.250 | 0 | 0 |
| II | 0 | 0.250 | 0.750 | 0 | |
| III | 0 | 0 | 1 | 0 | |
| IV | 0 | 0 | 0 | 1 | |
| II | I | 0.643 | 0.357 | 0 | 0 |
| II | 0.097 | 0.807 | 0.097 | 0 | |
| III | 0 | 0.0769 | 0.769 | 0.154 | |
| IV | 0 | 0 | 0.100 | 0.900 | |
| III | I | 0.857 | 0.143 | 0 | 0 |
| II | 0 | 0.600 | 0.400 | 0 | |
| III | 0 | 0.048 | 0.810 | 0.143 | |
| IV | 0 | 0 | 0 | 1 | |
| IV | I | 0.750 | 0.250 | 0 | 0 |
| II | 0 | 0.583 | 0.417 | 0 | |
| III | 0 | 0.042 | 0.875 | 0.083 | |
| IV | 0 | 0 | 0.028 | 0.972 | |
4. Discussion
4.1. Reasons for Regional Differences in e-Commerce Development From the Perspective of Temporal and Spatial Patterns
From the perspective of weight results of China’s e-commerce level index, the regional informatization level accounts for 51.17%. This is because throughout the entire e-commerce operation chain, from the digital management of enterprises, the online display and promotion of products, to consumers’ online search, comparison, and purchase decisions, all rely on information technology support. A higher number of computers and a better website construction level mean that enterprises and consumers have better hardware and software conditions to participate in e-commerce. For instance, Guangdong as a major manufacturing province, numerous enterprises are equipped with advanced information technology facilities and comprehensive enterprise website systems, which can empower them with a significant competitive advantage in the e-commerce marketplace, thereby underlining the essential role that the regional informatization level plays in the development of e-commerce [5]. The weights of secondary indicators such as the number of computers used per 100 people, the number of enterprise-owned websites, and the scale of e-commerce transactions also reflect their importance in e-commerce activities. Regions with a high number of computers used per 100 people have a greater possibility of residents participating in online shopping and network transactions, providing a broader user base for e-commerce. And rich website resources of enterprises help to enhance their online exposure and brand influence and promote transaction completion [21]. We can find that the scale of e-commerce transactions directly reflects the activity level and economic contribution of regional e-commerce.
In the temporal dimension, the growth of e-commerce in China from 2013 to 2021 shows an upward trend overall, but the starting points and growth rates vary among regions. East China has a relatively high initial level and a continuous growth trend, which is closely related to its early economic development foundation and the active adoption of information technology. In the early stage of e-commerce development, east China had more developed manufacturing and service industries, which had a strong demand for e-commerce as a new sales and business model. At the same time, east China had more advantages in attracting information technology talents and capital, which motivated the improvement of e-commerce infrastructure and the innovation of business models continuously. In contrast, the central and west China started from a relatively low level. Though they also showed growth, they were affected by various factors including economic development level and infrastructure, and the growth rate was still slow.
In the spatial dimension, the obvious “strong in the east and weak in the west” pattern is mainly due to the differences in regional economic development levels. East China has a more developed economy, higher urbanization level, and stronger consumption ability, which provides a broad market space for e-commerce. In east China, the agglomeration of industries also makes it easier to build a complete e-commerce ecosystem, including e-commerce platforms, delivery companies, and supporting service providers. Central China is in a stage of rapid development, and with the improvement of economic strength and infrastructure, e-commerce is also gradually developing. However, compared with east China, there are still certain gaps in many regions. West China is restricted by geographical location, economic foundation, and population density. Therefore, we can find the development level of e-commerce is relatively slow and the abilities of market demand and supply are relatively weak.
4.2. Reasons for Regional Differences in e-Commerce Development From the Perspective of Regional Differences
In the study, we can find that interregional differences cause the differences in e-commerce development levels among different regions in China. Different regions have different economic structures and development models. In east China, many regions will focus on high-tech and modern service industries, which can help enterprises have a high degree of digitalization and raise the awareness of e-commerce application. They actively use e-commerce platforms to expand markets and improve efficiency. For example, many manufacturing enterprises in the Yangtze River Delta and Pearl River Delta regions have realized the transformation and upgrading of production and sales models through e-commerce. The Gini coefficient in northeast China first decreased and then increased, because of heavy industry. In the initial stage of e-commerce development, the transformation of traditional industries faced many challenges, and some cities and enterprises did not pay enough attention to e-commerce, which consequently led to a state of underdevelopment. In recent years, with some cities such as Dalian and Changchun actively promoting industrial upgrading and e-commerce development, some enterprises have made certain breakthroughs in the e-commerce field. For example, the number of seafood e-commerce enterprises in Dalian has gradually increased. However, due to the late start of development, the internal differences still change. In central China, the industrial structure is in the process of adjustment and upgrading. Although there are some traditional industries, the application of e-commerce in some emerging industries is also gradually increasing. However, due to the lack of leading industries and the relatively backward infrastructure in some areas, the development of e-commerce is still limited. West China has a relatively large proportion of traditional agriculture and resource-based industries, and the digital transformation ability of enterprises is weak. In addition, the geographical environment and transportation conditions in west China also increase the cost and difficulty of e-commerce logistics, which restricts the development of e-commerce.
For the changes in differences among different regions, the gap between the eastern and western regions has gradually narrowed. On the one hand, under the guidance of policies such as the Western Development and the Belt and Road Initiative, the state has increased investment in infrastructure construction in the western region, improved logistics and communication conditions, and promoted the development of e-commerce in the western region. On the other hand, during the process of upgrading to high-end manufacturing and digital economy in the eastern region, the growth rate of e-commerce has slowed down. The large gap between the northeast region and other regions is mainly due to its single industrial structure, the difficulty of transforming traditional industries, the relatively backward application of new e-commerce models and technologies, and the influence of factors such as population outflow and insufficient market vitality, resulting in weak investment and innovation capabilities in the e-commerce field.
Moreover, the differences in policy support among regions also have an impact on e-commerce development. East China has relatively more preferential policies and financial support for e-commerce, which promotes the development of e-commerce enterprises. The central, northeast, and west China are also increasing policy support, but there is still a certain gap compared with the east China.
4.3. Reasons for Regional Differences in e-Commerce Development From the Perspective of Dynamic Evolution Trends
From the perspective of dynamic evolution, the stability and club convergence characteristics of e-commerce development levels in different regions are also one of the reasons for the differences. East China has a high level of stability and a strong convergence trend, which indicates that the development environment and model of e-commerce in east China are relatively mature. Enterprises in the region can continuously learn and innovate in the development process and promote the improvement of the overall e-commerce level through cooperation and competition. The central and west China are in a stage of development and transformation, and the polarization phenomenon and unstable development trend indicate that there are still many problems and challenges in the development process. For example, the lack of professional e-commerce talents, the backwardness of technology application, and the imperfect market mechanism all lead to the instability of e-commerce development in these regions.
In general, the differences in e-commerce development among different regions in China are the result of the combined action of multiple factors. To promote the coordinated development of e-commerce in different regions, it is necessary to strengthen infrastructure construction, improve policy support, and promote the transformation and upgrading of industrial structures.
5. Research Conclusions
- 1.
From a primary indicator standpoint, the predominant factor influencing the extent of e-commerce in China was the regional level of informatization, accounting for 51.17% of the overall impact. In terms of secondary indicators, the key factors included the ratio of computers per 100 individuals, the quantity of enterprise-owned websites, and the volume of e-commerce transactions, with respective weights of 0.151, 0.141, and 0.128.
- 2.
Between 2013 and 2021, there had been a consistent upward trajectory in the development of e-commerce in China. The average level of green finance advancement in the country stood at 0.237, indicating a relatively low overall level. Notably, there were distinct regional disparities evident, with a pattern of stronger development observed in eastern regions compared to western areas, as well as a disparity between coastal and inland regions.
- 3.
From 2013 to 2021, there had been a discernible pattern in the evolution of e-commerce levels in China, characterized by an initial narrowing followed by an expansion of the overall gap. The e-commerce landscape in China had exhibited an average distribution trend with a value range of 0.200–0.290, indicating a moderate level of e-commerce development but with noticeable disparities in distribution. Regional disparities in China’s e-commerce levels had shown a tendency toward convergence, while variations within regions have been increasing. Analysis of subgroup distributions revealed that the intragroup Gini coefficient in the eastern and western regions had shown minimal fluctuations with a consistent upward trend. In contrast, the northeast region witnessed an initial decline followed by an increase in the intragroup Gini coefficient, while the central region demonstrated an unstable upward trend with significant fluctuations. The intergroup Gini coefficient between northeast China and the other three regions was found to be higher compared to intergroup differentials among other regions, indicating significantly larger gaps between northeast China and the other regions. Notably, the disparities between the eastern and western regions have been gradually diminishing. Regional disparities in China’s e-commerce levels primarily stem from regional variations, with these differences contributing to an average rate of 72.98%.
- 4.
From 2013 to 2021, the level of e-commerce in China had increased steadily, but the dynamic distribution of the e-commerce level in the four regions of China presents a two-peak or multipeak distribution, indicating that there is a multipolarization distribution trend in the four regions of China, and the major peaks were mostly concentrated in the regions with low levels, and there are still large differences between regions, and the spatial imbalance was still prominent.
- 5.
From 2013 to 2021, the level of Chinese e-commerce had strong stability. Using the Markov chain analysis method, we could see that the level of e-commerce in China had a strong level of club convergence. Considering the spatial factors, the level of China’s e-commerce still had a strong convergence characteristic, and there was a certain relationship between the level of China’s e-commerce and the spatial distribution.
6. Policy Recommendations
- 1.
Strengthen the construction of e-commerce infrastructure and promote the development of e-commerce digital intelligence. Research indicates that the e-commerce landscape in China exhibits a spatial–temporal distribution characterized by strength in the eastern regions and weakness in the western areas. To address this imbalance, it is crucial for the government to prioritize and accelerate the development of e-commerce infrastructure in the western inland regions. Specifically, substantial investments should be directed toward improving transportation networks. For example, constructing and upgrading highways and railways to ensure seamless connectivity between production areas and markets, facilitating the smooth flow of goods. In logistics, establishing modern logistics hubs equipped with advanced warehousing and distribution facilities can enhance the efficiency of product storage and delivery. Additionally, enhancing network services by increasing the coverage and speed of broadband and mobile networks is essential. This can be achieved through the installation of more base stations in remote areas and the adoption of advanced network technologies such as 5G. By strengthening the integration of digital payment systems with e-commerce platforms, consumers and businesses in the western region can enjoy more convenient and secure payment options, further promoting e-commerce activities.
- 2.
Strengthen e-commerce brand building, and promote the deep integration of the real economy and e-commerce. The study indicates a significant disparity in the extent of e-commerce adoption across different regions in China. For traditional manufacturing enterprises, they can be guided to establish unique brands that emphasize their regional characteristics and product quality. Through e-commerce platforms, these enterprises can showcase their products to a wider customer base, accept online reservations, and offer exclusive discounts to attract consumers. At the same time, by setting up offline experience stores or showrooms, consumers can have a hands-on experience of the products before making a purchase decision, which helps to build trust and loyalty. This approach not only helps enterprises expand their market share but also promotes the transformation and upgrading of traditional industries. In the process of promoting O2O integration, it is necessary to focus on the development of emerging industries in different regions. For example, in regions rich in agricultural resources, e-commerce can be used to develop the agricultural product processing and sales industry, creating new economic growth points.
- 3.
Standardize the market supervision of e-commerce and improve e-commerce laws and regulations. The development of e-commerce industry started late but fast, and it is inevitable that there will be some vicious competition phenomena that violate industry ethics. In regions with a high density of e-commerce activities, such as the eastern region, regulatory authorities should focus on leveraging advanced technologies such as big data and artificial intelligence to establish intelligent monitoring systems. These systems can continuously track and analyze transaction data in real time, quickly identifying abnormal transactions and potential fraud or deceptive advertising behaviors. For example, by monitoring price fluctuations and trading volumes of products, any sudden and abnormal changes can trigger an alert for further investigation. In regions where e-commerce is in the process of development, such as the central and western regions, while strengthening basic supervision, it is necessary to provide more support and guidance to small- and medium-sized enterprises. This can include organizing training sessions on e-commerce laws and regulations, helping enterprises understand and comply with the rules, and avoiding legal risks. At the same time, establishing a simplified and efficient complaint-handling mechanism can ensure that consumers’ rights are protected in a timely manner, enhancing consumers’ confidence in e-commerce.
7. Implications for Future Research
Due to incomplete data availability at the current stage, there may be delays and deficiencies in the ongoing research related to the state of e-commerce in China. Upon acquiring the necessary data, we intend to promptly enhance and update the e-commerce landscape across various regions in China. Presently, developed nations have more advanced expertise in e-commerce development, with relevant businesses and individuals demonstrating a relatively sophisticated approach to e-commerce innovation and infrastructure. It is vital for us to learn the advanced experience according to local conditions and improve the development level of e-commerce in China. Through our research, we have identified a significant gap in the integration between e-commerce and the real economy sector, as well as notable spatial disparities in e-commerce distribution across various regions. Therefore, it is essential to enhance the corresponding investigative efforts and provide recommendations based on empirical evidence to foster the growth of e-commerce across diverse regions in China.
From the microperspective, the research studies on China’s provinces have lots of limitations and shortcomings, including unreasonable measurement and inexact spatial heterogeneity. It may make the results of the coarse particle size analysis fuzzy. In the future, we will concentrate on the main cities, such as provincial capitals, special economic zones, industrial cities, and other vital cities, assisting us analyze the differences and characteristics of the e-commerce development level. By collecting the data about the industrial structure, we can know the trend of using e-commerce in various enterprises, which can help us detect the reasons about the different cities’ e-commerce development level and find the unique advantages and positions of e-commerce industry chain in various cities, in order to support and improve the development of e-commerce.
Ethics Statement
The authors have nothing to report.
Consent
The authors have nothing to report.
Conflicts of Interest
The authors declare no conflicts of interest.
Author Contributions
Conceptualization, Jingrong Li and Juntong Liu; methodology, Juntong Liu; software, Juntong Liu; validation, Jingrong Li; formal analysis, Juntong Liu; data curation, Jingrong Li; writing – original draft preparation, Juntong Liu; writing – review and editing, Jingrong Li; visualization, Jingrong Li and Juntong Liu; supervision, Jingrong Li; project administration, Jingrong Li; funding acquisition, Juntong Liu All authors have read and agreed to the published version of the manuscript.
Funding
This research was funded by the National Key Research and Development Program of China (number 2021YFF0601005), National Undergraduate Innovation and Entrepreneurship Project (number 202410512014), the 2023 annual project of Hubei Educational Science Planning (number 2023GB284) and Educational Research Project of Hubei Institute of Higher Education in 2023 (number 2023XD114). Juntong Liu is a main researcher in the National Key Research and Development Program of China project and National Undergraduate Innovation and Entrepreneurship Project. Jingrong Li is a main researcher in the 2023 annual project of Hubei Educational Science Planning and educational research project of Hubei Institute of Higher Education in 2023.
Acknowledgments
We claim that we do not use the AI software.
Open Research
Data Availability Statement
Data are available on request to the authors. We use Excel to calculate the development level of e-commerce and MATLAB software to measure the Dagum Gini coefficient, the Kernel density, and spatial Markov matrix.


