Identification of Subthreshold Depression Based on fNIRS–VFT Functional Connectivity: A Machine Learning Approach
Abstract
Background: Subthreshold depression (SD) is regarded as a prodromal stage and a substantial risk factor for major depressive disorder (MDD). The timely identification of SD is of critical clinical significance. This study aimed to develop a machine learning (ML) classification model for the identification of individuals with SD using functional near-infrared spectroscopic imaging (fNIRS) and the verbal fluency task (VFT).
Methods: This study recruited a total of 70 participants with SD and matched 73 healthy controls (HCs) to differentiate between the two groups based on functional connectivity (FC) features during fNIRS–VFT, using an interpretable random forest (RF) classification model.
Results: The RF model demonstrated an area under the curve (AUC) of 0.77, an accuracy (ACC) of 75.86%, a sensitivity of 75.00%, a specificity of 76.00% and an F1 score of 0.75 for identifying participants with SD. The highest-ranked FC features, in terms of importance, were identified between Channel (CH) 26 (the right frontal eye fields (FEFs)) and CH 30 (the right FEF), CH 3 (the left premotor and supplementary motor cortex (PMC-and-SMA)) and CH 42 (the right PMC-and-SMA), as well as CH 26 (the right FEF) and CH 32 (the right primary somatosensory cortex (PSC)).
Conclusion: The RF model has the capacity to effectively classify individuals with SD efficacy based on the abnormal FC features of fNIRS–VFT, particularly in the right FEF, bilateral PSC and right PMC-and-SMA. The findings of this study have provided a foundation for large-scale screening of SD populations, offering promising opportunities for the early diagnosis and prevention of MDD.
1. Introduction
The prevalence of major depressive disorder (MDD) continues to increase, representing one of the most significant challenges to public health worldwide [1–3]. Subthreshold depression (SD) is defined as a subclinical depressive state where individuals experience some depressive symptoms for at least 2 weeks, but do not meet the clinical diagnostic criteria for MDD, regarded as the prodromal stage and a significant risk indicator for MDD [4]. A prevalence rate of 32% for SD was reported among university students in China [5]. Moreover, two large-sample studies (n = 30,034) found that the closer the level of depression was to a threshold, the higher the associated risk of dysfunction and suicide [6, 7]. Therefore, it is imperative to enhance the identification, diagnosis and monitoring of SD in the college student population. This is not only a crucial step in kerbing the undesirable developmental trend of MDD but also a highly urgent practical necessity.
Currently, the principal methodology for diagnosing and identifying SD is based on clinical investigations and interviews ([8], p. 202). However, this subjective method is influenced by the heterogeneity of individuals’ functional and behavioural performance, which presents challenges for the assessment and continuous monitoring of large populations [9]. Consequently, there is a pressing need to develop an objective, cost-effective and efficient technological tool that can facilitate large-scale identification and monitoring of SD. From the perspective of neuroimaging, functional near-infrared spectroscopic imaging (fNIRS) technology has the potential to offer considerable advances. As a promising tool, fNIRS has the advantage of providing continuous, real-time monitoring of the cerebral haemodynamic response and changes in blood oxygen levels, thus, enabling a deeper understanding of functional changes in the brain. Previous studies have demonstrated the considerable value of fNIRS in the early diagnosis, assessment and monitoring of depression [10]. The verbal fluency task (VFT) is an operationally simple cognitive task that, in conjunction with fNIRS, has been widely used to probe the activity of the cerebral cortex in depressed individuals, thereby, reflecting their cognitive neural function [9]. The evidence from fNIRS–VFT studies has indicated that the VFT is able to activate the brain regions of healthy control (HC), such as frontal, parietal and temporal cortex [10], which is more broadly than the classical N-back and Stroop tasks that are typically used to assess executive functioning [11, 12] and that it is involved in a variety of complex human cognitive processes such as executive function and working memory [13]. Previous studies have revealed that individuals with SD exhibited significant deactivation in specific brain regions, including the bilateral dorsolateral prefrontal cortex (DLPFC), the bilateral dorsal frontal pole cortex and the bilateral superior temporal cortex [14]. Hence, it can be concluded that fNIRS–VFT may be more suitable for brain function studies in individuals with SD, especially when the study involves cross-brain region and brain network level.
The advent of sophisticated data analysis tools has prompted an increasing number of researchers to propose that the onset and progression of depression may be more likely to manifest as abnormal connectivity within brain networks [15,–18]. As an effective indicator of the correlation of neural activities between different brain regions, functional connectivity (FC) is of great significance for the in-depth understanding of the brain’s information processing and the synergistic work between different brain regions [19]. In fact, abnormal FC has been recognised as a reliable neurobiological marker for the clinical diagnosis of severe psychiatric disorders such as MDD and schizophrenia [20]. Nevertheless, only two studies have employed fNIRS–VFT to investigate FC features in the brains of individuals with SD [8, 21]. These studies have found that FC strength is diminished in specific brain regions, such as between the orbitofrontal and the dorsolateral prefrontal region, as well as the dorsolateral prefrontal and the globus region.
An increasing number of studies have demonstrated the existence of pathophysiological mechanisms in SD that are similar to those of MDD [22–24], especially the abnormal FC [10, 25–27]. These studies subsequently pointed to an association between the abnormal FC in the frontotemporal lobe and depressive symptoms in SD [28]. However, these studies are based on conventional statistical analysis methods, such as tests for differences between groups and correlation analysis. Although these methods have ensured a certain degree of reproducibility of results, the resulting models frequently reflect only characteristics of the current sample, which may limit the generalisability of the findings [29, 30].
As a novel statistical technique, machine learning (ML) has developed rapidly in recent years and has been recognised as a valuable tool for clinical diagnosis [31]. ML is capable of learning from data and automatically iterating to predict and identify unknown data, thereby, enabling the performance of tasks such as classification and regression [32]. The increasing integration of ML and neuroimaging techniques has enabled the development of individual-level classification and prediction models based on the functional level of the brain [33–35]. This is crucial for the clinical diagnosis of MDD, schizophrenia and other psychiatric disorders. For example, Chen et al. [28] combined the random forests (RFs) algorithm with resting-state FC features and successfully achieved an accuracy (ACC) of 73.1% ± 2.8% in a four-way classification task that identifying the HC group, nonpsychotic MDD, psychotic MDD, and schizophrenia. In a review of relevant studies from the last decade, Eken, Nassehi, and Erogul [36] demonstrated that combining ML with fNIRS may prove more beneficial than functional magnetic resonance imaging (fMRI) in identifying potential biomarkers in specific cortical regions associated with disorders. Nevertheless, to the best of our knowledge, no study has yet combined ML with fNIRS signals to explore the potential of FC features of the cortex in identifying individuals with SD when completing cognitive tasks.
In summary, the objective of this study was to construct a classification model using the ML method to identify individuals with SD based on fNIRS–VFT. Specifically, we aimed to explore the distinctive FC during the VFT, which could effectively distinguish individuals with SD, thus, facilitating future large-scale screening and diagnosis of SD.
2. Participants and Methods
2.1. Participants
The study was approved by the Human Subjects Protection Committee of East China Normal University (HR-427-2022). Participants were recruited from East China Normal University in Shanghai, China, between August 2022 and June 2023. After receiving a complete study description, all participants provided written informed consent.
We recruited 77 participants with SD (7 males and 70 females) for the study. Due to the significant gender imbalance, only female participants were included in the SD group to eliminate potential confounders factors and ensure the reliability of the results. Seventy-three HC participants were selected and matched accordingly. Exclusion criteria for participants were as follows: (1) left-handedness; (2) colour vision deficiency or impaired colour perception; (3) history of depression or other mental illness; (4) history of traumatic brain injury or other organic brain disease; (5) substance-related or addiction disorders; (6) history of major physical illness; (7) pregnancy or lactation; (8) non-native Chinese speakers; (9) inability to complete the VFT.
2.2. Depression Scale
Following the previous study [37], we defined ‘SD’ as the presence of two to five depressive symptoms for at least 2 weeks. Depressive symptoms were assessed using the Beck Depression Inventory-II (BDI-II) [38]. The BDI-II consists of 21 items, each rated on a four-point Likert scale ranging from 0 (asymptomatic) to 3 (highly symptomatic). It has demonstrated better internal consistency in Chinese college students (Cronbach’s α = 0.85) [39] and exhibits high stability across gender, race and ethnicity [40].
In this study, all participants were assessed for depressive symptoms using the BDI-II at two time points, with an interval of 14 days between assessments. Those with BDI-II scores of 14–28 with both assessments were identified as SD, while those with scores below 14 were included in the HC group.
2.3. Activation Task
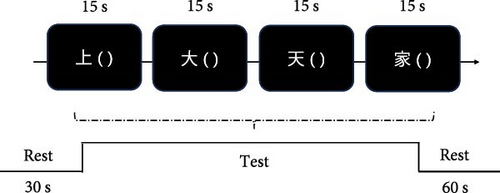
We conducted a Chinese version of the VFT similar to previous studies [41, 42]. The VFT consisted of three distinct parts: a 30-s prerest period, a 60-s task period, and a 60-s postrest period. During the pre- and postrest periods, participants were required to recite aloud the numerical sequence ‘1, 2, 3, 4 and 5’ on each occasion. During the 60-s task period, participants were asked to construct as many words as possible, starting with four common Chinese characters, such as ‘上’, ‘大’, ‘天’ and ‘家’. The given Chinese characters were changed every 15 s. The number of unique words uttered during the task period was used to measure task performance. To control for the independent variable, all participants were presented with the same character cue and in the same order (Figure 1).
2.4. fNIRS Data
2.4.1. Data Acquisition
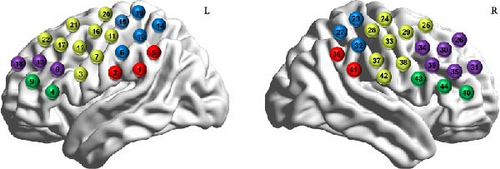
During the VFT, a 44-channel (CH) fNIRS system (ETG-7100, Hitachi Medical Corporation, Tokyo, Japan) was used to continuously monitor and record the fNIRS signals of participants. The system had wavelengths of 695 and 830 nm, a sampling rate of 10 Hz and employed two 3 × 5 probe boards with a spacing of 3 cm between the probes to cover the left and right frontal, temporal and parietal regions, respectively. The region between each pair of emitters and detectors is called a CH, and each probe consists of 22 CHs of eight emitters and seven detectors, for a total of 44 CHs of fNIRS signals monitored.
To ensure that the spatial positions of the probes were accurately recorded, we used a three-dimensional localiser to calibrate four key reference points (Nz, Cz, AL and RL). All CHs were mapped to the Montreal Neurological Institute (MNI) space [43] by virtual alignment [44] and using the NIRS–SPM [45] and projected onto the Brodmann cortical partitioning template [46]. We used the maximum overlap probability method to obtain a more accurate analysis of cortical activity in the monitored brain regions. These CHs were classified into the following regions: the supramarginal gyrus (SMG) part of Wernicke’s area, the primary somatosensory cortex (PSC), the premotor and supplementary motor cortex (PMC-and-SMA), the DLPFC and the frontal eye fields (FEFs). More details regarding the precise locations of the CHs can be found in Figure 2.
2.4.2. Data Preprocessing
The raw fNIRS data were analysed using the HOMER 2 toolbox [47]. The steps include converting the raw light intensity data into optical density values, detecting motion artefacts in each CH [48] and correcting them using spline interpolation [49]. The data were then filtered in the range of 0.05–0.1 Hz using a bandpass filter [50]. The modified Beer–Lambert law was then used to convert the filtered optical data into oxyhaemoglobin (HbO), deoxyhaemoglobin (HbR) and total haemoglobin (HbT) concentrations [51]. As changes in HbO concentration have been shown to reflect better individual cortical activation related to cognitive tasks [52], we focused only on changes in HbO concentration.
2.5. Feature Extraction and Simplification
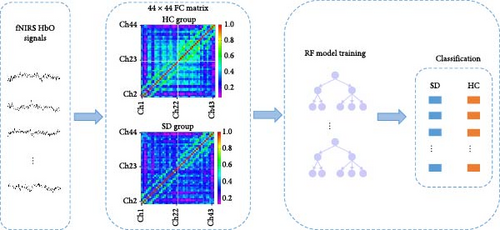
Figure 3 shows the flowchart of SD recognition based on fNIRS spatial features. After preprocessing, the HbO concentration change curves of all individuals in each CH at 60 s during the task execution phase were extracted. Then, a 44 × 44 FC matrix of all SD and HC participants was constructed using the Pearson correlation coefficient. Finally, a classifier was trained using the RFs algorithm based on the FC features of all participants.
Referring to the previous study [53], this study was conducted to maximise the data-driven nature of the study with the completeness of the FC data for a more accurate identification of the SD. At the same time, the advantages of the RF algorithm itself were taken into account, such as the excellent and flexible ability to cope with the noise data as well as the ability to identify the features of the high-dimensional data. Therefore, this study did not apply additional simplification methods, such as feature filtering or dimensionality reduction, for FC features. More detailed information about the RF algorithm can be found in Section 2.6.
2.6. ML Model
2.6.1. Model Selection
In this study, the RF algorithm is implemented using the Scikit-learn library in Python.
RF is an advanced ensembles algorithm with a flexible hyperparameter tuning strategy [54], which is able to effectively optimise the impact of features on the modelling process, thus, improving the performance and stability of the model. The algorithm is capable of generating and processing multiple decision trees in parallel and automatically performs feature selection based on the amount of information in the features in each decision tree [55]. This built-in feature selection mechanism helps the RF algorithm to focus on the most informative features when dealing with high-dimensional feature data such as FC, in order to reduce the interference of redundant features in the model [54]. In addition, considering that the RF algorithm possesses advantages over other methods such as strong robustness against noise, and the ability to capture complex nonlinear relationships among data based on the decision tree structure [56], it can effectively deal with fNIRS anomalous FC data generated due to noise or interference (e.g., motion artefacts, signal loss, etc.) during the experiment.
Specifically, this study divides the dataset into a training set (80%) and a test set (20%). The RF algorithm generates numerous decision trees based on the training set and constructs a predictive model through cross-validation and hyperparameter grid search. The final predictive model is then evaluated using performance metrics such as ACC on the test set.
2.6.2. Modelling Process
During the modelling process, this study employed sixfold cross-validation combined with grid search to mitigate overfitting. The optimal hyperparameter configuration was determined within predefined ranges, resulting in the following settings: ‘max_depth’: none, ‘min_samples_leaf’: 2, ‘min_samples_split’: 2 and ‘n_estimators’: 100. These hyperparameters are defined and explained bellow:
Setting ‘max_depth’ to none allows the decision tree to expand fully until all leaves are pure or the number of samples in a leaf falls below the value specified by ‘min_samples_split’. While this approach enables the model to capture complex patterns in the data, it also increases the risk of overfitting.
‘min_samples_leaf’ specifies the minimum number of samples required for a leaf node. In this study, the value was set to 2, ensuring that each leaf node contains at least two samples. This constraint helps to reduce the likelihood of overfitting by preventing overly specific splits.
‘min_samples_split’ defines the minimum number of samples required to split an internal node. A value of 2 was chosen, meaning that each internal node must contain at least two samples to be considered for splitting. Lowering this value may improve the model’s ability to capture finer details in the training data, although it may increase the risk of overfitting.
‘n_estimators’ indicates the number of decision trees to be constructed in the forest. A value of 100 was used, meaning that the model builds 100 decision trees. The final classification predictions are made using soft voting, aggregating the output of all trees.
2.6.3. Model Evaluation
The most commonly used and accepted metrics to evaluate the performance of the RF classifier model are ACC, sensitivity (true positive rate (TPR)), specificity (true negative rate (TNR)), F1 score and area under the curve (AUC). The following definitions apply to the above metrics:
To explore the mechanism of the RF in predicting participants with SD, this study used the mean decrease in impurity (MDI) method to evaluate the importance of each feature in the model’s classification ACC [57]. The MDI method quantifies the importance of each feature by calculating the average decrease in impurity (such as Gini impurity or entropy) achieved when a particular feature is used for splitting during tree-building. Features with higher MDI values contribute more to the model’s predictive power.
3. Result
3.1. Demographics, BDI-II Scores and VFT Behavioural Performance
The statistical analysis was performed using the SPSS version 23 (IBM, Armonk, NY, USA).
The results of the independent samples t-test indicated that there are no statistically significant differences between the SD and HC groups with regard to age, education level and VFT behavioural performance. The BDI-II scores of the SD group were significantly higher than the HC group (Table 1).
| Variant | HC group (n = 73) | SD group (n = 70) | t | p |
|---|---|---|---|---|
| Age (years) | 20.55 ± 2.34 | 20.30 ± 2.00 | 0.683 | 0.496 |
| Education level (years) | 14.55 ± 2.04 | 14.46 ± 1.79 | 0.261 | 0.795 |
| BDI-II scores | 4.62 ± 3.89 | 21.10 ± 4.13 | −24.593 | <0.001 ∗∗∗ |
| VFT performancea | 16.23 ± 4.18 | 17.54 ± 4.19 | −1.872 | 0.063 |
- Abbreviations: BDI-II, Beck Depression Inventory-II; HC, healthy control; SD, subthreshold depression; VFT, verbal fluency task.
- ∗∗∗p < 0.001.
- aTotal number of correct and unrepeated words during VFT.
3.2. Functional Connectivity Analysis
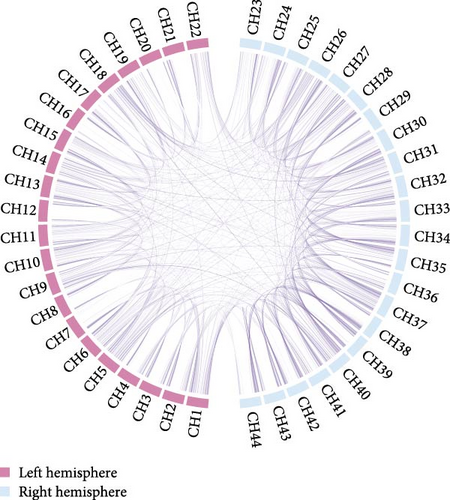
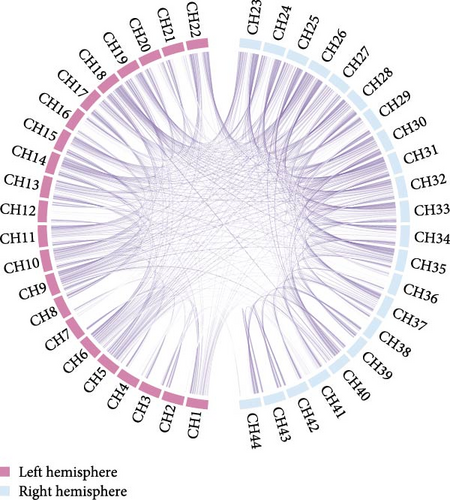
An average FC chord plot was constructed for the SD and HC groups to provide a visual representation of the differences between groups regarding FC features (Figure 4). The SD group exhibited a notable reduction in FC strength compared to the HC group.
3.3. Classification Results
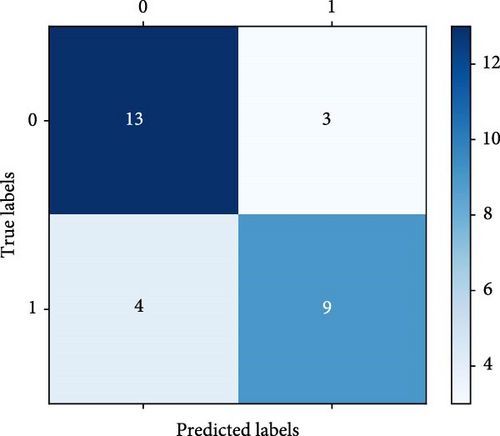
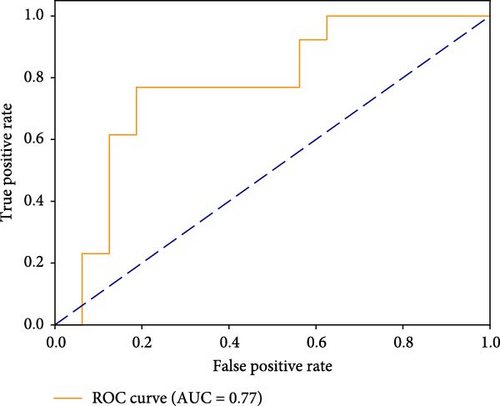
The FC of each CH was analysed between the two groups, revealing the FC features derived from the fNIRS–VFT. The findings provided a valuable foundation for predicting the presence of SD. Table 2 presents the performance metrics of the RF model for identifying participants with SD, achieving an ACC of 75.86%. The result indicated that the model correctly identified individuals with SD in 75.86% of cases. Additionally, the classification model demonstrated a TNR of 76%, indicating that it correctly classified 76% of HC individuals. The TPR of the model was 75%, reflecting its ability to accurately identify 75% of participants with SD within the actual SD group. Figure 5 shows the confusion matrix and the ROC curve.
| Model | AUC | ACC (%) | TPR (%) | TNR (%) | F1 score |
|---|---|---|---|---|---|
| RF | 0.77 | 75.86 | 75 | 76 | 0.75 |
- Note: F1 score represents a balance between precision and recall.
- Abbreviations: ACC, accuracy; AUC, area under the curve; RF, random forest; SD, subthreshold depression; TNR, true negative rate; TPR, true positive rate.
3.4. Feature Importance Ranking
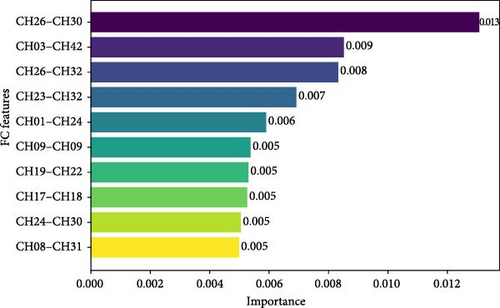
Figure 6 shows the ranking of FC feature importance as determined by the RF model, illustrating the top 10 CH pairs that contribute to the model’s performance. The most significant FC features were CH26 (the right FEF) and CH30 (the right FEF). The next highest FC features were CH3 (the left PMC-and-SMA) and CH42 (the right PMC-and-SMA). The third highest FC features were CH26 (the right FEF) and CH32 (the right PSC).
4. Discussion
In this study, a novel RF model was constructed using FC features based on fNIRS–VFT, and its ACC and robustness in identifying individuals with SD were verified. The results of the RF model demonstrated that the model achieved an AUC of 0.77, an ACC of 75.86%, a sensitivity of 75%, a specificity of 76% and an F1 score of 0.75. A further analysis of the feature’s importance revealed that specific FC features made a significant contribution to the model’s predictive performance, including CH26 (the right FEF) and CH30 (the right FEF), CH3 (the left PMC-and-SMA) and CH42 (the right PMC-and-SMA) and including CH26 (the right FEF) and CH32 (the right PSC).
The performance of the RF model established in this study for diagnosing psychiatric disorders, particularly in hyperparameter optimisation, was comparable to that reported in previous studies combining fNIRS–VFT and ML techniques. Li et al. [58] achieved comparable classification performance for MDD using an SVM model. The approach employed features such as the integral value of changes in HbO concentration during fNIRS–VFT and the centre of mass value. It is noteworthy that several studies have reported superior performance in the MDD classifications compared to our study. A previous study distinguishing MDD from HC demonstrated that an SVM classifier achieved a mean AUC of 0.82 (95% CI: 0.75–0.90), a mean ACC of 82.02% ± 10.04%, a sensitivity of 70.00% ± 18.6% and a specificity of 94% ± 7.32% [59]. Indeed, accurately identifying SD through the construction of RF models presents a challenge due to the clinical characteristics of SD and MDD [60], as well as the fact that the structure and function of the brain exhibit continuity [61, 62]. In summary, our study findings indicated that the RF algorithm model based on the FC features of fNIRS–VFT has the potential to serve as a clinical diagnostic tool for SD and to facilitate the early screening of MDD.
Based on the feature importance rankings calculated from the MDI values, this study identified that the top three FC features were primarily concentrated in the PMC-and-SMA, FEF and PSC brain regions. Previous studies have demonstrated that patients with MDD exhibited decreased resting-state FC of the FEF with the middle occipital gyrus compared to HC [63]. Additionally, several studies have reported functional abnormalities in the PMC-and-SMA during the completion of various cognitive tasks [64–66]. These results are consistent with our findings of frontal lobe abnormalities in the FEF and the SMA in SD, indicating that the frontal lobes are essential in the pathogenesis of depression. Moreover, both the PMC-and-SMA and FEF are fundamental to cognitive processes. The PMC-and-SMA play an essential role in executive functions and in integrating emotional, behavioural and cognitive functions [67]. The FEF is closely associated with higher-order cognitive functions and behaviours, including language, self-awareness and emotion [68–72]. These observations indicated that abnormal FC in the FEF and PMC-and-SMA regions in individuals with SD may serve as a crucial pathological indicator of cognitive impairment [21].
A recent fNIRS study has observed significantly reduced activation in the prefrontal cortex and inferior parietal regions in individuals with MDD compared to HC during VFT performance [10]. The FEF is located at the prefrontal–parietal junction [73] and is a critical component of the frontoparietal network. This network is associated with executive functions, cognitive flexibility and attentional modulation [74, 75]. It is hypothesised that the FEF mediates FC within the frontoparietal network, regulating the activities of the PSC in a top-down manner, particularly in contexts involving language processing [76]. In particular, the VFT process, which pertains to language processing, revealed that patients with depression exhibited impairments in language processing [77]. The FEF appeared to guide language-related selective attentional information, including visual and auditory inputs, before transmitting this information to the PSC, which facilitates the fluency of language production during tasks like the VFT [76, 78]. Impairments in this mechanism may provide an explanation for the language processing deficits observed in individuals with depression during the VFT. We hypothesised that individuals with SD, similar to those with MDD, may demonstrate aberrant FC between the FEF and PSC, which may contribute to impaired language processing abilities. This result not only validates the abnormal FC with continuity in the development of HC–SD–MDD, but also further emphasises the importance of timely identification and diagnosis of SD for the early diagnosis and prevention of MDD at the cognitive neuroscience level.
4.1. Limitations
There were several limitations in the present study. First, all participants were female, which may limit the generalizability of the findings. Given the influence of gender on brain structure and function, future studies should aim to include a balanced representation of male and female participants and build a small-sample external validation test set to enhance the applicability of the results. Second, the considerable volume and high dimensionality of the FC data presented significant analytical challenges. Future research could incorporate a feature screening step to simplify the complex and large FC data or apply deep learning algorithms to capture deeper, potentially more informative features. These approaches may further improve the model’s recognition performance.
5. Conclusion
This study is the first to focus on fNIRS–VFT FC features combined with ML methods to develop an effective model. The fNIRS–VFT FC features can accurately identify individuals with SD, especially in the right FEF, bilateral PSC and right PMC-and-SMA. The findings of this study have provided a foundation for large-scale screening of SD populations, offering promising opportunities for the early diagnosis and prevention of MDD.
Conflicts of Interest
The authors declare no conflicts of interest.
Funding
This work was supported by the National Social Science Fund of China (21BTY094).
Open Research
Data Availability Statement
The data that support the findings of this study are available from the corresponding author upon reasonable request.


