Using Speech Features and Machine Learning Models to Predict Emotional and Behavioral Problems in Chinese Adolescents
Abstract
Background: Current assessments of adolescent emotional and behavioral problems rely heavily on subjective reports, which are prone to biases.
Aim: This study is the first to explore the potential of speech signals as objective markers for predicting emotional and behavioral problems (hyperactivity, emotional symptoms, conduct problems, and peer problems) in adolescents using machine learning techniques.
Materials and Methods: We analyzed speech data from 8215 adolescents aged 12–18 years, extracting four categories of speech features: mel-frequency cepstral coefficients (MFCC), mel energy spectrum (MELS), prosodic features (PROS), and formant features (FORM). Machine learning models—logistic regression (LR), support vector machine (SVM), and gradient boosting decision trees (GBDT)—were employed to classify hyperactivity, emotional symptoms, conduct problems, and peer problems as defined by the Strengths and Difficulties Questionnaire (SDQ). Model performance was assessed using area under the curve (AUC), F1-score, and Shapley additive explanations (SHAP) values.
Results: The GBDT model achieved the highest accuracy for predicting hyperactivity (AUC = 0.78) and emotional symptoms (AUC = 0.74 for males and 0.66 for females), while performance was weaker for conduct and peer problems. SHAP analysis revealed gender-specific feature importance patterns, with certain speech features being more critical for males than females.
Conclusion: These findings demonstrate the feasibility of using speech features to objectively predict emotional and behavioral problems in adolescents and identify gender-specific markers. This study lays the foundation for developing speech-based assessment tools for early identification and intervention, offering an objective alternative to traditional subjective evaluation methods.
1. Introduction
Emotional and behavioral problems (e.g., emotional symptoms, hyperactivity, conduct problems, and peer relationship issues) are widespread among adolescents, significantly impacting their development and long-term mental health. These problems can lead to enduring psychological disorders and impair social functioning [1]. Current assessments primarily rely on subjective reports from parents, teachers, or the adolescents themselves, which are often influenced by personal biases and memory errors, compromising the accuracy of the evaluations [2]. Thus, there is an urgent need for objective assessment measures to overcome the limitations of existing methods [3].
Speech signals represent a potential objective measure, rich in information on cognitive and emotional states [4]. Research has shown that prosodic features (e.g., pitch and energy variation), spectral features and formant features can effectively reflect an individual’s mental state [5, 6]. These speech features offer new possibilities for objectively evaluating behavioral problems and mental health conditions.
Previous studies have found potential links between speech features and emotional or behavioral problems. For example, Lima and Behlau [7] found that adolescents with vocal issues scored higher in behavioral assessments, while Strand et al. [8] highlighted the influence of cultural and language factors on emotional understanding and behavior. Glogowska et al. [9] and Westrupp et al. [10] revealed long-term associations between language development and behavioral problems. Additionally, Aro et al. [11] suggested that emotional and behavioral symptoms may differ by gender. However, these studies are mostly descriptive and research directly using speech features to predict emotional and behavioral problems remains scarce.
This study aims to systematically explore the value and feasibility of speech features in predicting adolescent emotional and behavioral problems. First, previous research has explored the potential of speech features to assess emotional and behavioral problems, indicating that these features may contain key information. Second, emotional and behavioral problems are highly comorbid with other mental health issues (e.g., anxiety and depression) and speech features have shown promising results in predicting these conditions [12–14]. Therefore, it is reasonable to infer that speech features play a crucial role in predicting emotional and behavioral problems.
Nevertheless, existing research has some limitations. For example, most studies focus on only a few types of speech features without considering the diversity and interrelationships between features; the results are often inconsistent, potentially due to differences in data processing methods, sample characteristics, or cultural contexts [15]. Small sample sizes may also limit the generalizability of the results, leading to overestimated predictive effects [16]. To address these gaps, this study is the first to systematically utilize speech features to aid in predicting and diagnosing various emotional and behavioral problems assessed by the Strengths and Difficulties Questionnaire (SDQ).
- 1.
Can prediction models for emotional and behavioral problems be established for both genders using large-sample speech features?
- 2.
What are the optimal speech feature categories or combinations for predicting each emotional and behavioral problem for males and females?
- 3.
Are there gender differences in predicting the same emotional and behavioral problems using different speech feature categories?
2. Materials and Methods
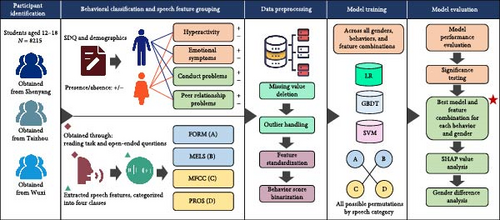
The detailed analysis workflow is shown in Figure 1, which presents the steps from data preprocessing to model evaluation and interpretation.
2.1. Participants
The sample was drawn from Phase 1 of the “SEARCH” database [17], which collected longitudinal data on child and adolescent health. The original dataset included 11,427 voice recordings and complete responses to the Student SDQ. Based on the study objective, we established the following screening criteria for the database: (a) participants had to be between 12 and 18 years old, (b) complete a fixed-content reading task and an open-ended question voice recording task, and (c) provide complete data from the SDQ. After applying these criteria and completing the data cleaning process, a total of 8215 eligible adolescents were included in the study, with 4370 males and 3845 females. The study was approved by the ethics committee of the Affiliated Brain Hospital of Nanjing Medical University (Ethics Approval No.: 2022-KY095-02).
2.2. Sample Size Estimation
The sample size was estimated based on the binary classification task for each emotional and behavioral problem dimension, considering 378 independent variables included in the study. The significance level was set at α = 0.05, with a power of 0.80, assuming a medium effect size [18]. The minimum required sample size for each gender group was estimated using G ∗Power software, taking into account the possible proportion of invalid questionnaires [19].
2.3. Instruments
Emotional and behavioral problems were assessed using the self-report version of the SDQ [22] (25 items across five subscales) with three-point Likert-scale responses (0 = “Not true,” 1 = “Somewhat true,” and 2 = “Certainly true”).The SDQ was selected as the reference standard for the following reasons: the scale has been extensively validated in Chinese adolescents, with recent studies demonstrating acceptable reliability and validity of the Chinese version, particularly showing good internal consistency (α = 0.75) on the total difficulties scale [20]. Furthermore, this instrument provides comprehensive assessment across multiple emotional and behavioral dimensions, while maintaining practical feasibility for large-scale data collection [21]. Threshold scores were dichotomized based on Goodman’s [22] early research and population characteristics: hyperactivity threshold = 5 (score >5 considered problematic), emotional symptoms threshold = 3 (score >3 considered problematic), peer problems threshold = 2 (score >2 considered problematic), and conduct problems threshold = 2 (score >2 considered problematic). Demographic information such as gender and age was collected using a self-designed questionnaire.
Voice samples were recorded using an Android device, including a fixed-content reading task (Mandarin version of “The North Wind and the Sun,” ~3 min) [17] and four open-ended question tasks (see Supporting Information 1: Appendix A for questionnaire details and reading tasks). Audio data were converted to WAV format using FFmpeg, with noise reduction and silent segment removal. Prosodic, voice quality, energy, spectral, and formant features were extracted using the openSMILE toolkit [23]. Four key categories of features were selected: mel-frequency cepstral coefficients (MFCC), mel energy spectrum (MELS), prosodic features (PROS), and formant features (FORM) [24–27], the composition and number of features in each of the four speech feature categories are presented in Table 1. The reference standard (SDQ) and index test (speech recording) were administered concurrently and no clinical interventions occurred between the two assessments.
| Main category | Subcategory | Number of features (function) | Significance in mental health assessment |
|---|---|---|---|
| MFCC | MFCC (1–13) | 91 (Min/Max, range, mean, Std Dev, skewness, kurtosis) | Reflects changes in the speech spectral envelope, associated with emotional states and cognitive load |
| PROS | F0 | 21 (Min/Max, range, mean, Std Dev, skewness, kurtosis) | Represents pitch variation, indicative of emotional arousal and stress levels |
| Energy | 21 (Min/Max, range, mean, Std Dev, skewness, kurtosis) | Describes speech loudness, reflecting emotional intensity and patterns of social interaction | |
| FORM | F1 | 21 (Min/Max, range, mean, Std Dev, skewness, kurtosis, delta/delta–delta) | Related to vowel openness, indicating emotional expression and speech clarity |
| F2 | 21 (Min/Max, range, mean, Std Dev, skewness, kurtosis, delta/delta–delta) | Reflects the anterior–posterior movement of the tongue, revealing speech fluency and emotional expression capabilities | |
| F3 | 21 (Min/Max, range, mean, Std Dev, skewness, kurtosis, delta/delta–delta) | Associated with vocal tract shape, reflecting voice quality and subtle emotional changes | |
| MELS | MELS (1–26) | 182 (Min/Max, range, mean, Std Dev, skewness, kurtosis) | Simulates human auditory perception, capturing subtle differences in emotional changes and psychological states |
| Total | — | 378 | — |
2.4. Data Preprocessing and Statistical Analysis
Data preprocessing involved handling complete datasets with no missing values, outlier detection (1%–99% quantile method) and Z-score normalization [28, 29]. All combinations of the four speech feature categories were generated, resulting in 15 feature combinations. Table 2 presents a detailed list of all possible feature category combinations. In this study, we selected three machine learning algorithms—logistic regression (LR), support vector machine (SVM), and gradient boosting decision tree (GBDT)—to construct emotion and behavior prediction models. First, LR represents a machine learning algorithm extensively applied in classification tasks, particularly suitable for binary classification problems. For instance, in sentiment analysis applications, it can effectively predict textual sentiment polarity (e.g., positive or negative emotions) [30]. SVM demonstrates superior performance in handling complex nonlinear classification problems within high-dimensional spaces. In domains such as sentiment analysis, cognitive diagnosis, and mental health assessment, SVM achieves effective category differentiation and continuous variable prediction (e.g., emotional states or mental health risks) through the construction of optimal hyperplanes [31]. GBDT, as a robust ensemble learning method, progressively enhances prediction accuracy by sequentially building decision trees to minimize prediction errors. Recognized for its exceptional performance in processing large-scale complex datasets and improving model accuracy, GBDT is particularly effective for analyzing multidimensional feature relationships in emotion and behavior prediction tasks [32].The selection criteria for these algorithms were based not only on their theoretical foundations and general applicability in categorical prediction but also referenced their documented success in emotion recognition and behavior prediction applications. The hyperparameter optimization process employed randomized grid search with 50 iterations to balance computational efficiency and parameter space exploration. For each algorithm, we defined a comprehensive candidate parameter space based on empirical evidence from previous emotion prediction studies in Table 3. The randomized search strategy was systematically applied across all model configurations under different feature combinations. The SMOTE technique was applied to address class imbalance and SelectKBest was used to select the most relevant features [33, 34]. Model performance was evaluated through stratified fivefold cross-validation [35]. Evaluation metrics included area under the curve (AUC), F1-score, sensitivity, specificity, and precision. The best model was selected based on the average AUC and paired t-tests were used to compare the performance differences between feature combinations and models. Shapley additive explanations (SHAPs) was used to interpret the best prediction model for each emotional and behavioral problem, assessing the marginal contribution of each feature to the model output and feature importance plots were generated [36]. In this study, we set the machine learning classification threshold at 0.5, categorizing participants with predicted probabilities above 0.5 as having emotional or behavioral problems and those at or below as nonproblematic. This threshold was chosen to balance sensitivity and specificity based on receiver operating characteristic (ROC) curve analysis, ensuring optimal performance across different symptom dimensions and genders. The performers of the index test were blinded to the participants’ SDQ results. Conversely, the assessors of the reference standard were unaware of the index test outcomes.
| No. | Combination | No. | Combination | No. | Combination |
|---|---|---|---|---|---|
| 1 | PROS | 2 | MFCC | 3 | FORM |
| 4 | MELS | 5 | MFCC + PROS | 6 | MFCC + FORM |
| 7 | MFCC + MELS | 8 | PROS + FORM | 9 | PROS + MELS |
| 10 | FORM + MELS | 11 | MFCC + PROS + FORM | 12 | MFCC + PROS + MESL |
| 13 | MFCC + FORM + MESL | 14 | PROS + FORM + MELS | 15 | MFCC + PROS + FORM + MELS |
| Models | Hyperparameter | Candidate range |
|---|---|---|
| LR | Regularization (C) | [0.001, 0.01, 0.1, 1, 10, 100] |
| Penalty type | [‘l2’, ‘l1’, ‘elasticnet’] | |
| Solver | [‘lbfgs’, ‘liblinear’, ‘sag’] | |
| Max iterations | [100, 500, 1000] | |
| SVM | C | [0.1, 1, 10, 100] |
| Kernel | [‘linear’, ‘rbf’] | |
| Gamma | [‘scale’, 0.01, 0.1, 1] | |
| Shrinking | [True, False] | |
| GBDT | n_estimators | [50, 100, 200, 500] |
| learning_rate | [0.005, 0.05, 0.1, 0.2] | |
| max_depth | [3, 5, 7, 10] | |
| min_samples_split | [20, 50, 100] | |
| min_samples_leaf | [10, 20, 30] | |
| subsample | [0.6, 0.8, 1.0] | |
3. Results
3.1. Sample Description
According to the G ∗Power software calculations, the final sample size requirement for each gender group was at least 2064 participants. In this study, the actual sample size met this requirement, with 4370 males and 3845 females, totaling 8215 participants. Among male participants, 16.32% exhibited hyperactivity problems, 23.00% had emotional symptoms, 60.69% had peer relationship issues, and 42.29% showed conduct problems. Among female participants, these percentages were 17.89%, 35.66%, 53.71%, and 40.00%, respectively. Participants without emotional or behavioral problems did not have alternative diagnoses recorded.
3.2. Associations Between Emotional and Behavioral Problems and Speech Features
Exploratory analysis of the 378 speech features revealed significant differences between problematic and nonproblematic groups across different dimensions and genders (Table 4, complete results in Supporting Information 1: Appendix B). For example, in hyperactivity symptoms, males in the problematic group had significantly lower mean F1 values compared to the nonproblematic group (993.39 ± 388.15 vs. 1072.80 ± 465.41, p < 0.001, Cohen’s d = −0.19), while females in the problematic group had significantly higher MELS 5 standard deviation values compared to the nonproblematic group (52.01 ± 7.26 vs. 50.54 ± 7.72, p < 0.001, d = 0.20). In emotional symptoms, males in the problematic group had significantly higher maximum second derivative values for F3 compared to the nonproblematic group (6348.35 ± 1884.51 vs. 6018.80 ± 2029.42, p < 0.001, d = 0.17), while females also showed significantly higher MELS 5 std (p < 0.001, d = 0.20). For conduct problems, the mean F1 values were significantly lower in the problematic group for both males (d = −0.18) and females (d = −0.18). For peer relationship problems, males in the problematic group had significantly higher kurtosis for MELS 3 (p < 0.001, d = 0.11), while females had significantly higher standard deviation for MFCC 6 (p < 0.001, d = 0.15).
| Dimension | Gender | Feature | Problematic M (SD) | Nonproblematic M (SD) | p-Value | Cohen’s d |
|---|---|---|---|---|---|---|
| Hyperactivity | Male | F1 mean | 993.39 (388.15) | 1072.80 (465.41) | <0.001 | −0.19 |
| F3 Std | 1217.86 (192.35) | 1183.97 (216.10) | <0.001 | 0.17 | ||
| Female | MELS 5 Std | 52.01 (7.26) | 50.54 (7.72) | <0.001 | 0.2 | |
| MELS 18 Std | 71.71 (6.84) | 70.49 (6.98) | <0.001 | 0.18 | ||
| Emotional symptoms | Male | F3 2nd derivative max | 6348.35 (1884.51) | 6018.80 (2029.42) | <0.001 | 0.17 |
| F1 mean | 1007.62 (397.85) | 1075.44 (469.16) | <0.001 | −0.16 | ||
| Female | MELS 5 Std | 52.01 (7.26) | 50.54 (7.72) | <0.001 | 0.2 | |
| MELS 18 Std | 71.71 (6.84) | 70.49 (6.98) | <0.001 | 0.18 | ||
| Conduct problems | Male | F1 mean | 1012.84 (416.84) | 1094.29 (477.56) | <0.001 | −0.18 |
| F1 Std | 880.59 (245.69) | 919.95 (260.90) | <0.001 | −0.16 | ||
| Female | F1 mean | 1020.42 (426.41) | 1099.80 (478.65) | <0.001 | −0.18 | |
| F3 1st derivative min | −2034.35 (462.71) | −1949.29 (504.65) | <0.001 | −0.18 | ||
| Peer problems | Male | MELS 3 kurtosis | 0.47 (0.44) | 0.42 (0.39) | <0.001 | 0.11 |
| MELS 20 mean | 0.04 (1.14) | −0.06 (1.22) | 0.0061 | 0.08 | ||
| Female | MFCC 6 Std | 143.40 (22.16) | 140.11 (23.17) | <0.001 | 0.15 | |
| MELS 6 minimum | −184.41 (42.27) | −178.26 (41.44) | <0.001 | −0.15 | ||
3.3. Significance Testing Results
Significance testing showed the GBDT model performed best across all symptom-gender combinations, with optimal feature sets varying by gender (e.g., MFCC + PROS for male emotional symptoms, MFCC alone for female hyperactivity, all p < 0.05). Even in nonsignificant cases like female peer problems (AUC = 0.5707), GBDT maintained superior performance over LR and SVM models. Full significance testing results are provided in the Supporting Information 1: Appendix C (intramodel variability test) and Supporting Information 1: Appendix D (optimal feature difference test across multiple models).
3.4. Best Model and Feature Combinations
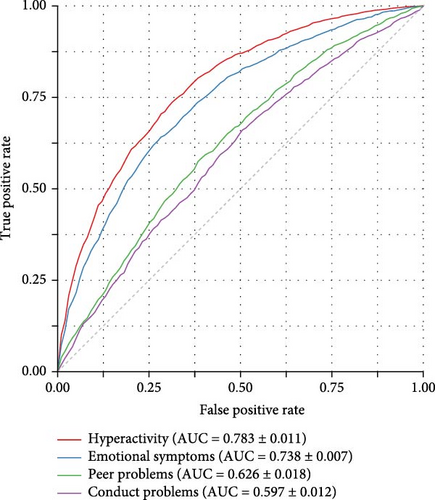
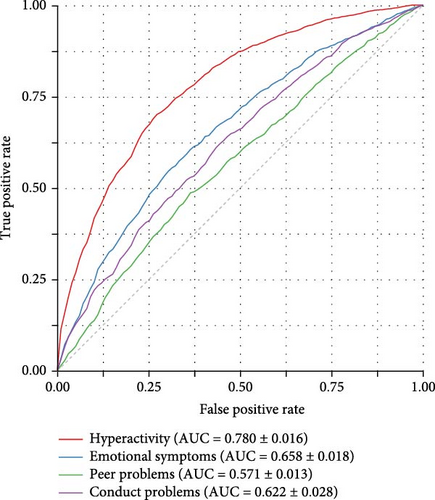
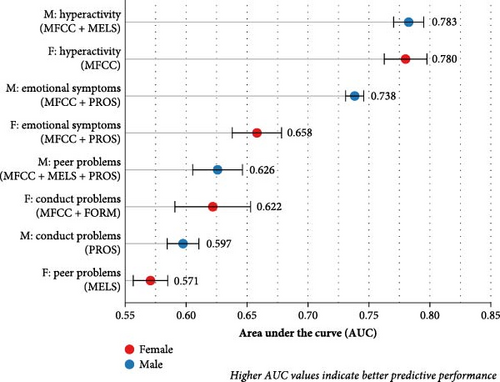
Table 5 presents the optimal feature combinations and performance metrics for the GBDT model across emotional and behavioral problem dimensions and gender combinations. Detailed performance data are provided in Supporting Information 1: Appendix E. Based on the data in the table, the results showed that for hyperactivity, the best feature combination for males was MFCC + MELS (AUC = 0.783 ± 0.011, F1 = 0.725 ± 0.010), while for females it was MFCC (AUC = 0.780 ± 0.016, F1 = 0.722 ± 0.019). For emotional symptoms, MFCC + PROS was the best combination for both genders, but the predictive performance was higher for males (AUC = 0.738 ± 0.007, F1 = 0.686 ± 0.010) compared to females (AUC = 0.658 ± 0.018, F1 = 0.632 ± 0.014). For conduct problems, the best feature combination for males was PROS (AUC = 0.597 ± 0.012, F1 = 0.600 ± 0.011), while for females it was MFCC + FORM (AUC = 0.622 ± 0.028, F1 = 0.599 ± 0.020). For peer problems, the best combination for males was MFCC + MELS + PROS (AUC = 0.626 ± 0.015, F1 = 0.562 ± 0.017), while for females it was MELS (AUC = 0.571 ± 0.013, F1 = 0.534 ± 0.019). Overall, the prediction performance for conduct problems and peer problems was relatively weaker. The ROC curves are shown in Figures 2, with AUC box plots in Figure 3. Clinically actionable thresholds determined by Youden’s index (J = sensitivity + specificity − 1) for dimension-specific optimal models are provided in Table 6.
| Dimension | Gender | Best feature combination | AUC (Std) | F1 score (Std) | Sensitivity (Std) | Specificity (Std) |
|---|---|---|---|---|---|---|
| Hyperactivity | Male | MFCC + MELS | 0.783 ± 0.011 | 0.725 ± 0.010 | 0.763 ± 0.020 | 0.659 ± 0.021 |
| Female | MFCC | 0.780 ± 0.016 | 0.722 ± 0.019 | 0.764 ± 0.027 | 0.648 ± 0.027 | |
| Emotional symptoms | Male | MFCC + PROS | 0.738 ± 0.007 | 0.686 ± 0.010 | 0.710 ± 0.017 | 0.642 ± 0.012 |
| Female | MFCC + PROS | 0.658 ± 0.018 | 0.632 ± 0.014 | 0.662 ± 0.017 | 0.567 ± 0.023 | |
| Conduct problems | Male | PROS | 0.597 ± 0.012 | 0.600 ± 0.011 | 0.635 ± 0.015 | 0.517 ± 0.022 |
| Female | MFCC + FORM | 0.622 ± 0.028 | 0.599 ± 0.020 | 0.621 ± 0.024 | 0.549 ± 0.028 | |
| Peer problems | Male | MFCC + MELS + PROS | 0.626 ± 0.015 | 0.562 ± 0.017 | 0.534 ± 0.030 | 0.635 ± 0.025 |
| Female | MELS | 0.571 ± 0.013 | 0.534 ± 0.019 | 0.510 ± 0.027 | 0.602 ± 0.030 | |
| Dimension | Gender | Best feature combination | Youden’s index |
|---|---|---|---|
| Hyperactivity | Male | MFCC + MELS | 0.409 |
| Female | MFCC | 0.412 | |
| Emotional symptoms | Male | MFCC + PROS | 0.352 |
| Female | MFCC + PROS | 0.201 | |
| Conduct problems | Male | PROS | 0.152 |
| Female | MFCC + FORM | 0.170 | |
| Peer problems | Male | MFCC + MELS + PROS | 0.186 |
| Female | MELS | 0.112 | |
3.5. Feature Importance
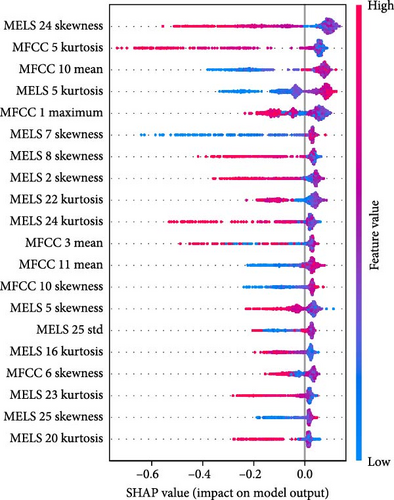
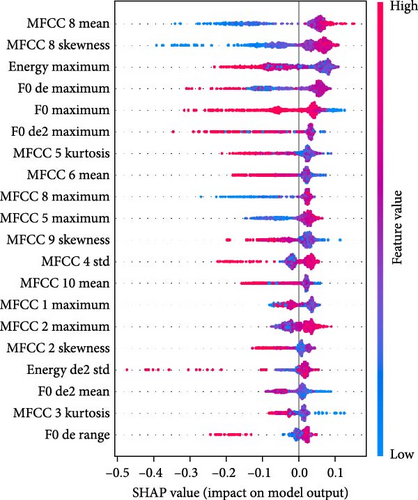
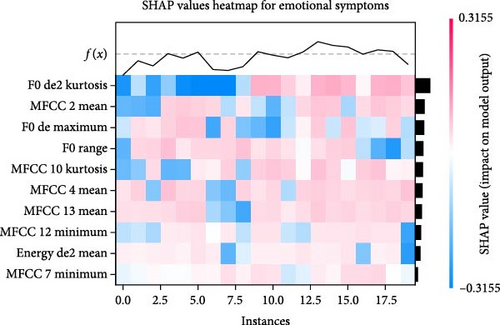
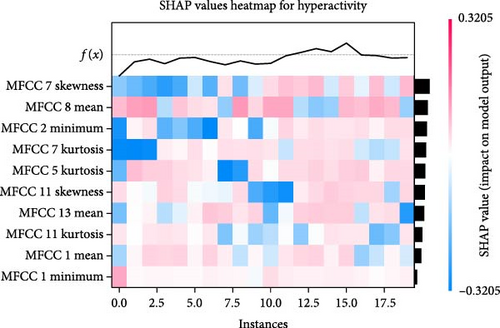
Figures 4 and 5 show the feature importance for predicting male hyperactivity and female emotional symptoms, respectively, using the best prediction models. SHAP analyses for all dimensions and gender groups and feature importance are presented in Supporting Information 1: Appendix F. Significant differences were observed in the influence of speech features on model predictions across genders and symptoms: for hyperactivity symptoms, male predictors included MELS 24 skewness and MFCC 5 kurtosis (negative direction), and MFCC 10 mean (positive direction), while female predictors included MFCC 8 mean and MFCC 7 skewness (both positive direction). For peer problems, male predictors included MELS 16 and MELS 21 kurtosis (positive direction), while female predictors included MELS 2 skewness (negative direction) and MELS 3 skewness (positive direction). For conduct problems, male predictors included energy maximum (strong positive direction) and energy skewness (strong negative direction), while female predictors included MFCC 10 mean and MFCC 4 maximum (positive direction). For emotional symptoms, male predictors included F0 second derivative kurtosis and F0 first derivative maximum (both negative direction), while female predictors included MFCC 8 mean (positive direction) and skewness (negative direction). SHAP case analysis (Figures 6 and 7, all dimensions and gender groups are presented in Supporting Information 1: Appendix G) showed opposing effects between certain features; for example, F0 second derivative kurtosis and F0 first derivative maximum had opposing effects in predicting male emotional symptoms, while MFCC 7 skewness (negative) and MFCC 8 mean (positive) had opposing effects in female hyperactivity symptoms, especially when prediction values were close to 0.5.
4. Discussion
4.1. Main Findings and Interpretation
This study explored the predictive value of speech features for hyperactivity, emotional symptoms, conduct problems, and peer problems in a large sample of adolescents. The prediction models constructed using the GBDT algorithm performed well in hyperactivity (male AUC = 0.783 and female AUC = 0.780) and emotional symptoms (male AUC = 0.738 and female AUC = 0.658). This suggests that speech features alone can effectively predict emotional and behavioral problems in adolescents, expanding the application of speech features from previous systematic reviews indicating their ability to detect depression and schizophrenia [15].
Overall, the optimal feature combinations differed significantly by symptom and gender. For hyperactivity, the optimal feature combinations were MFCC + MELS for males and MFCC for females, while for emotional problems, MFCC + PROS was the best combination for both genders. For conduct problems, the best feature combination was PROS for males and MFCC + FORM for females, while for peer problems, MFCC + MELS + PROS was best for males and MELS for females. This indicates that appropriate feature combinations should be selected based on the specific symptom and gender when developing speech assessment tools [37].
MFCC emerged as one of the best feature combinations across all symptoms and genders, likely because it contains rich speech information such as articulation and speech rate [24]. However, the optimal combination of MFCC with other feature categories (e.g., MELS and PROS) varied by symptom and gender. For example, males’ optimal combinations for hyperactivity and peer problems included both MFCC and MELS, which may be related to greater spectral energy variation in males for these problems [38], possibly leading to difficulties in attention allocation and self-regulation [39]. In contrast, females relied only on MFCC for hyperactivity and only on MELS for peer problems, possibly due to higher stability in female speech features [40].
For emotional symptoms, MFCC + PROS was the optimal combination for both genders, consistent with previous findings that combining spectral (MFCC) and prosodic (PROS) features captures speech changes associated with emotional states [41]. Depression and anxiety, for instance, may lead to slower speech rate, lower volume, and flattened pitch [42, 43].
For conduct problems, the gender difference in the best feature combination was the most pronounced (PROS for males and MFCC + FORM for females). This gender difference may stem from differences in the clinical manifestation of conduct problems, with males more likely to exhibit direct physical aggression and females more likely to exhibit relational aggression [44]. This results in anomalies in prosodic features (e.g., dramatic pitch variation) for males, while females show anomalies in spectral and formant features [45].
Notably, the relatively lower AUC values observed for conduct problems (0.62) and peer problems (0.58) in this study may stem from the interplay between clinical complexity and methodological constraints. On one hand, the context-dependent nature of conduct problems (e.g., transient vocal changes during aggressive outbursts that escape detection by SDQ’s low-frequency event sensitivity) [46] and the implicit characteristics of peer problems (requiring longitudinal social dynamics assessment, with SDQ AUC as low as 0.49 in cross-cultural validations) [47] interact with inherent limitations of static measurement scales (particularly SDQ’s inadequate cross-cultural sensitivity for peer relationship evaluation) [48], collectively contributing to ambiguous vocal-label mapping for these behavioral dimensions.
On the other hand, the ecological validity mismatch between laboratory-controlled vocal tasks and SDQ’s 6-month behavioral recall framework might underlie the insufficient characterization of externalizing behaviors (e.g., abrupt vocal interruptions) and social cognition (e.g., conversational turn-taking patterns) through conventional acoustic features (MFCC/fundamental frequency) [49]. This temporal and contextual discontinuity potentially introduces systematic bias in feature-behavior correlations.
This study also found that the GBDT model outperformed others in all symptom dimensions and required the least feature combination for optimal prediction. This may be because GBDT builds decision trees iteratively, automatically selecting the optimal features and identifying key predictive factors [50].
4.2. Clinical Implications
This study leverages SHAP analysis to identify abnormal speech feature patterns across different symptoms and genders, leading to the development of a novel and user-friendly speech-based assessment tool. By utilizing this predictive tool, clinicians can accurately evaluate emotional and behavioral problems by selecting appropriate speech features tailored to the patient’s gender and specific symptoms. For hyperactivity, the tool identifies male symptoms primarily through MELS and MFCC features, such as significant volume fluctuations and rapid speech rate, aligning with clinical observations of males exhibiting “fast and loud” speech patterns [24, 51]. In contrast, female hyperactivity is detected mainly through MFCC features, characterized by increased speech rate and higher pitch [52], underscoring the need for gender-specific evaluation criteria. Regarding emotional symptoms, the tool associates male emotional issues with abnormalities in fundamental frequency (F0) features, indicating a general decline in pitch during low emotional states [53]. For females, emotional problems are more accurately reflected through changes in MFCC features, such as alterations in vocal timbre and clarity [54]. This differentiation facilitates the creation of targeted intervention strategies based on gender-specific vocal indicators. Behavioral problems also exhibit significant gender differences in speech features; males are primarily identified through prosodic features (PROS) abnormalities, marked by dramatic volume variations that reflect internal impulsiveness and emotional instability [45]. Conversely, female behavioral issues are linked to anomalies in MFCC and FORM features, potentially associated with a tendency towards indirect aggressive behaviors [44]. The predictive performance for peer relationship problems was relatively weak; however, differences in feature performance between males and females suggest that abnormalities in vocal energy distribution during social interactions may play a role [55]. This indicates the necessity for more nuanced assessments that consider gender differences to enhance evaluation accuracy. Implementing this structured speech feature assessment tool allows clinicians to more precisely identify emotional and behavioral problems across different genders and symptoms, thereby optimizing intervention strategies and resource allocation. Additionally, SHAP case heatmap analysis revealed opposing effects of certain features within the predictive model. For instance, in predicting hyperactivity, the skewness of MELS 24 in males had a negative effect, while the mean of MFCC 10 had a positive effect, potentially canceling each other out and reducing prediction accuracy. A similar pattern was observed for emotional symptoms, where the kurtosis of F0’s second derivative had a negative impact, and the maximum of F0’s first derivative had a positive effect. These complex interactions highlight the importance of using complementary assessment tools, such as behavioral observations and psychological scales, to mitigate the risk of misjudgments that may arise from relying solely on speech features. Future research should focus on externally validating this speech-based assessment tool in larger and more diverse cohorts to ensure its effectiveness across different populations. Additionally, determining the most cost- and resource-effective cutoffs in various clinical settings will be essential for the practical implementation of this tool. By addressing these areas, the tool can significantly enhance the reliability and effectiveness of clinical assessments for emotional and behavioral problems.
For Chinese medical students who face unique mental health challenges, this speech-based assessment tool offers several distinctive advantages. First, it addresses the prevalent issue of mental health stigma in this population [56] by providing an objective assessment method that circumvents the reluctance to self-report symptoms. Second, the tool’s ability to detect subclinical symptoms through subtle speech changes [57] is particularly valuable for identifying at-risk students during the preclinical phase, when traditional screening often fails. Third, the gender-specific feature analysis accounts for cultural differences in emotional expression among Chinese medical students, where males may exhibit more somatization and females tend toward internalizing symptoms [58]. Implementation could leverage China’s advanced telemedicine infrastructure by integrating the tool into: (1) routine health checkups at medical universities, (2) student psychological service platforms, and (3) mobile apps for continuous monitoring during high-stress periods like national licensing exam preparation. This approach would overcome barriers posed by heavy academic workloads and limited mental health resources in Chinese medical education settings.
4.3. Contributions, Limitations, and Future Directions
This study, the first to systematically use speech features to predict and diagnose SDQ-assessed emotional and behavioral problems, presents the following innovations: (1) It investigated the predictive utility of speech features for multidimensional emotional and behavioral problems in a large sample of adolescents, expanding the application of speech technology in mental health assessment. (2) It compared differences in speech prediction patterns across different symptoms and genders, revealing the complexity and specificity of speech-emotion associations. (3) It innovatively combined machine learning and SHAP interpretation methods to achieve efficient prediction and interpretation.
However, this study has some limitations. First, the cross-sectional design cannot establish causal relationships between speech abnormalities and emotional or behavioral problems. Second, the classification of emotional and behavioral problems is broad, which may affect prediction accuracy, especially for conduct and peer relationship problems, which require further analysis to improve differentiation. Third, while we adopted a hierarchical analytic strategy by partitioning 378 speech features into four acoustic categories (PROS, MFCC, MELS, and FORM) and evaluating 15 combinatorial subsets (ranging from 42 to 378 features), the inherent tradeoff between exploratory discovery and statistical rigor warrants attention. Traditional Bonferroni correction (e.g., α = 0.05/378 ≈ 1.32 × 10⁻⁴ for the full combinatorial set) would retain only 0–3 significant features, potentially obscuring clinically relevant biomarkers. This methodological approach reflects established practices in speech emotion analytics—as exemplified by Dibben et al. [59] in Nature Human Behaviour when handling high-dimensional speech features with substantial inter-correlation (Pearson’s r = 0.65–0.89)—we explicitly report all effect sizes (Cohen’s d) and raw p-value distributions to facilitate future replication in Supporting Information 1: Appendix B. Additionally, the cultural background of the sample may limit the generalizability of the results, requiring validation in different cultural contexts.
Future research could combine technologies such as brain imaging to further reveal the relationship between speech abnormalities and brain activity and evaluate the effectiveness of combining speech technology with traditional methods in real-world settings. Multidimensional validation strategies should prioritize: (1) longitudinal designs to track biomarker stability, (2) multimodal fusion with physiological signals (e.g., heart rate and EEG) for enhanced specificity, and (3) cross-cultural adaptation of acoustic thresholds based on linguistic prosody patterns, and (4) systematic integration of textual and semantic features to capture paralinguistic-behavioral synergies.
5. Conclusion
This study is the first to use speech features and machine learning to predict emotional and behavioral problems in adolescents, demonstrating speech’s potential as a biomarker. Analyzing data from 8215 adolescents, the GBDT model accurately identified hyperactivity and emotional symptoms, revealing gender-specific feature patterns. While the current model focuses on these dimensions, future work could further enhance the prediction of peer problems and conduct problems by integrating semantic and contextual speech analysis. The developed model provides an objective tool for early detection, enabling targeted interventions by healthcare systems. Future research should validate this speech-based assessment tool with larger and more diverse populations to improve its effectiveness and applicability across broader behavioral domains.
Disclosure
The funders had no role in the design of the study; in the collection, analyses, or interpretation of data; in the writing of the manuscript; or in the decision to publish the results.
Conflicts of Interest
The authors declare no conflicts of interest.
Author Contributions
Conceptualization, writing – original draft preparation: Jinyu Li and Yang Wang. Methodology, software, formal analysis: Jinyu Li. Validation: Yang Wang, Jinyu Li, and Ran Zhang. Investigation: Ning Wang and Yue Zhu. Resources: Taihong Zhao. Data curation: Jinyu Li and Yue Zhu. Writing – review and editing, supervision, funding acquisition: Fei Wang and Taihong Zhao. Visualization: Yang Wang. Project administration: Fei Wang. All authors have read and agreed to the published version of the manuscript.
Funding
This research was funded by the National Natural Science Foundation of China–Guangdong Joint Fund (Grant U20A6005), the Jiangsu Provincial Key Research and Development Program (Grant BE2021617), the Jiangsu Provincial Talent Program of Entrepreneurship and Innovation (Grant JSSCRC2021565), the National Key Research and Development Program of China (Grant 2022YFC2405605), the Nanjing Municipal Special Fund Project Plan for Health Science and Technology Development (Grant ZKX24053), the Natural Science Foundation of Jiangsu Province (Grant BK20240272 to Yang Wang), the Special Funds for Health Science and Technology Development of Nanjing Municipal Health Commission (Grant YKK24188 to Yang Wang), and the General Project of the Science and Technology Development Foundation of Nanjing Medical University (Grant NMUB20230205 to Yang Wang).
Supporting Information
Additional supporting information can be found online in the Supporting Information section.
Open Research
Data Availability Statement
The data that support the findings of this study are available upon request from the corresponding author. The data are not publicly available due to privacy or ethical restrictions.


