Detection of Effective Devices in Information Dissemination on the Complex Social Internet of Things Networks Based on Device Centrality Measures
Abstract
The Complex Social Internet of Things (CSIoT) integrates the connectivity of IoT with the relational dynamics of complex social networks, creating systems where devices autonomously form and manage relationships. The centrality measures specify the topological characteristics of each node in terms of local and global information of the node in the network. The detection of effective devices in disseminating information across CSIoT networks is critical for optimizing communication, improving network performance, and ensuring efficient resource utilization. In this paper, temporal centrality measures are used to identify influential devices in information dissemination. For this purpose, first, the centrality measures for SIoT network devices have been redefined, and then, using the SIR model, each of the measures has been evaluated in terms of the success rate in identifying effective devices in information dissemination. The results have shown that in SIoT networks that have a high clustering coefficient, the centrality measures of closeness and betweenness have a better performance in identifying influential devices that are effective in spreading information. Also, for networks that have a high degree of heterogeneity, the device coreness centrality and device Katz centrality measures perform better than other measures. Finally, the results show that mobile devices play a more important role in disseminating information than static devices.
1. Introduction
The Internet of Things (IoT) refers to a rapidly growing network of interconnected devices and systems that communicate and exchange data over the internet [1]. These “things” include everyday objects embedded with sensors, software, and other technologies that allow them to collect, share, and analyze data, enabling automation, efficiency, and smarter decision-making [2]. From smart home devices like thermostats, lights, and appliances to industrial machinery, wearable health monitors, and autonomous vehicles, IoT has revolutionized the way we interact with the world around us. The IoT creates opportunities for innovation in sectors such as healthcare, transportation, agriculture, energy, and manufacturing, ultimately enhancing convenience, productivity, and sustainability by connecting the physical and digital realms. As the adoption of IoT accelerates, it promises to transform industries and daily life while raising important considerations around security, privacy, and data management.
The Social IoT (SIoT) is an emerging paradigm that combines the principles of the IoT with social network concepts, enabling objects (smart devices) to establish and manage their own social relationships autonomously [3]. While IoT focuses on interconnecting physical devices to collect and exchange data, SIoT takes this a step further by allowing devices to interact in a “social” manner, much like humans do on social platforms [4]. The SIoT concept enhances the scalability, efficiency, and functionality of IoT systems by leveraging social structures to organize relationships between connected devices [5]. The architecture of the SIoT is designed to enable smart devices to interact autonomously by incorporating elements of both IoT and social networks [6]. At its core, it consists of smart devices (things) embedded with sensors, communication interfaces, and processing capabilities to collect and share data. A social network platform acts as the medium where devices can register, discover, and establish relationships based on predefined rules and contexts, similar to human social networks. The communication layer, leveraging technologies like Wi-Fi, Bluetooth, 5G, and cloud services, facilitates seamless data exchange between devices. In addition, data management and analytics layers process and analyze large volumes of data generated by the devices, enabling smarter decision-making and improved functionality [7]. Users, as the owners of the devices, indirectly influence their interactions and relationships. This architecture ensures scalability, efficiency, and structured collaboration between devices, mimicking human-like social behaviors to address various application needs.
The SIoT has diverse applications across multiple domains by enabling smart devices to interact autonomously and collaboratively. In smart homes, devices such as smart thermostats, lights, and appliances build relationships to optimize energy usage and enhance user comfort. In healthcare, wearable devices and health monitors share real-time data with medical professionals or among devices to provide personalized care and improve health outcomes. In smart cities, SIoT facilitates communication between traffic systems, vehicles, and infrastructure to optimize transportation, reduce congestion, and enhance public safety [8]. In industrial settings, machines form cooperative networks to streamline manufacturing processes, improve resource management, and minimize downtime. In addition, in social wearables, devices like fitness trackers interact to promote collaborative goals, such as group fitness challenges. Overall, SIoT enhances automation, efficiency, and intelligence across homes, cities, industries, and healthcare systems.
- •
Discover other devices
- •
Build relationships based on shared goals, services, or proximity
- •
Collaborate and exchange data efficiently.
For instance, smart home devices, wearable devices, or autonomous vehicles can form relationships to collaborate in achieving specific tasks, such as energy optimization or sharing traffic data. Figure 1 shows the different components of SIOT networks.

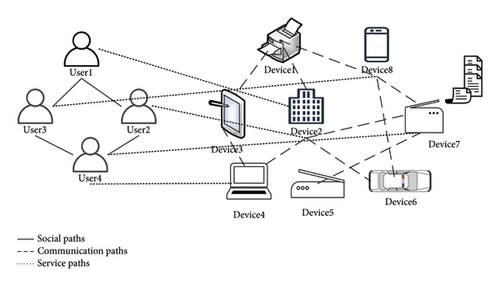
In SIoT networks, the concept of paths refers to the ways devices (smart objects) are connected and communicate to exchange information, collaborate, or provide services [9]. These paths represent the routes or relationships that devices form to interact efficiently. The types of paths in SIoT networks are:
1.1. Communication Paths
In the SIoT, the communication path represents the routes or mechanisms through which devices exchange information to interact and collaborate efficiently. These paths can be direct or indirect, static or dynamic, and single-hop or multihop and may involve hierarchical, peer-to-peer, or cloud-based structures. These paths enable devices to form relationships, share data, and achieve collective goals in various applications like smart homes, healthcare, and smart cities by facilitating seamless and structured communication. The efficient design of communication paths ensures scalability, adaptability, and reliability in SIoT networks, optimizing the overall performance and user experience.
1.2. Social Paths
In the SIoT, a social path refers to the communication or interaction route established between devices based on social relationships, similar to human social connections. These relationships are formed when devices share a common context, purpose, or ownership, allowing them to collaborate effectively. For example, smart devices owned by friends, family members, or devices belonging to the same user can establish social paths to exchange data or provide coordinated services. Social paths can also form dynamically when devices interact in shared environments, such as fitness trackers exchanging data for group challenges or vehicles sharing traffic updates in a smart transportation system. Social paths enhance the efficiency and relevance of device interactions by mimicking human-like relationships, enabling seamless communication and improved user experiences across smart environments.
1.3. Service Paths
In the SIoT, a service path refers to the route or sequence through which devices interact to deliver a specific service or achieve a particular goal. Devices form service paths by discovering and leveraging other devices’ capabilities, either directly or through intermediaries, to fulfill user or system requirements. For instance, in a smart home environment, a thermostat may interact with smart blinds, air conditioning, and lighting systems to optimize room temperature and energy consumption. Similarly, in a smart city, vehicles may utilize service paths to interact with traffic lights, parking sensors, and navigation systems to ensure efficient transportation. These paths are often dynamic, adapting in real-time based on context, resource availability, and user preferences. The service paths in SIoT enhance functionality, improve resource utilization, and deliver user-centric solutions by enabling seamless integration of services across interconnected devices.
The application of paths plays a crucial role in enabling devices to work together to achieve specific tasks or services. These paths facilitate seamless data flow and coordination between devices, improving efficiency and functionality. For example, in smart homes, application paths enable devices like smart thermostats, lights, and security systems to interact and optimize energy usage, enhance security, and provide comfort based on user preferences. In smart healthcare, wearable devices and medical sensors form paths to monitor patients’ health in real time, sharing data with doctors or other medical devices for prompt decision-making. In smart cities, paths are used to connect traffic sensors, vehicles, and infrastructure to streamline transportation, reduce congestion, and improve public safety. Similarly, in industrial IoT, application paths help machines and sensors coordinate production processes, predictive maintenance, and supply chain management. These paths ensure that devices work collaboratively, making SIoT networks more intelligent, adaptive, and effective in providing tailored solutions across various domains.
Figure 2 shows the types of paths between SIOT network components.
In SIoT networks, devices are the interconnected smart objects that interact and collaborate to collect, process, and exchange data. These devices, equipped with sensors, communication interfaces, and processing capabilities, work autonomously or in coordination to achieve specific tasks or services. The devices in SIoT networks range from sensors and wearables to smart appliances, vehicles, and industrial devices, each contributing to a network that mimics social relationships to optimize performance and user experiences [10]. They can communicate directly or through intermediaries, creating a flexible, scalable, and responsive network for various applications across homes, healthcare, industries, and cities. In SIoT networks, devices play essential roles in information dissemination, where they share data and collaborate to distribute valuable information throughout the network. Each device, depending on its functionality and social relationships, can act as a data producer, relayer, or consumer [11]. Devices that generate data, such as sensors or wearables, act as producers by collecting and transmitting information to other devices or servers. Some devices, like routers or gateways, serve as relayers, forwarding information between devices that may not be in direct communication range. Additionally, devices can also function as consumers, receiving and utilizing the information from others to perform specific tasks, such as optimizing energy use or enhancing security. Social relationships between devices, such as ownership or shared contexts, determine how data are routed, processed, and shared, ensuring that relevant information reaches the right devices at the right time. This dynamic process of information flow allows SIoT networks to become more adaptive, efficient, and responsive to user needs and environmental changes.
In SIoT networks, the detection of effective devices plays a crucial role in information dissemination, as it ensures that data is shared with the right devices efficiently and accurately [12]. Identifying and selecting devices that are capable of effectively processing, relaying, and consuming information is essential for maintaining the performance and reliability of the network. By detecting devices that are well-positioned in terms of their capabilities, proximity, and social relationships, the network can ensure that data flows seamlessly, reducing latency and improving resource allocation. Effective device detection also enables dynamic routing, where devices adjust their interactions based on context, ensuring that information reaches its intended recipient while optimizing network traffic [13]. This enhances the overall efficiency, responsiveness, and scalability of SIoT networks, particularly in applications like smart homes, healthcare, and industrial IoT, where timely and accurate information exchange is critical. Centrality measures in SIoT networks play a significant role in the detection of effective devices for information dissemination. Centrality refers to the importance or influence of a device within the network, and devices with higher centrality are more strategically positioned to relay or process information effectively. Measures like degree centrality, betweenness centrality, and closeness centrality help identify devices that are key for efficient data flow. Devices with high degree centrality are directly connected to more devices, making them effective for wide-reaching information dissemination. Betweenness centrality highlights devices that act as bridges, facilitating communication between otherwise disconnected parts of the network, ensuring smooth information transfer. Closeness centrality focuses on devices with the shortest paths to all other devices, allowing for faster data propagation. By considering these centrality measures, SIoT networks can dynamically detect and prioritize devices that optimize information distribution, enhance network efficiency, and reduce latency, ensuring that the right data reaches the right devices at the right time.
- •
Compatibility of device centrality measures with SIoT network
- •
Introducing the proposed measures to identify effective devices in SIoT networks
- •
Ranking of devices in IOT systems in order to identify sensitive devices
- •
Examining the centrality devices measures to identify influential device in information diffusion on heterogeneous networks
The organization of the paper is as follows: in Section 2, related works are introduced; in Section 3, centrality device measures are proposed for ranking devices in the SIoT network; in Section 4, using an experimental dataset, the centrality device methods are compared with each other. The conclusion is described in Section 5.
2. Related Works
Finding key nodes in information dissemination in social networks has always been one of the important issues in this type of network. Many studies have focused on finding effective nodes in information dissemination. These studies reflect the diversity of approaches for identifying influential nodes and analyzing information dynamics in complex networks. Methods range from entropy-based and centrality models to machine learning and percolation theory, providing complementary perspectives on the challenges that influence maximization and network analysis.
Shang et al. propose an agent-based day-to-day traffic network model incorporating information percolation, which examines the spread of traffic information across networks [14]. Similarly, Shang, Han, and Ochieng extend this approach by utilizing percolation theory to model the evolution of day-to-day traffic patterns. These studies highlight the role of percolation in understanding dynamic traffic systems and information flow [15].
Several researchers have leveraged information entropy to identify influential nodes. Zhao, Bao, and Chen rank influential nodes using an information entropy method, providing insights into the structural importance of nodes in complex networks [16]. Guo et al. further develop this concept by proposing an entropy-based approach to identify critical nodes. Such entropy-based methods are effective in quantifying node influence from a statistical perspective [17].
Influence maximization, particularly in social networks, is a widely studied problem. Ma et al. focus on detecting top-spreader nodes in the SIoT to maximize spreading influence [18]. Similarly, Liu, Shen, and Li present a novel influence maximization algorithm based on GC-centrality, which optimizes the spread of influence in social graphs [19]. Molaei, Fard, and Bouyer improve influence maximization in the SIoT [20], while You, Liu, and Bai address imbalanced heterogeneous networks using reinforcement learning [21].
Recent advancements in machine learning have led to novel methods for identifying influential nodes. Singhal and Saxena propose BO-CBoost, a framework leveraging machine learning to predict node influence [22]. Stolarski, Piróg, and Bródka utilize machine learning techniques to optimize influence spread [23], while Kou et al. employ a graph multihead attention regression model for node ranking [24]. These studies highlight the growing role of artificial intelligence in addressing complex network problems. Community detection and structural decomposition are also explored for identifying influential spreaders. Kazemzadeh et al. leverage community structures to maximize influence in social networks [25]. Mohapatra and Dash propose a three-level scoring approach based on community and decomposition structures to rank influential spreaders effectively [26]. Game-theoretic approaches have been utilized to address the influence spread problem. Hu et al. investigate influential node identification from the perspective of attack–defense games [27]. Wang et al. introduce a homophilic and dynamic influence maximization strategy using the Independent Cascade Model [28]. Song et al. adopt deep reinforcement learning for online dynamic influence maximization [29].
The dissemination of information in urban environments is a critical aspect of modern city management, influencing areas such as transportation, emergency response, and sustainability. Zhu et al. analyzed the statistical characteristics and community structures of urban road networks, providing a foundational understanding of network topology and connectivity [30]. Their findings are highly relevant for designing information dissemination devices, as the structure of road networks directly impacts the flow of information across urban areas. Shang et al. explored the diffusion of electric vehicles (EVs) in Beijing, emphasizing the role of indirect network effects such as charging infrastructure and social influence [31]. This study highlights the importance of understanding diffusion dynamics in urban systems, which can be directly applied to the dissemination of information. Bi et al. proposed a joint optimization framework for managing pedestrian, information, and energy flows in emergency response systems, incorporating energy harvesting and sharing mechanisms [32]. This work is particularly relevant for designing information dissemination devices in high-stakes scenarios, such as emergencies, where efficient and reliable communication is critical. Shang et al. conducted a spatiotemporal analysis of carbon footprints in urban public transport systems using smart card data [33]. This study demonstrates the power of data-driven approaches in understanding urban dynamics, which can be applied to the design of information dissemination devices.
Additional studies propose innovative metrics and frameworks to identify influential nodes. Curado, Tortosa, and Vicent present a return random walk gravity centrality measure [34], while Mohammad et al. introduce an isolating coefficient-based framework [35]. Meng et al. develop a multidimensional centrality metric for ranking nodes [36], and Mahapatra et al. propose a linguistic Z-graph centrality measure for application in social networks [37].
Centrality measures play a crucial role in solving network problems by identifying the most important nodes within a network based on their structural significance. These measures, including degree centrality, closeness centrality, betweenness centrality, and eigenvector centrality, provide insights into node influence, connectivity, and control. Centrality-based approaches are fundamental for ranking influential nodes. Zhao, Wang, and Deng propose a global perspective for node identification [38], while Zareie et al. introduce the neighborhood correlation coefficient for assessing node influence [39]. Shang, Deng, and Cheong use an effective distance gravity model to identify influential nodes [40], and Yang and Xiao extend this model by incorporating the k-shell method for greater accuracy [41]. Esfandiari et al. combine the collaborative roles of k-shell and PageRank centrality, demonstrating a hybrid approach for influential node detection [42].
Given that SIOT networks are emerging networks, there are many challenges facing this type of network. Devices, as the most important component of SIoT networks, have always been the focus of researchers. One of the key roles of devices in SIOT networks is their use in information dissemination.
3. The Proposed Method of Identifying Influential Devices
A SIoT network can be represented as a graph or a complex network where devices act as nodes, and their relationships or interactions are represented as edges (links) between these nodes. This graph-based representation allows for an efficient analysis of connectivity, relationships, and information dissemination processes in SIoT networks. The representation of an SIoT network as a graph enables the modeling, analysis, and optimization of device interactions. By using nodes to represent devices and edges to capture relationships, and applying topological and centrality-based analyses, one can identify critical devices, optimize communication, and enhance network performance. This structured representation serves as a foundation for understanding the dynamics of information dissemination, fault detection, and collaboration within the SIoT environment. SIoT networks can be represented as a graph denoted as G(U, D, E). U represents the set of user-type nodes, denoted as U = {p1, p2, …, pN}, where |P| = N. D represents the set of device-type nodes, denoted as D = {d1, d2, …, dM}, where |D| = M. E represents the set of temporal links or edges between nodes, denoted as E = {e1, e2, …, eL}, where |E| = L.
Device centrality measures in SIoT networks are crucial for evaluating the importance of devices in the network. These measures are adapted from traditional graph theory and social network analysis, where nodes (devices) and edges (relationships) form a dynamic and interconnected ecosystem. Centrality quantifies the significance of a node (device) in a network based on its position and its ability to interact or influence other nodes. In the context of SIoT, centrality measures help analyze communication efficiency, device reliability and connectivity, data dissemination capabilities, and resource management optimization.
Device centrality measures are essential tools for analyzing SIoT networks. Device centrality measures help optimize network performance, enhance resource management, and improve communication efficiency by identifying critical devices based on their connectivity and influence. For dynamic and large-scale SIoT systems, balancing computation complexity and accuracy remains a key research area.
3.1. Device Degree Centrality
- •
deg(d) is the degree (number of edges) of the device d.
In SIoT networks, degree centrality provides an essential measure of a device’s connectivity and its immediate role in the network. By identifying highly connected devices, degree centrality enables better resource allocation, communication efficiency, and failure analysis. Despite its simplicity, it remains a foundational tool for analyzing IoT and SIoT systems. Examples in SIoT are: Smart Home Network: A central hub (like a smart speaker) may have connections to multiple IoT devices (e.g., lights, thermostats, and cameras), giving it high degree centrality. Smart City Infrastructure: A central monitoring node in a smart city network may connect to traffic lights, sensors, and cameras, making it critical for the overall operation. Vehicular Networks: Vehicles with high degree centrality can serve as data relays, connecting to other vehicles or roadside units.
3.2. Device Betweenness Centrality
- •
σst: Total number of shortest paths from node s to node t
- •
σst(d): Number of those shortest paths that pass through device d
- •
N is the total number of nodes in the network
- •
The denominator represents the total number of possible pairs of nodes (excluding d)
In SIoT networks, betweenness centrality is a vital metric for identifying devices that serve as communication bridges or intermediaries. It helps in optimizing network routing, improving fault tolerance, and managing data loads. Despite its computational challenges, betweenness centrality is a powerful tool for analyzing the structural importance of devices within dynamic and interconnected SIoT systems. The example in SIoT, imagine a smart city where traffic sensors are interconnected. A specific sensor located at a busy intersection may have high betweenness centrality because it acts as a bridge for data passing between other sensors. Its failure could disrupt data flow across the network.
3.3. Device Closeness Centrality
Device closeness centrality is a key metric in SIoT networks that measures how efficiently a device can communicate with all other devices in the network. It focuses on the proximity of a device to all other nodes, emphasizing communication speed and efficiency. Device closeness centrality quantifies the average distance (in terms of shortest paths) between a device and all other devices in the network. A device with high closeness centrality is “closer” to all other devices, meaning it can interact with them faster and more efficiently. Device closeness centrality is a vital metric in SIoT networks for evaluating devices based on their communication efficiency and proximity to other devices. A SIoT operator can optimize routing, enhance data dissemination, and improve overall network performance by identifying devices with high closeness centrality. Despite challenges like computational complexity in dynamic networks, closeness centrality remains a powerful tool for analyzing and improving SIoT systems.
- •
d(u, d) is the shortest path distance between device d and node u
- •
The denominator sums the distances from device d to all other nodes.
Devices with high closeness centrality have shorter average distances to all other devices, making them efficient for data transmission and communication. Devices with high closeness centrality can quickly disseminate information to the rest of the network, which is critical in SIoT applications like smart cities, smart homes, or healthcare systems. These devices are well-positioned to distribute tasks, reducing latency and optimizing resource allocation. The example in SIoT, imagine a smart city network with traffic sensors, cameras, and controllers. A central node (e.g., a city server or gateway) with high closeness centrality can efficiently communicate with all other devices, enabling real-time decision-making for traffic management or security monitoring.
3.4. Device Eigenvector Centrality
- •
CE(d): Eigenvector centrality of device d
- •
λ: The largest eigenvalue of the adjacency matrix A
- •
Adu: Entry in the adjacency matrix indicating the connection between device d and node u (1 if connected, 0 otherwise)
- •
N(d): Set of neighboring devices of d
- •
The centrality is obtained iteratively until the values converge.
In simple terms, the centrality of a device depends on the centralities of its neighbors.
Devices with high eigenvector centrality are not only well-connected but also connected to other influential devices, making them critical for network influence. Devices with high eigenvector centrality can act as efficient sources or relays for broadcasting information across the network. In SIoT networks, identifying highly central devices helps optimize routing paths and reduce communication overhead. Eigenvector centrality helps pinpoint critical devices whose failure might significantly disrupt the network. Devices with high eigenvector scores are ideal for distributing resources (e.g., data and bandwidth) as they reach the most influential nodes quickly.
3.5. Device Katz Centrality
Device Katz centrality is a refined centrality measure used in SIoT networks to evaluate the importance of a device by considering both direct connections and indirect connections (through neighbors of neighbors and beyond) in the network. It assigns more weight to close neighbors while progressively reducing the weight of longer connections. Device Katz centrality calculates the centrality of a device by summing the number of paths of all lengths (direct and indirect) that connect it to other devices. Paths that are longer contribute less to the centrality score, emphasizing the importance of proximity while still accounting for global network influence.
- •
A: The adjacency matrix of the network
- •
α: A decay factor that controls the weight of longer paths (0 < α < 1/λmax), where λmax is the largest eigenvalue of A)
- •
β: An initial centrality score given to all devices to ensure that even isolated nodes have some centrality.
Katz centrality considers both direct connections and indirect paths, capturing the overall influence of a device in the network. Devices connected to highly influential neighbors receive higher centrality scores, similar to eigenvector centrality but with a decay factor. Unlike eigenvector centrality, Katz centrality assigns a baseline score (β\betaβ) to all devices, ensuring no device has zero centrality. Devices with high Katz scores act as communication hubs, efficiently relaying information through direct and indirect paths. Devices with high Katz centrality can facilitate efficient data dissemination, resource sharing, and routing in SIoT networks.
3.6. Device Coreness Centrality
Device coreness centrality (based on the k-core decomposition) is a measure used in SIoT networks to determine how “deeply embedded” a device is within the network structure. It identifies the core regions of the network by peeling off less connected nodes iteratively, leaving only the most central and well-connected devices. Coreness centrality assigns each device a coreness score based on its membership in the largest possible k-core subgraph. A k-core is a subgraph where every device (node) has at least k connections (degree). Devices in the innermost cores have higher centrality because they are part of the densest, most interconnected regions of the network.
The network is decomposed into k-cores, where k increases incrementally: Devices with fewer than k connections are iteratively removed from the network. The process continues until no nodes with fewer than k connections remain. Devices that survive longer in the decomposition (higher k) are assigned a higher coreness score.
Devices with high coreness scores are part of the most robust and interconnected regions of the network, making them critical for communication stability. High-coreness devices contribute to the resilience of the network. Removing such devices could disrupt the network’s structural integrity. Devices in high k-cores ensure connectivity even when peripheral or low-degree nodes fail. Devices with high coreness centrality are ideal for distributing information efficiently across the network because of their central position in dense regions. Devices in higher cores serve as central hubs for routing data across the network, reducing delays and improving efficiency. In the context of SIoT , consider a smart city network that includes traffic sensors, cameras, and communication hubs. The outer layers, characterized by low k-cores, consist of peripheral devices such as isolated sensors with minimal connectivity. In contrast, the inner layers, represented by high k-cores, comprise central hubs, servers, or routers that connect numerous devices and participate in densely interconnected subnetworks. This structure highlights the distinction between less connected peripheral devices and the highly interconnected core components of the network. For instance, a centralized traffic controller will have a higher coreness score because it remains part of the network even as less connected devices (peripheral sensors) are removed.
- 1.
Initialize k = 1.
- 2.
Remove all devices (nodes) with degree less than k.
- 3.
Increment k and repeat until all devices satisfy the k-core condition.
- 4.
Assign each device its corresponding k-value as the coreness score.
3.7. Device Pagerank
PageRank is a widely used centrality measure that evaluates the importance of a device in a network based on its connections and the importance of its neighbors. Originally developed by Google to rank web pages, PageRank has been adapted to SIoT networks to determine the influence of devices. PageRank measures a device’s importance by considering both direct connections and the influence of those connections. A device is considered important if it is linked to other important devices. It is an iterative method where importance “flows” through the network.
- •
PR(d): PageRank score of device v
- •
N: Total number of devices in the network
- •
η: Damping factor representing the probability of continuing navigation in the network
- •
N(d): Set of devices linking to d
- •
PR(u): PageRank score of a neighboring node u
- •
L(u): The number of outgoing links (connections) of node u
- •
The term 1 − η/N ensures all nodes receive some rank, even isolated nodes
Devices with high PageRank scores play critical roles in the SIoT network by being well-connected and linked to other influential devices. High-PageRank devices are ideal for routing, data dissemination, and content delivery as they efficiently reach other devices. Devices with high PageRank can be prioritized for resource allocation (e.g., bandwidth and energy) to ensure efficient operations. PageRank highlights devices whose failure could significantly impact the network, helping design fault-tolerant SIoT systems. PageRank aids in optimizing routing protocols, ensuring communication pathways involve important devices. The example in SIoT, consider a smart city network where Device A connects to many low-importance devices, and Device B connects to fewer but highly influential devices like central servers or data hubs. With PageRank, Device B will likely have a higher score because its connections are to influential devices, demonstrating its global importance. PageRank iteratively propagates importance through the network, rewarding devices connected to other critical devices.
Influence coefficients can be derived or adjusted based on various centrality metrics to assess the importance and impact of users and devices. Users and devices may differ in interaction types and frequency. Assign weights to centrality scores based on the type of node (e.g., a user’s interactions might have more weight than a device’s).
4. Evaluation of the Proposed Method
To investigate the effects of centrality criteria in order to identify effective devices in information dissemination in the SIOT network, a well-known dataset of the SIOT network type has been selected, and centrality criteria have been calculated in this dataset. Also, to investigate the efficiency of each criterion in information dissemination, the susceptible–infected–recovered (SIR) diffusion model has been used.
4.1. Dataset Properties
The project is a large-scale initiative in Santander, Spain, designed to transform the city into a testbed for IoT technologies in urban environments [43]. Launched in 2010 as part of the European Union’s Seventh Framework Programme (FP7), the project involved the deployment of over 20,000 IoT sensors across the city, enabling real-time data collection and experimentation. The main goal of the project was to create a living lab for developing smart city applications, focusing on areas such as environmental monitoring, smart parking, traffic management, and waste management. By leveraging technologies like wireless sensor networks, cloud computing, and mobile applications, SmartSantander aimed to improve urban living through data-driven services that enhance efficiency, sustainability, and citizen engagement. It has become a global model for smart city initiatives, showing how IoT can optimize city operations and foster innovation while addressing environmental and societal challenges. The datasets from the SmartSantander project are diverse and provide valuable insights into various aspects of urban life, from environmental monitoring and traffic management to waste collection and citizen engagement. They are an essential resource for smart city research and development, allowing for the testing of IoT solutions in a real-world context. These datasets not only help optimize city services but also foster innovation by providing open access to real-time urban data for developers, researchers, and other stakeholders.
- •
Environmental Monitoring: These datasets provide data about the city’s environmental conditions, which help monitor air quality, noise pollution, and weather patterns
- •
Smart Lighting: The project tested and collected data from smart street lighting systems, which adjust the brightness of streetlights based on environmental conditions or pedestrian presence
- •
Traffic and Mobility: These datasets focus on urban mobility, including real-time data on traffic flow, vehicle counts, and road usage
- •
Citizen Interaction: SmartSantander also provided data related to citizen interaction with the smart city systems
Table 1 shows the characteristics of the datasets.
| Data models | N | E | |U| | |D| | 〈k〉 | kmax | 〈c〉 | H |
|---|---|---|---|---|---|---|---|---|
| Environmental monitoring | 271 | 1023 | 223 | 43 | 13.12 | 47 | 0.61 | 4.6 |
| Smart lighting | 765 | 4105 | 530 | 232 | 11.21 | 76 | 0.27 | 18.5 |
| Traffic and mobility | 1091 | 5383 | 654 | 421 | 17.01 | 123 | 0.62 | 8.1 |
| Citizen interaction | 1875 | 11,824 | 1206 | 683 | 24.52 | 184 | 0.31 | 21.3 |
In Table 1, N is the number of nodes, E is the number of edges, |U| is the number of users, |D| is the number of devices, <k> is the average degree of nodes, kmax is the maximum degree of nodes, 〈c〉 is the average clustering coefficient, and H is the heterogeneity coefficient.
Given that the SIR model is used to evaluate the efficiency of the centrality criteria for identifying effective nodes, the parameters of the SIR model should be adjusted according to the datasets. Table 2 shows the values of the SIR model parameters. These values are adjusted based on the datasets and in order to implement the different methods in finding effective devices in information dissemination in a stable manner. In Table 2, 〈k〉 is the average degree of network nodes, and 〈k2〉 is the average degree of the next nearest neighbors.
| Parameters | Value | Description |
|---|---|---|
| λ | 1.5 | Initial infected scale |
| p | 0.002 | Ratio of the number of spreaders |
| β | 〈k〉/〈k2〉 | Recovery rate |
| η | 0.25 | Damping factor |
| tEnvironmental Monitoring | 1000 | Dataset time frame (second) |
| tSmart Lighting | 2000 | Dataset time frame (second) |
| tTraffic and Mobility | 10,000 | Dataset time frame (second) |
| tCitizen Interaction | 12,000 | Dataset time frame (second) |
| Run fold | 50 | Independent executions |
4.2. Evaluation Metrics Using the SIR Model
The SIR model is a compartmental model used in epidemiology to simulate the spread of infectious diseases within a population [44]. It divides the population into three distinct groups or compartments: Susceptible (S): Individuals who are not yet infected but are at risk of contracting the disease if exposed to it. Infected (I): Individuals who are currently infected and capable of transmitting the disease to susceptible individuals. Recovered (R): Individuals who have recovered from the disease and are assumed to be immune, meaning they can no longer be infected or transmit the disease. To model information dissemination across the SIoT network using the SIR model, the nodes transition through the states: S, I, and R.
Basic Assumptions of the SIR Model are: (1). Every individual in the population has an equal chance of interacting with every other individual. (2). The model typically assumes a closed population where no new individuals are born, and no one dies (except because of the disease, which is not explicitly modeled in the basic SIR version). (3). Once an individual recovers, they are immune for life, and no one can revert back to being susceptible.
Using the SIR model to measure the performance detection of effective devices in a SIoT network is an innovative approach to model the spread and detection of devices that participate effectively in information dissemination within the network. This methodology can be used to assess how devices interact with each other and contribute to the overall network’s performance in terms of data sharing, communication, and dissemination of information.
To apply the SIR model to the detection of effective devices, we can modify the traditional epidemiological equations to represent the dynamics of devices in the network:
- •
S(t) is the number of susceptible nodes at time t
- •
I(t) is the number of infected nodes at time t
- •
R(t) is the number of recovered nodes at time t
- •
β is the infection rate
- •
γ is the recovery rate
The SIR model can be evaluated using several performance measures to assess the behavior of infection spread (e.g., malware, information dissemination, or updates) over a network like the SIoT. These performance measures help analyze the effectiveness of devices or strategies in controlling or optimizing the spread of the infection. The SIR model performance measures allow for a detailed analysis of infection or information dissemination dynamics in SIoT networks. Metrics like peak infection, final affected scale, and time to peak are crucial for evaluating the spread’s impact and designing strategies to optimize or contain dissemination processes. Network-specific measures (e.g., centrality) further enhance the ability to identify and leverage key nodes for improving overall performance.
4.2.1. Peak Infected Ratio Imax
4.2.2. Infected Scale Function
- •
N is the number of network devices
- •
nI(t) is the number of infected devices at time t
- •
nR(t) is recovered devices at time t
- •
Final scale of affected nodes
4.2.3. Average Length of the Shortest Path
4.3. Results and Discussions
After implementing different methods of identifying effective devices on real-world datasets in the SIO simulator software [45], results have been obtained that can be analyzed to examine the efficiency of each. As described in Section 4.2, the efficiency evaluation criteria of the SIR model indicate the efficiency of each criterion for identifying effective nodes.
Figure 3 shows the peak infected ratio (Imax) of centrality measures on different datasets. As can be seen in Figure 3, the highest diffusion rate over time is related to the coreness and Katz measures in datasets with a high degree of heterogeneity. In datasets with a low degree of heterogeneity, the betweenness and closeness centrality measures had the highest diffusion rate of nodes. This indicates that the greater the degree of heterogeneity in the SOIT network, the higher the diffusion rate.
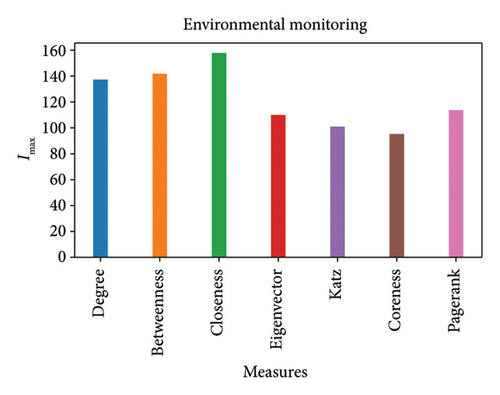
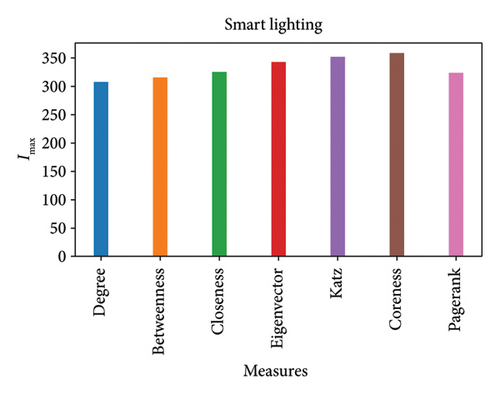
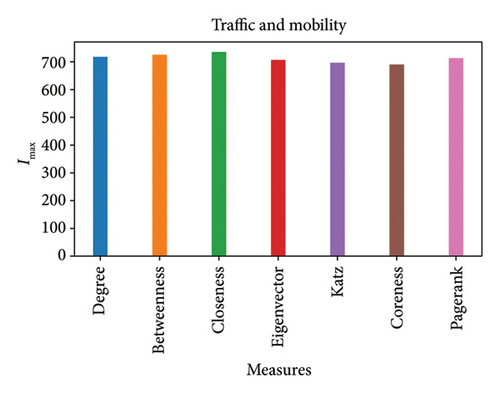
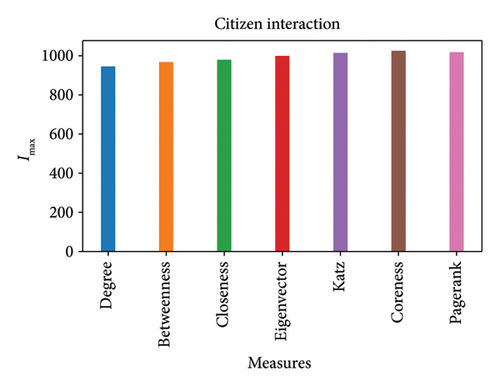
Figure 4 shows the infected scale (F(t)) of each centrality measure in different datasets. Results demonstrate that in datasets with a high degree of heterogeneity, effective nodes identified using the coreness and katz measures have a higher diffusion rate compared to other criteria in the network. However, in datasets with high clustering coefficient and low heterogeneity, the betweenness and closeness centrality measures performed better in terms of the rate of information dissemination by the effective nodes. The results also show that in datasets with high volume, the difference between the criteria in terms of the rate of dissemination is less than in quiet datasets.
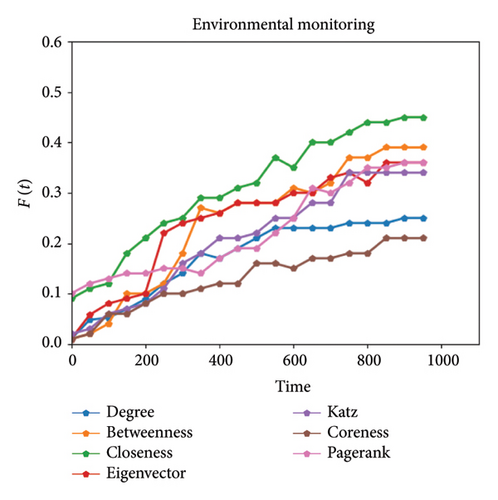
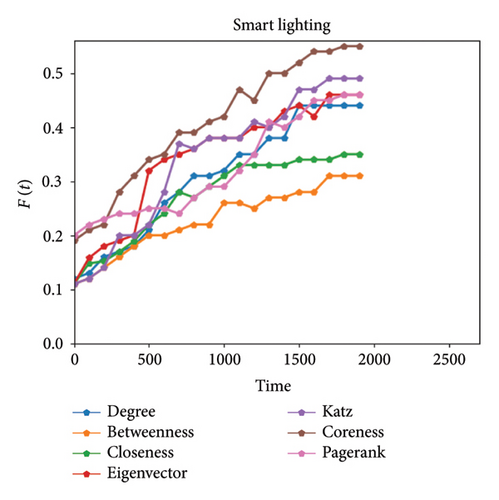
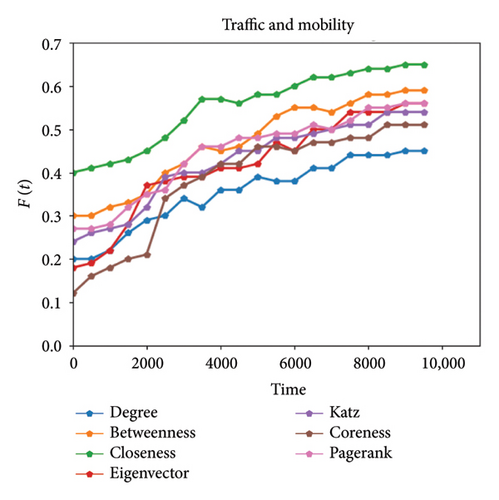
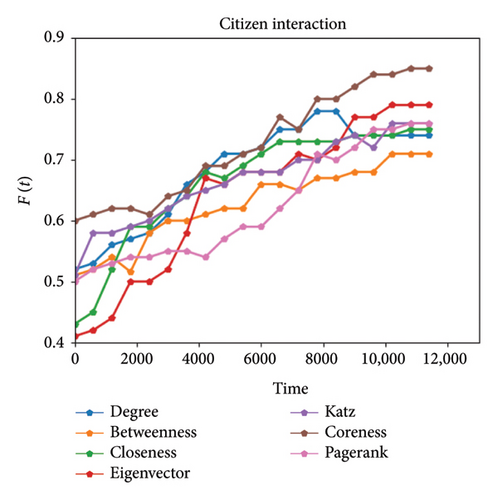
Figure 5 shows the final affected (F(tc)) scale of each centrality criterion in identifying nodes that are effective in spreading information on different datasets. The final affected scale represents the total fraction of devices that received the disseminated information. This measure is crucial for analyzing the performance of dissemination methods in networks like SIoT. As can be seen in Figure 5, in datasets with high heterogeneity, effective devices identified using the coreness and katz measures had higher final diffusion rates compared to other centrality criteria. The results also show that in datasets with low heterogeneity and high clustering coefficient, the betweenness and closeness centrality measures performed better in the final diffusion.
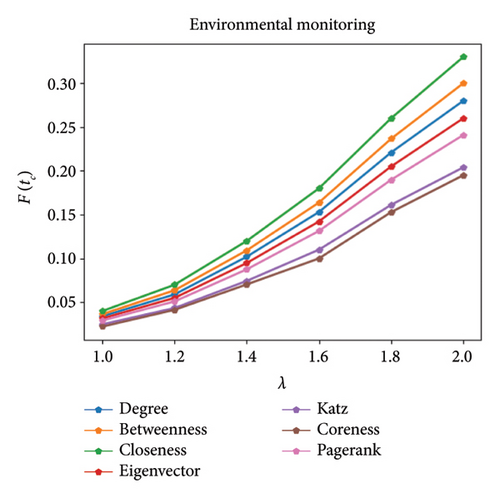
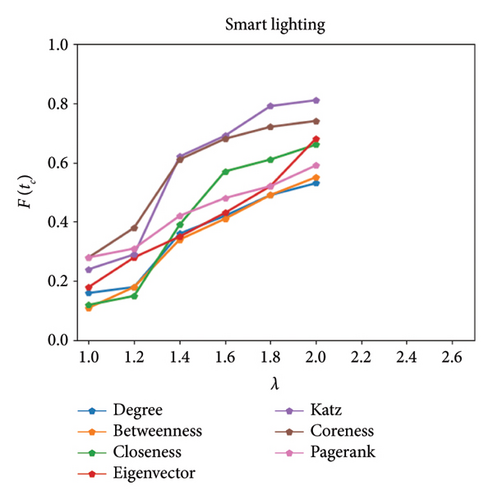
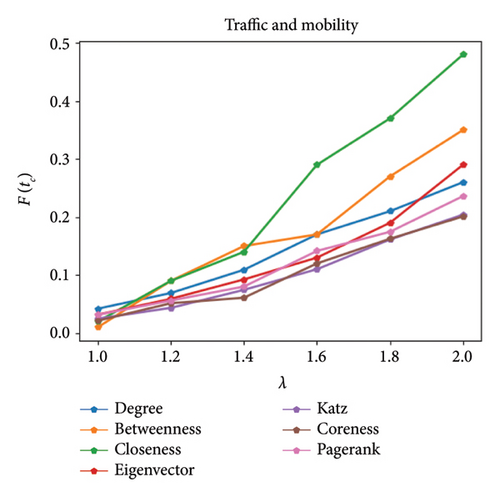

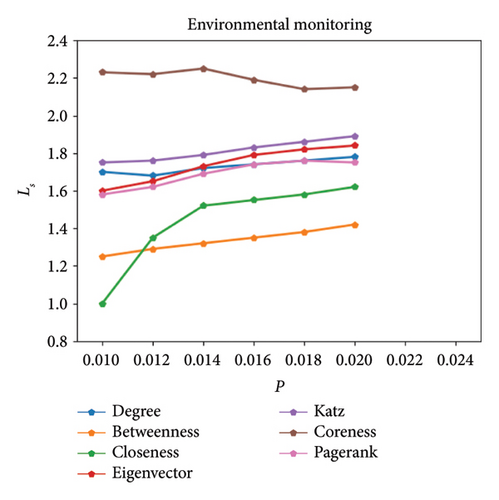
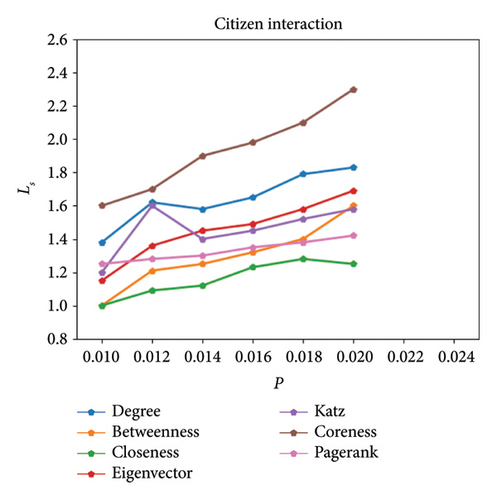
Figure 6 shows the average length of the shortest paths (Ls) between effective devices identified by each of the centrality measures in different datasets. This metric captures the “average communication distance” among the influential nodes in the network. A smaller average path length indicates that influential nodes are closely connected, allowing faster and more efficient dissemination. A larger average path length suggests that the influential nodes are spread out, potentially delaying information propagation. In general, the results show that the distances between effective devices identified by the coreness criterion are the greatest distant from each other, and the effective devices identified by clossness centrality are the least distant from each other.
As mentioned above, there are various devices in SIoT networks that are divided into two groups in terms of mobility: static and mobile. Figure 7 shows the average number of mobile and static devices in the set of effective devices identified by all centrality measures in each of the datasets. As the results show, the number of effective mobile devices was higher than that of static devices in all datasets. This indicates that mobile devices play a more effective role in information dissemination.

The clustering coefficient is a key factor in determining the effectiveness of devices in information dissemination within Complex SIoT (CSIoT) networks. It influences the rapid spread of information in local clusters, highlights redundancy that ensures resilience, and helps identify critical devices for bridging and inter-cluster communication. SIoT networks can optimize device roles and communication strategies by leveraging clustering insights, enhancing both local and global efficiency while maintaining robust information flow. In CSIoT networks, the clustering coefficient, a measure of the degree to which nodes (devices) form tightly knit groups, plays a significant role in information dissemination. A high clustering coefficient facilitates rapid local communication by enabling dense interconnections within clusters, making certain devices particularly effective for intra-cluster information spread. This dense connectivity also enhances network resilience by creating redundant paths, ensuring reliable communication even in the face of link failures. However, high clustering can also create dependencies on bridge devices for inter-cluster communication, making these devices critical for network-wide dissemination. Effective devices can be identified for specific roles, such as local broadcasting or inter-cluster bridging by analyzing the clustering coefficient alongside centrality measures. These insights support optimized network design, efficient information flow, and dynamic role allocation, enabling robust and efficient operation in SIoT networks. In high-clustering networks, closeness centrality highlights nodes that minimize the average distance to other clusters. Nodes with high closeness centrality serve as efficient spreaders of information within or across tightly knit communities. Local clustering enhances the predictive power of closeness as it amplifies the importance of nodes that reduce inter-cluster distances. In high-clustering networks, betweenness centrality excels at identifying “bridge” nodes connecting different clusters. These nodes are often critical for maintaining the overall flow of information or resources across the network. The existence of tightly knit communities means fewer nodes will act as bridges, making their roles more pronounced and their betweenness scores more impactful.
The high degree of heterogeneity in CSIoT networks significantly influences the identification of effective devices for information dissemination. Heterogeneity manifests in diverse device capabilities, connectivity patterns, and roles, creating both challenges and opportunities for optimizing network performance. High-capability devices, such as gateways and hubs, excel in disseminating information broadly, while low-capability devices are better suited for localized tasks. Uneven connectivity highlights the importance of centrality metrics, such as degree, betweenness, and eigenvector centrality, in identifying critical devices for localized and network-wide dissemination. In addition, heterogeneity enhances network resilience by providing redundancy, though it also necessitates managing resource constraints to prevent overburdening critical nodes. The dynamic and application-specific nature of heterogeneous SIoT networks demands adaptive strategies for identifying effective devices, and ensuring scalability, sustainability, and efficiency. A high degree of heterogeneity in SIoT networks significantly impacts the identification of effective devices for information dissemination. SIoT systems can optimize communication strategies and enhance resilience by leveraging the diversity of device roles, connectivity, and capabilities. However, this requires careful consideration of centrality metrics, resource constraints, and application-specific needs to ensure efficient and sustainable operation. Understanding and harnessing the heterogeneity of SIoT networks is essential for achieving robust and adaptive information dissemination.
In heterogeneous networks, where some regions are densely connected while others are sparse, coreness helps pinpoint nodes in densely connected subgraphs. These nodes are critical for disseminating information efficiently within robust network cores. Coreness filters out peripheral nodes with low connectivity, focusing on influential nodes in the network’s backbone. In a smart city SIoT, coreness centrality can identify key nodes like gateways in transportation or energy systems that ensure efficient data flow within critical subnetworks. Katz centrality accounts for both direct neighbors and the influence of distant nodes. In heterogeneous networks, this is critical for recognizing nodes that are not highly connected but influence large portions of the network through indirect paths. It highlights nodes that may not have the highest degree but act as bridges or amplifiers of information because of their strategic position. In a healthcare SIoT, Katz centrality can identify wearable devices or mobile hubs that connect to central servers and indirectly influence numerous other devices.
Coreness and Katz centrality are particularly effective in high-heterogeneity SIoT networks because they leverage the unique strengths of heterogeneous nodes. Coreness identifies key nodes in robust, densely connected subgraphs, ensuring local resilience and efficient information flow. Katz centrality highlights influential nodes with global impact, ensuring widespread dissemination. Together, these measures enable the identification of effective devices for diverse applications, ensuring optimal performance in complex and heterogeneous SIoT networks.
5. Conclusions
In this paper, the role of devices in the dissemination of information in SIOT networks has been investigated. Centrality measures are considered as the basis of information dissemination. The centrality measures for the devices have been redefined and based on these measures, the influential devices in information dissemination have been identified. The results have shown that the centrality measures of closeness and betweenness have a better performance in identifying influential devices that are effective in spreading information in SIOT networks that have a high degree of heterogeneity. Also, for networks that have a high clustering coefficient, the corner and Katz measures perform better than other measures. The distance between effective devices identified by the coreness criterion is the greatest distant from each other, and the effective devices identified by clossness centrality is the least distant from each other. Finally, the results show that mobile devices play a more important role in disseminating information than static devices.
This study is presented as a novel approach for identifying key devices in SIoT networks using centrality measures. While the framework offers valuable insights into optimizing information dissemination, it is important to acknowledge its limitations to guide future research and improvements. These limitations include the reliance on static centrality measures, simplified assumptions about device behavior, and insufficient consideration of network heterogeneity, social factors, and temporal dynamics. In addition, scalability concerns, lack of real-world validation, and the absence of security and privacy considerations may restrict the framework’s applicability in practical scenarios. Future work should address these limitations to enhance the robustness and applicability of the proposed approach in real-world SIoT networks.
Conflicts of Interest
The authors declare no conflicts of interest.
Funding
No funds, grants, or other support was received. This work was supported by the Scientific Research Project of Hunan Provincial Education Department (24C1021).
Acknowledgments
This work was supported by the Scientific Research Project of Hunan Provincial Education Department (24C1021). Also, we would like to sincerely thank Hao Li, Zhaoning Tian, and Xiaohui Li for their valuable collaboration and contributions to the initial version of this paper.
Open Research
Data Availability Statement
The data that support the findings of this study are available from the corresponding author upon reasonable request.


