Traveler Preferences in the Digital Transformation Toward Smart Tourism Transportation
Abstract
Smart tourism is gaining prominence in the tourism industry by improving efficiency and enhancing tourists’ satisfaction. It often involves the use of advanced digital technologies. Although integrating these technologies in transportation can yield significant benefits, but further exploration of tourist’s perceptions on digital transformation is necessary. In this research, a two-step cluster analysis was employed to segment travelers into different groups and to identify their preferences for the use of key digital technologies in transportation hubs. We surveyed 180 passengers to understand their preferences for transportation service digitization. The analysis revealed three segments of traveler preferences: (i) manual—travelers who prefer assistance from customer service officers, (ii) automated—travelers who prefer using technology-based self-service facilities, and (iii) mobile—travelers who prefer more personalized, fully digitized services. By understanding the diverse preferences of different traveler segments, tourism providers can tailor their digitization efforts to better meet customers’ needs.
1. Introduction
Smart tourism, leveraging advanced digital technologies such as artificial intelligence, mobile applications, and biometric systems, is revolutionizing the global tourism industry by enhancing service efficiency and tourist satisfaction [1, 2]. Transportation hubs, integral to smart tourism, are undergoing rapid digital transformation to streamline ticketing, payment, and customer service processes, directly influencing passenger experiences and destination competitiveness [3]. The Greater Bay Area (GBA), a premier tourism and economic hub in China, is at the forefront of this transformation, with significant investments in digital infrastructure to support surging international tourist volumes [4]. However, a pressing policy-level challenge undermines these efforts: without data on tourist preferences for digital technologies, investment risk inefficiency, and exclusion, potentially alienating segments such as older travelers or those favoring manual services, thus reducing passenger satisfaction and destination appeal [5, 6].
This policy challenge stems from a critical research gap. While studies by Halpern et al. [3] segmented passenger preferences for digital technologies in Norwegian airports, their European focus limits applicability to non-Western contexts such as the GBA. Shiwakoti et al. [7] examined individual technology preferences but overlooked shared group preferences, and Rubio-Andrada et al. [8] focused narrowly on gender perspectives. The absence of tourist-specific preference data in rapidly digitizing regions hinders the development of inclusive digitization policies, leading to overinvestment in technologies such as biometrics or underinvestment in accessible options such as staff-assisted services.
This study proposes a solution by employing a two-step clustering approach [9] to segment tourist preferences for digital technologies in GBA transportation hubs, hypothesizing that preferences can be grouped into manual, automated, or digitalized clusters influenced by demographic and trip-related factors. By identifying these segments, policymakers can prioritize investments in technologies that balance inclusivity and innovation, ensuring efficient resource allocation and enhanced tourist experiences. The contributions are threefold: (i) proposing a two-step clustering approach to identify distinct segments of tourist preferences for digital technologies, offering practical implications for transportation management; (ii) providing guidelines for the tourism industry to prioritize investments in digital technologies appealing to larger segments; and (iii) exploring how digitization can personalize services to accommodate diverse preferences.
This paper is organized as follows. Section 2 reviews related studies on transportation service digitization and customer segmentation. Section 3 details the methodology, including survey design and two-step cluster analysis. Section 4 discusses the results and implications. Section 5 provides a detailed discussion of the study’s findings. Section 6 outlines the limitations observed in the study, and Section 7 concludes with study findings and future research directions.
2. Literature Review
2.1. Transportation Service Digitalization
Improving the efficiency and quality of passenger services while reducing operating costs are key drivers for digitization in transportation [10, 11]. Passenger travel experiences significantly influence their future transportation choices, with indicators such as service price, travel speed, connectivity, and comfort shaping satisfaction [12, 13]. Digital technologies, including mobile ticketing, real-time journey planners, and biometric authentication, transform how passengers interact with transportation systems [14]. For example, mobile applications providing real-time flight and transportation information enhance accessibility and convenience for tourists [15]. Digital ticketing and payment systems streamline operations, ensure secure transactions, and improve safety [4], reinforcing the need for transportation providers to align digitization efforts with passenger expectations, particularly for tourists in high-traffic hubs such as the GBA.
2.2. Ticketing Services
In the public transportation system, it is generally recognized that ticketing has a great impact on passenger convenience [16]. In the domain of digital payments, it is estimated that the market division of digital ticketing services will grow, as driven by the transportation sector [17]. A digital ticketing service combines both ticketing and payment solutions, which enable customers to make request, pay, activate, and validate a ticket through a digital device. There are many different technologies in implementing the digitalization of ticketing services, and each has its own pros and cons. What influence the choice of digital ticketing is the compatibility with the existing infrastructure, the funding, and maintenance costs [18]. Apanasevic and Markendahl [17] showed that digital ticketing services could achieve several values, such as upgraded technological functionality, financial value, operational value, and credibility and relationship between customers. These values lead the transportation companies to consider digital ticketing and digital payment services. Due to the rapid digitalization transformation, all transportation systems are more focused on applying digital technologies to facilitate the operation process and passenger experience enhancement [19].
2.3. Customer Preference Segmentation
Clustering algorithms are widely used to group similar objects into clusters. In customer preference segmentation, clustering algorithms are used to group customers based on their preferences. Clustering methods such as K-means, hierarchical clustering, and two-step clustering are widely used. K-means is a simple and effective method that can be used for segmenting customers into a fixed number of clusters (k-clusters) based on their preferences [20]. Hierarchical clustering recursively decomposes a set of objects using a tree-like structure until a certain condition is met [21]. This approach is more complex than K-means as it does not start with a predetermined number of clusters. Two-step clustering is a hybrid method that combines the strengths of K-means clustering and hierarchical clustering. As such, the two-step clustering algorithm has some unique advantages compared with the K-means and hierarchical clustering approaches. In addition to determining the number of clusters automatically, a two-step algorithm can handle mixed data types (for instance, categorical and mixed variables) [22]. It is also more robust to detect outliers [23].
2.4. Research Gap
The existing literature on transportation service digitization provides valuable insights but reveals critical gaps that this study addresses. Halpern et al. [3] segmented passenger preferences for digital technologies in Norwegian airports, focusing on self-check-in and biometric systems, but their European context limits generalizability to non-Western regions such as the GBA. Shiwakoti et al. [7] examined individual technology preferences during the COVID-19 pandemic but overlooked shared preferences among passenger groups, reducing the applicability of their findings for large-scale digitization strategies. Rubio-Andrada et al. [8] explored gender-based satisfaction with smart airport technologies but neglected broader demographic factors, such as age or travel purpose, critical for comprehensive segmentation. Rahmoun and Baeshen [24] highlighted the role of digital marketing in shaping tourist destination preferences; however, their focus on marketing rather than operational digitization leaves a gap in understanding service-level technology adoption. Santos et al. [14] emphasized sustainability as a success factor for tourism destinations but did not address how digitization preferences vary among tourist segments. Collectively, these studies fail to examine tourist-specific preferences for transportation service digitization in non-Western contexts such as the GBA, where cultural and technological factors differ significantly.
3. Methodology
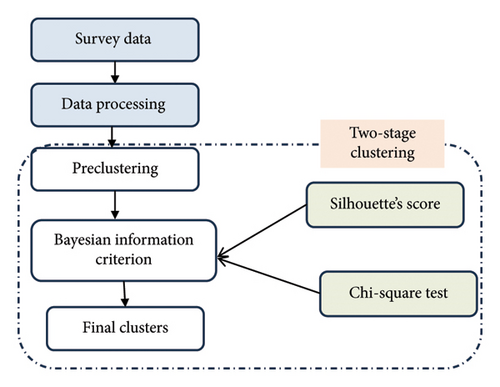
This section presents the methodology proposed for clustering passengers’ preferences for the digitization of the departure process. Figure 1 outlines the proposed methodology framework which consists of two stages, survey data collection and cluster analysis.

3.1. Survey Design
This research adopts a semistructured survey on passengers’ preferences for digital technologies throughout the departure process of passengers. The data related to demographics, trip characteristics, and preference-related variables are collected. The survey questions and response options are designed based on the current situation in the local transportation including the facilities that are available, launched, and to be established for passengers. At most seven key stages of a journey are considered including ticketing, baggage tagging, baggage storage, personal identification, security, payment, and customer service. Respondents are expected to select one option for each question, except for the customer service variable which could allow the respondents to select maximum five options. There are three categories for customer service variables: (1) staff in the information center, (2) self-service kiosks, and (3) mobile app. The result of the survey is used to determine the most relevant variables to include in the clustering analysis.
The survey included 183 respondents, with three responses excluded due to invalidity, resulting in a final sample of 180 passengers. While this sample size is modest, it is sufficient for two-step clustering analysis, as the method is robust for smaller datasets due to its ability to handle mixed data types (categorical and continuous) and detect outliers effectively [9]. The sample was carefully designed to capture diverse demographics and trip characteristics within the GBA, ensuring representativeness for the study’s context.
3.2. Two-Step Clustering
In this study, we use a two-step clustering to segment customers’ preferences for digitization. Two-step clustering [9] is a widely used method that involves two stages. In the first stage which is a preclustering stage, small clusters of similar data points are created based on the proximity of the data point. That is, small clusters of similar data points are created based on the distance between each data point and all other data points. In the second stage, which is the clustering stage, small clusters are merged to form larger clusters based on similarities between them. A chi-square test is used to determine whether there are significant differences between the subclusters identified.
3.3. Performance Evaluation of the Clustering Algorithm
Silhouette’s score ranges from −1 to 1. A score of 1 indicates the data point lies within the cluster, whereas a score of −1 indicates the opposite. The average of all Silhouette scores is used to evaluate the quality of the cluster formed. High Silhouette scores indicate good cluster quality (clustering algorithm with high consistency). On the other hand, a low Silhouette score is associated with a clustering algorithm with low consistency (i.e., poor cluster quality).
4. Results
4.1. Descriptive Statistics
A survey regarding digitization preferences has been conducted on 183 respondents. Three responses were excluded since they were invalid. The survey included questions related to trip characteristics, preferences for the digitization of ticketing and service, personal identification, and payment methods. The response on passenger preference at key stages is shown in Table 1.
| Variable | Option | Frequency | Percentage of respondents |
|---|---|---|---|
| Ticketing | Staff | 62 | 34.4 |
| Kiosk | 68 | 37.8 | |
| App | 50 | 27.8 | |
| Service | Staff | 61 | 33.9 |
| Kiosk | 109 | 60.6 | |
| Mobile | 10 | 5.6 | |
| Personal identification | Paper | 62 | 34.4 |
| Electronic | 83 | 46.1 | |
| Biometric | 35 | 19.4 | |
| Payment | Cash | 62 | 34.4 |
| Credit card | 29 | 16.1 | |
| Mobile | 89 | 49.4 | |
| Customer service | Staff | 80 | 44.4 |
| Kiosk | 75 | 41.7 | |
| QR code | 5 | 2.8 | |
| Chatbot | 58 | 32.2 | |
| Augmented reality | 21 | 11.7 | |
The survey response shows that two-thirds of respondents indicated that they prefer to access their ticketing through digital-based facilities such as kiosks (37.8%) and mobile applications (27.8%). However, more than 30% of respondents indicated their preference to maintain the paper-based tickets.
In terms of personal identification, it is suggested in adopting biometric technology for authentication. However, only 19.4% of the respondents prefer to use biometric technology for authentication. Paper (34.4%) or electronic (46.1%) tickets are the most preferred method for personal identification.
Regarding the digitization of the payment system, nearly half of respondents (49.9%) preferred to use mobile payment applications if they purchased tickets. Furthermore, only 16.1% of the respondents preferred to pay with an entity card, while 34.4% preferred to use cash. The result shows that most passengers prefer to use mobile applications and smart devices for payment. On the other hand, four out of 10 respondents indicated a preference for visiting customer service centers and self-service kiosks to get information. About half of the respondents preferred to use advanced technologies such as QR code, Chabot, and augmented reality (AR).
4.2. Two-Step Cluster Analysis
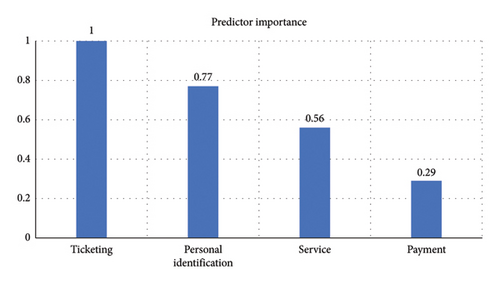
A two-step clustering analysis was conducted to identify clusters of passengers. To this end, the relative importance of predictor variables was computed in IBM SPSS Version 26. The result shown in Figure 2 shows the four variables, namely, ‘ticketing,’ ‘personal identification,’ ‘service,’ and ‘payment,’ that are important for clustering passenger preferences.

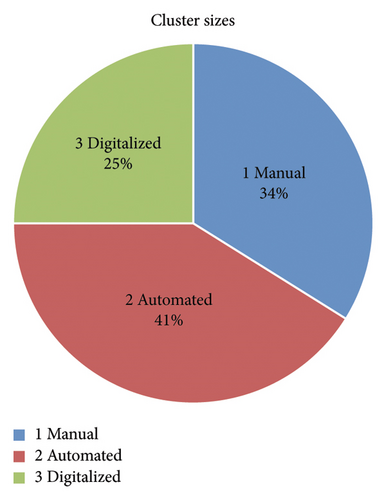
The four variables were employed in the two-step clustering analysis using IBM SPSS. Three cluster results were obtained, and the Silhouette score was computed to validate the consistency of the formed clusters. The result indicates that three clusters have an average Silhouette score of 0.6, which belongs to a good range. Passengers were then grouped into one of the three clusters based on their preferences for the digitization of transportation services. The clusters were labeled as ‘Manual,’ ‘Automated,’ and ‘Digitalized’. The label of each cluster is named according to the options selected by the respondents. In Cluster 1 (manual), respondents preferred to complete the processes with staff assistance. In Cluster 2 (automated), respondents preferred to complete the processes by themselves with self-service facilities. In Cluster 3 (digitalized), respondents preferred to use digitalized technologies and personalized self-service.
Figure 3 shows that the ‘automated’ clusters are the largest cluster out of three followed by ‘manual’ and ‘digitalized’ clusters. The ratio of the largest to the smallest cluster is 1.64 which is less than the threshold value of three [27], indicating sufficient balance among clusters.

4.3. Statistical Comparison Between Clusters
The chi-square test is used to determine the significant differences (i.e., independence) between the clusters formed. The chi-square test involves computing the test statistic χ2, the p value, and the degree of freedom (df) value. A cluster with p < 0.5 is considered significant. Table 2 shows the chi-square test to determine the relationship between clusters and passenger characteristics.
| % of respondents for each option | |||||||
|---|---|---|---|---|---|---|---|
| Variable | Characteristic | Manual | Automated | Digitalized | χ2 | df | p value |
| Gender | Male | 44.3 | 55.4 | 35.6 | 4.644 | 2 | 0.098 |
| Female | 55.7 | 44.6 | 64.4 | ||||
| Age | 18–35 | 36.1 | 52.7 | 37.8 | 10.138 | 4 | 0.038 |
| 36–54 | 32.8 | 36.5 | 42.2 | ||||
| Above 55 | 31.1 | 10.8 | 20 | ||||
| Education | Primary school or below | 13.1 | 0 | 2.2 | 75.062 | 4 | ≤ 0.001 |
| Secondary school/college | 63.9 | 17.6 | 4.4 | ||||
| Degree or above | 23 | 82.4 | 93.3 | ||||
| Income | $5000 or below | 26.2 | 39.2 | 17.8 | 70.482 | 10 | ≤ 0.001 |
| $5001–$10,000 | 16.4 | 8.2 | 11.1 | ||||
| $10,001–$20,000 | 39.3 | 6.8 | 0 | ||||
| $20,001–$30,000 | 18 | 21.6 | 17.8 | ||||
| $30,001–$50,000 | 0 | 20.3 | 42.2 | ||||
| Above $50,000 | 0 | 4.1 | 11.1 | ||||
| Travel purpose | Leisure travel | 100 | 78.4 | 44.4 | 45.535 | 2 | ≤ 0.001 |
| Business travel | 0 | 21.6 | 55.6 | ||||
| Checked baggage | Yes | 100 | 79.7 | 53.3 | 35.253 | 2 | ≤ 0.001 |
| No | 0 | 20.3 | 46.7 | ||||
The result indicates that all the variables have p < 0.05 except for ‘Gender.’ The results suggest that passenger characteristics such as ‘age,’ ‘education,’ income,’ ‘travel purpose,’ and possession of checked baggage have a strong impact on passenger clusters. It also shows that there is no statistically significant relationship between gender and the identified preference clusters.
5. Discussion
Understanding passengers’ preferences for digitization is a key for transportation to make optimal investment decisions. Transportations can improve their passenger experiences by investing in digital solutions at key stages of the departure process. In this study, we employed a two-step clustering method to group passengers based on their preferences for the digitization of key services. We conducted a case study at the GBA to illustrate the methodology. A survey involving 180 passengers was conducted to identify to determine the cluster of passenger preferences. The relative importance of each predictor (variable) was computed to determine four variables that are significant for cluster formation.
When comparing the identified segments to global adoption levels, there is strong alignment for automated services such as self-service check-in and bag drop which have seen high uptake by airlines worldwide [28]. When comparing the identified segments to global adoption levels, there is strong alignment for automated services such as self-service check-in and bag drop which have seen high uptake by airlines worldwide [28]. However, preferences for biometric ID and mobile payments lag behind global transportation industry, suggesting potential areas for service improvement.
Transportation services can be tailored to passenger preferences based on the clusters obtained, namely, manual, automated, and digitalized. The manual cluster consists of a higher proportion of passengers aged 55 or above who are mainly traveling for leisure purposes. These passengers prefer to use paper-based ticketing and assistance from staff. When they need to make a purchase, they would like to use cash. Passengers in the automated clusters prefer to use self-service kiosks for the ticket or electronic tickets for personal identification and mobile payment for purchases.
Passengers in the digital cluster also prefer to use biometric technology for authentication and mobile payments to purchase within the transportation infrastructures. Digital ticketing offered an opportunity to substitute printed ticketing. Our findings align with and extend prior empirical evidence. Rahmoun and Baeshen [24] found that digital marketing, through real-time personalization via mobile apps and social media, influences tourist destination preferences, resonating with our digitalized cluster’s preference for personalized, technology-driven services such as mobile apps and biometric authentication. However, their focus on marketing contrasts with our emphasis on operational digitization, highlighting our study’s unique contribution to service-level segmentation. Similarly, Santos et al. [14] emphasize sustainability as a success factor for tourism destinations, supporting our finding that tailored digitization strategies enhance destination competitiveness by improving passenger experiences. Unlike Santos et al.’s study, our study employs two-step clustering to segment tourist preferences in the GBA, offering a novel framework for prioritizing technological investments based on distinct passenger needs.
- i.
Provision of tailor services: The distinct preferences for the digitization of transportation services suggest that transportation companies should tailor their services to the needs of each preference cluster to improve customer satisfaction. For instance, they could allocate personnel to assist older passengers who require assistance, while also investing in self-service kiosks and digital technologies for passengers who prefer automated and digitized methods.
- ii.
Investment in digital technologies: The findings of the study help the transportation company make an informed decision regarding investments for the digitization of key services. For instance, they should invest in self-service kiosks and innovative digital technologies to cater to the needs of automated and digitized segments, respectively.
- iii.
Improved payment services: Payment applications that enable the customer to pay via a mobile device are widely used in society nowadays. Credit cards can be added to the smartphone or linked with applications such as PayMe and Alipay to automate payments. Transportation companies can capitalize on the existing technology to digitize payment systems at the transportation infrastructures to improve the satisfaction of passengers that belong to digitized clusters.
- iv.
The generalizability of our findings extends beyond the GBA to other transportation hubs with diverse passenger demographics and similar technological infrastructure. The two-step clustering methodology can be applied to segment passenger preferences in various global contexts, particularly in urban tourism destinations undergoing digital transformation. The novelty of this study lies in extending work on airport passenger segmentation to a non-European context (GBA) and focusing specifically on tourist preferences for digitization, an underexplored area in smart tourism research. By identifying three distinct preference clusters—manual, automated, and digitalized—and linking them to demographic and trip-related factors, this study provides a framework for transportation providers to prioritize investments and tailor services, enhancing both passenger satisfaction and destination competitiveness.
6. Limitations
This study has several limitations that should be considered when interpreting the findings. First, the sample size of 180 passengers, while sufficient for two-step clustering [9], is relatively modest and may limit the generalizability of results to other regions or transportation contexts. Second, the study focuses on the GBA, which may not fully represent global tourist preferences due to regional differences in technological adoption and cultural factors. Third, the analysis is limited to departure processes, omitting arrival and connection stages, which could provide a more comprehensive view of digitization needs. Additionally, the survey may be subject to demographic biases, as certain groups (e.g., older passengers) may be overrepresented. The cross-sectional nature of the study also does not account for evolving preferences due to rapid technological advancements. To address these limitations, future research could employ regression analysis to examine the influence of specific variables, such as age, education, cultural technology acceptance, travel purpose, and frequency, on digitization preferences, measured through validated scales (e.g., technology acceptance model). Testing digitization prototypes—such as mobile apps for real-time journey planning, automated ticketing kiosks, and biometric authentication systems—through controlled pilot studies in transportation hubs could further validate their impact on passenger experiences. Large-scale, multiregional samples and longitudinal designs are recommended to enhance generalizability and capture evolving preferences.
7. Conclusion
This study demonstrates the significance of passenger segmentation for guiding transportation service digitization. A two-step cluster analysis of departing passengers in the GBA identified three distinct preference segments—manual, automated, and digitalized—offering actionable insights for tailoring services to enhance passenger satisfaction and destination competitiveness. This study confirms the hypothesis that passenger preferences for digital technologies in transportation services can be segmented into distinct clusters influenced by demographic and trip-related factors, as evidenced by the identification of manual, automated, and digitalized clusters. The manual cluster prefers human assistance, the automated cluster favors self-service options, and the digitalized cluster embraces cutting-edge technologies and personalization. These findings provide a framework for transportation providers and policymakers to prioritize technological investments that align with diverse passenger needs, ultimately strengthening the competitiveness of tourism destinations.
Ethics Statement
Ethical approval was obtained by the PolyU Institutional Review Board.
Consent
Informed consent was obtained from all individual participants included in the study.
Conflicts of Interest
The authors declare no conflicts of interest.
Funding
No funding was received for this manuscript.
Open Research
Data Availability Statement
The data are available from the corresponding author on request.


