Simulation Research on Highway Driving Stability Early Warning System Under Crosswind Conditions
Abstract
Aiming to address the issue of highway traffic safety under crosswind conditions, this study utilizes the CarSim/TruckSim simulation platform to systematically analyze the effects of crosswind speed and direction on the driving stability of cars and trucks. A safety speed model is developed for different road adhesion coefficients, and a highway crosswind warning system is designed. Through 625 simulation experiments, the study reveals that lateral offset, lateral acceleration, and lateral load transfer rate are significantly influenced by vehicle speed, wind speed, wind direction, and road adhesion coefficient, with the road adhesion coefficient identified as the key factor. Separate safety speed models for cars and trucks under various road and crosswind conditions are established. The findings are as follows: for cars, crosswind speed and direction impact safe driving speed only when the road adhesion coefficient is 0.1. Overall, for constant wind direction, safe driving speed decreases as wind speed increases; at a constant wind speed, safe driving speed gradually decreases as wind direction shifts from 45° to 135°. For trucks, when the road adhesion coefficient ranges from 0.1 to 0.9, the relationship between safe driving speed, wind speed, and wind direction mirrors that of small cars. However, the critical safety speed for trucks is 40% lower than that for cars under identical crosswind conditions when the road adhesion coefficient is 0.1. Based on the Visual FoxPro platform, which enables real-time early warning decision-making through the integration of the safety speed model, the highway driving stability early warning system (comprising information collection, processing, and release modules) is applied to the Zhengzhou Taohuayu Yellow River Highway Bridge case. The system is verified to significantly enhance highway driving safety and provides technical support for dynamic safety management and control of highways under crosswind conditions.
1. Introduction
With the rapid development of the transportation industry and the increasingly extensive highway network, highways have become crucial links connecting major cities and facilitating economic exchanges. However, highway driving safety remains a key issue in transportation. This is particularly true under complex meteorological conditions such as crosswinds, which significantly affect vehicle driving stability [1, 2]. Crosswind is a common natural phenomenon that occurs more frequently and intensely, especially on highways in specific sections, such as bridges, open areas, mountain valleys, and coastal regions [3, 4]. These conditions may not only compromise the mobility of vehicles but also lead to serious traffic accidents, posing a major threat to people’s lives and property.
The research on the driving stability of vehicles on a highway under crosswind conditions is mainly divided into three methods: road test method [5], wind tunnel test method [6], and dynamic simulation method [7]. The road test method is carried out under real crosswind conditions, and the results obtained are close to the actual situation. However, it requires significant manpower, material resources, and time, making it unsuitable for wide application in solving various practical engineering problems [8]. The wind tunnel test method uses advancing airflow to simulate the relative motion between the vehicle and the frontal airflow. He and Zou conducted wind tunnel tests to analyze the aerodynamic problems of train-bridge systems under crosswind conditions [9]. Dorigatti et al. [10] carried out wind tunnel tests with vans, buses, and trucks as the research objects, using the average peak lateral force coefficient, lift coefficient, and rolling force coefficient as the evaluation indices. In the wind tunnel tests, the influence of uniform crosswinds in different directions on the driving stability of long-span bridges is studied by simulating the vehicle driving on the “ideal” and “typical” bridge decks under the action of uniform crosswinds in different directions. However, wind tunnel tests are usually conducted on a fixed model or an actual vehicle on a bench, which is unsuitable for studying the driving stability of a moving vehicle under varying crosswind conditions. With the development of computer simulation technology, the use of dynamic simulation software for research in this area has been increasing. To study the wind load effects on suspension bridges, Tadeu et al. [11] employed computational fluid dynamics (CFD) to model wind attack angles ranging from −8 to +8° and simulated different bridge structures to analyze the influence of guard plates and suspension cables on the wind load generated. In dynamic simulation software, wind speed and direction can be accurately controlled, addressing the drawbacks of actual vehicle experiments that are affected by weather conditions. This also reduces experimental costs and improves the safety of experimenters. There are two types of dynamic simulation software: one for structured modeling, such as ADAMS, and another for parametric modeling, such as CarSim/TruckSim [12]. Compared to CarSim/TruckSim, ADAMS requires more computing resources, has a higher model complexity, and exhibits slower simulation speeds. On the other hand, CarSim/TruckSim has the advantages of the more intuitive interface, faster simulation speed, and lower computing resource requirements. Therefore, this paper uses CarSim/TruckSim to study the driving stability of cars and trucks on highways under crosswind conditions [13].
In the study of vehicle speed limits in complex environments, such as rain or snow conditions, most researchers employ MATLAB software in conjunction with multiple regression techniques to develop models for safe driving and to offer recommendations for appropriate speed limits [14]. Based on simulation experimental data, this paper develops a safety speed model for vehicle operation under crosswind conditions [15]. In studies of vehicle-safe driving models under crosswind conditions, researchers mainly focus on analyzing the influence of various factors on driving safety. Wang et al. [16] utilized CarSim to simulate the effect of vehicle speed and the radius of circular road curves on vehicle driving stability, focusing on the Xihan Expressway as their case study. Their results offer foundational insights for the design and operation of mountainous expressways. Tian et al. have developed a comprehensive system framework for the evaluation of lateral stability in vehicles. This framework incorporates both single-factor and multi-factor testing methodologies, which are based on stability indicators derived from CarSim simulations [17]. To explore the lane-keeping behavior of intelligent vehicles utilizing visual navigation in high-speed crosswind conditions, Wang et al. [18] analyzed the characteristics of crosswinds at the junctions of bridges and tunnels and their impact on vehicular driving capabilities. They employed CarSim to develop models that incorporate variables such as crosswind, road topography, and vehicle dynamics. Consequently, this study also leverages CarSim/TruckSim to construct various models based on vehicle dynamics.
Complex meteorological conditions may present significant threats to road safety. Consequently, several researchers have proposed and developed corresponding early warning systems aimed at effectively mitigating the incidence of road traffic accidents. For instance, a snow-triggered avalanche warning system can enhance road management and decrease the risk of avalanches. Hao et al. [19] formulated a snow-triggered avalanche warning model. To bolster driving safety during foggy weather, Li et al. [20] proposed a fog warning system based on connected vehicle (CV) technology. Landslides caused by rainfall constitute a substantial annual risk to human life and property. In response, Chen et al. [21] advanced a meteorological geotechnical engineering early warning system known as GRAPES-LFM. However, the existing research has inadequately addressed the development of a highway driving stability early warning system specifically tailored for crosswind conditions. Therefore, the objective of this paper is to design such a system grounded in a safety speed model for highway driving under crosswind conditions.
In light of the prevailing operational characteristics of highways, this study aims to integrate a multi-physical field coupling mechanism involving fluid mechanics and vehicle dynamics. A comprehensive coupling simulation model will be developed utilizing the CarSim/TruckSim joint simulation platform, which will encompass various multidimensional parameters, including wind speed (ranging from 5 to 25 m/s), wind direction (spanning 0°–180°), the road adhesion coefficient (ranging from 0.1 to 0.9), and driving speed (between 60 and 140 km/h). This study will systematically analyze the time-varying characteristics of vehicle stability parameters, namely lateral offset, lateral acceleration, and lateral load transfer rate, under crosswind conditions.
Employing the CarSim/TruckSim vehicle dynamics simulation software, detailed models will be established for the vehicle, road, crosswind, and driver. A total of 625 simulation experiments will be conducted on both passenger cars and large trucks, resulting in the collection of data related to lateral offset, lateral acceleration, and lateral load transfer rate. An analytical approach will be applied to the simulation data to construct a safe speed model for both cars and trucks in a crosswind environment, specifically under two distinct cases of road friction coefficients: 0.1 and between 0.3 and 0.9.
- 1.
Firstly, the evaluation indices for vehicle driving stability will be selected and determined to analyze the stability of both cars and trucks using the CarSim/TruckSim platform. Subsequently, the factors influencing driving stability will be examined, leading to the establishment of simulation parameters. After constructing the models for the vehicle, crosswind, driver, and road aspects, highway driving stability simulations for both vehicles will be conducted under crosswind conditions, adhering to the established simulation protocols.
- 2.
The vehicle model, road model, crosswind model, and driver model will be innovatively constructed, and 625 sets of simulation experiments will be executed utilizing CarSim/TruckSim software. An extensive analysis will be performed on the influence of multiple factors, culminating in the development of a vehicle safety speed model pertinent to different road friction coefficients, thus providing a quantitative basis for enhancing driving safety in a crosswind environment.
- 3.
Utilizing Visual FoxPro 9.0 software, a highway driving stability early warning system predicated on the safe speed model design will be established. Through the collaborative integration of various modules, including information collection, processing, and dissemination, real-time monitoring of vehicle driving safety will be achieved alongside an effective early warning mechanism. The safety speed model will facilitate the calculation of safe speed values for diverse road, vehicle, and crosswind conditions. Grounded in these computations, safety directives for drivers as well as contingency plan recommendations will be proposed for the traffic police, road administration bodies, road maintenance departments, toll stations, and service areas.
- 4.
Using the Zhengzhou Taohuayu Yellow River Highway Bridge as a case study, this research will pioneeringly implement the expressway early warning system based on crosswind environmental conditions into a real-world bridge scenario. A comprehensive consideration of various influencing factors will enable real-time monitoring and dynamic early warning of driving safety, offering personalized early warning schemes specifically for trucks. Through an intuitive interface alongside targeted measures designed to bolster the early warning effectiveness, and in conjunction with data processing and decision-making support, this study aspires to furnish extensive technical support and management recommendations aimed at elevating the standards of driving safety in highway environments.
The remainder of this article is organized as follows: the second section covers the materials and methods, the third section presents the simulation results, the fourth section provides an example application, and the final section concludes the article.
2. Materials and Methods
2.1. Factors Affecting Vehicle Driving Stability Under Crosswind Conditions
- 1.
Vehicle Speed: Vehicle speed plays a crucial role in influencing driving stability. As the driving speed increases, the vehicle’s inertia rises, which in turn heightens lateral acceleration during turns or lane changes. This increased inertia raises the risk of rollover and may even result in the loss of vehicle control. Maintaining stability is especially critical at high speeds, particularly when responding to emergencies or when it is necessary to avoid obstacles or apply brakes.
- 2.
Wind Speed: The higher the wind speed, the greater the lateral force exerted on the vehicle, significantly affecting its driving stability. In severe wind conditions, the vehicle may sway or even deviate from its intended path.
- 3.
Wind Direction: Changes in wind direction can influence driving stability, as it alters the lateral force distribution on the vehicle. Sudden, strong crosswinds may cause the vehicle to momentarily stray from its intended path.
- 4.
Road Adhesion Coefficient: The road adhesion coefficient measures how effectively a road prevents skidding, reflecting the grip between the vehicle’s tires and the road surface. This coefficient is a key factor in road traffic safety analysis. A low road adhesion coefficient increases the risk of losing control, especially when turning, braking, or adjusting speed.
2.2. Vehicle Driving Stability Evaluation Index
Three evaluation indices, including lateral offset, lateral acceleration, and lateral load transfer rate, are used for assessing highway vehicle driving stability under Crosswind Conditions [22].
2.2.1. Lateral Offset
The greater the lateral offset, the more unstable the vehicle becomes under the influence of crosswinds. Lateral movement of the vehicle can be quantified as trajectory error, which refers to the lateral distance by which the vehicle deviates from the centerline of the road lane. Guo Konghui [23] proposed that the threshold for tracking error is 0.3 m.
2.2.2. Lateral Acceleration
Lateral acceleration [22] is a key indicator of vehicle stability. National standards specify that, under normal conditions, lateral acceleration should not exceed 0.4 g for standard cars (where g represents the acceleration due to gravity) and 0.3 g for trucks.
2.2.3. Lateral Transfer Ratio (LTR)
As a vehicle moves, the vertical force between its tires and the road surface varies with changes in the vehicle’s tilt angle. When the tilt angle reaches a critical value, the force on a wheel may reduce to zero, causing the tire to lose contact with the road surface, potentially leading to vehicle rollover. The LTR is a key indicator for evaluating the risk of rollover instability.
The LTR value ranges from 0 to 1. Under normal driving conditions, a lower LTR value (closer to 0) indicates greater vehicle stability with a small tilt angle. Conversely, an LTR approaching 1 signifies a critical rollover risk. At an LTR of 0.6, the vehicle begins to show an initial tendency to roll over, and the corresponding speed is considered the early warning threshold for potential rollover. When the LTR reaches 0.8, the rollover risk is significantly increased, and the corresponding speed is classified as the dangerous threshold for rollover. At an LTR of 1.0, the vertical load shifts from the inner wheel to the outer wheel, and the corresponding speed is considered the vehicle’s rollover speed. For this study, an LTR of 0.6 is used as the safety threshold for evaluating vehicle driving stability.
2.3. Simulation Scheme
To develop a comprehensive vehicle driving model under crosswind conditions and analyze the impact of various crosswind conditions, vehicle types, and road conditions on driving safety and stability, this study focuses on four key factors: vehicle speed, wind speed, wind direction, and road adhesion coefficient. The operating speed range for vehicles is established as 60–140 km/h, coinciding with the statutory speed limits applicable on expressways. According to the “Road Traffic Safety Law” in China, a maximum speed limit of 120 km/h and a minimum limit of 60 km/h are mandated. In contrast, member countries of the European Union typically permit maximum speeds of 130 km/h, with certain sections in Germany having no speed limit. In the United States, typical interstate highway speed limits range from 65 to 80 mph (equivalent to 105–129 km/h). Analysis of traffic datasets, such as NGSIM [25], reveals that the median actual driving speed on expressways falls between 85 and 110 km/h, with extreme conditions such as during overtaking or on downhill gradients often approaching 120 km/h. This selected speed range not only adequately encompasses customary driving conditions but also facilitates testing of the system’s response reliability under limit-speed scenarios.
The wind speed is designated within a range of 5–25 m/s. An extensive analysis of a decade’s worth of data from expressway meteorological stations maintained by the China Meteorological Administration indicates that the cumulative frequency of crosswinds exceeding 5 m/s is 23.7%. In the case of bridge/open road conditions, this frequency can reach 35%. Specifically, crosswinds of 5–15 m/s (Beaufort scale 3–7) account for 87% of occurrences, correlating with typical daily gale warnings, while winds ranging from 15 to 25 m/s (Beaufort scale 7–10) represent 13%, which aligns with severe weather events such as typhoons or extreme convective phenomena.
The study particularly emphasizes high-risk segments within China’s coastal highway network, such as the Hangzhou Bay Bridge, as well as areas susceptible to northwest winds, like the Xinjiang segment of the Lianhuo Expressway. Notably, the recorded maximum wind speeds annually can escalate to between 28 and 32 m/s. By establishing an upper limit of 25 m/s, the selected parameters can effectively encompass 99% of the observed extreme values while also providing a margin of safety redundancy. Table 1 summarizes the details of each simulation scheme. The combined scenarios for cars and trucks consist of 625 groups, which will be used to run simulations based on the established models.
| Vehicle speed (km/h) | Wind speed (m/s) | Wind direction (°) | Road adhesion coefficient | Total scheme number (group) |
|---|---|---|---|---|
| 60 | 5, 10, 15, 20, 25 | 0, 45, 90, 135, 180 | 0.1, 0.3, 0.5, 0.7, 0.9 | 125 |
| 80 | 5, 10, 15, 20, 25 | 0, 45, 90, 135, 180 | 0.1, 0.3, 0.5, 0.7, 0.9 | 125 |
| 100 | 5, 10, 15, 20, 25 | 0, 45, 90, 135, 180 | 0.1, 0.3, 0.5, 0.7, 0.9 | 125 |
| 120 | 5, 10, 15, 20, 25 | 0, 45, 90, 135, 180 | 0.1, 0.3, 0.5, 0.7, 0.9 | 125 |
| 140 | 5, 10, 15, 20, 25 | 0, 45, 90, 135, 180 | 0.1, 0.3, 0.5, 0.7, 0.9 | 125 |
2.4. Simulation Modeling
This study employed CarSim/TruckSim to create and simulate models of cars and trucks under crosswind conditions. The research analyzed vehicle driving stability and determined safety speeds under these conditions.
2.4.1. Vehicle Model
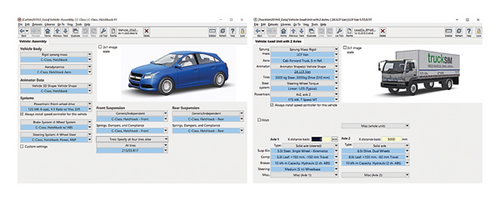
In this simulation experiment, the C-class and LCF VAN, built in CarSim/TruckSim, were used to establish the vehicle models for cars and trucks. The vehicle models selected in this study have universal significance and are suitable for most vehicles of the same type. The vehicle model parameters were used with the default parameters of the software, as shown in Figure 1.
2.4.2. Road Model
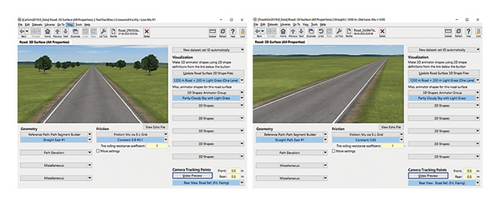
The construction of the road scene model in this study primarily considered two factors: road geometric characteristics and the road adhesion coefficient. The experimental road section was a straight road with a single lane, a lane width of 3.75 m, and an asphalt concrete pavement. The road surface friction coefficients are 0.1, 0.3, 0.5, 0.7, and 0.9. The road modelling interface is shown in Figure 2.
2.4.3. Crosswind Model
- •
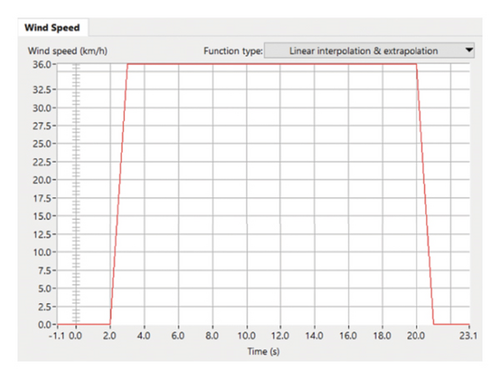
During the first 2 s of vehicle operation, the crosswind remains at zero to establish baseline driving conditions.
- •
From the third second onward, the wind speed progressively increases, reaching its peak value in one second to simulate a sudden wind disturbance.
- •
The maximum wind speed is then maintained for 17 s (from the third to the 20th second) to systematically evaluate the vehicle’s dynamic response under sustained crosswind exposure.
- •
After the 20th second, the wind speed gradually decreases until the crosswind fully subsides by the 21st second.
The lateral dynamics model corresponding to this simulation is illustrated in Figure 3.
The previous research model only selected 0°–90° wind direction angle, which could not fully analyze the effect of wind direction angle. Combined with the complexity and uncertainty of crosswind, the wind direction angle of 0°–180° is selected as the input parameter, and the boundary step is 45°, which is divided into five levels of 0°, 45°, 90°, 135° and 180°. The modeling interface of crosswind model is shown in Figure 4.

2.4.4. Driver Model
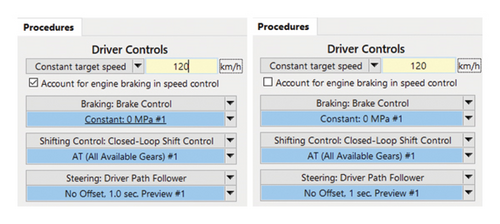
This study employs a closed-loop control strategy to develop a driver control model. The speed control model operates in a closed-loop mode, ensuring a constant target speed is maintained. Set the vehicle travelling speed settings to: 60 km/h, 80 km/h, 100 km/h, 120 km/h, 140 km/h. Similarly, the steering control model uses a closed-loop strategy, where steering is managed by the driver model to keep the vehicle centered in the lane during straight driving. The shifting control model also works in a closed-loop manner, enabling selection from “All Available Gears” for control. Additionally, the braking control model is configured to maintain a constant pressure of 0 MPa under the “Braking MC Pressure” setting. The driver model in Carsim/Trucksim was built up as shown in Figure 5.
3. Simulation Results
3.1. Driving Stability Analysis
Firstly, the driving stability is analyzed.
3.1.1. Lateral Offset
CarSim/TruckSim was used to simulate the driving behavior of vehicles under the influence of various factors, including vehicle speed, wind speed, wind direction, and road adhesion coefficient. The relationships between the lateral offset of cars and trucks and these factors are shown in Figures 6 and 7. Figures 6(a), 6(b), 6(c), 6(d), 6(e), 7(a), 7(b), 7(c), 7(d), 7(e) illustrate the relationship between each factor and the lateral offset of cars and trucks at wind speeds of 5 m/s, 10 m/s, 15 m/s, 20 m/s, and 25 m/s, respectively.
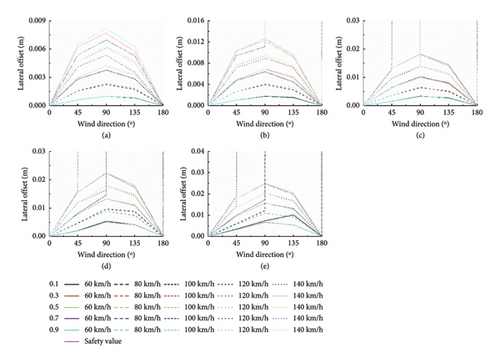
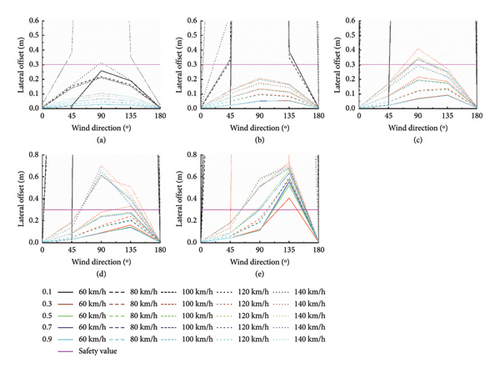
From Figures 6 and 7, it is observed that when the road adhesion coefficient ranges from 0.1 to 0.9, the maximum lateral offset of the truck exceeds 0.3 m. However, the car only experiences a maximum lateral offset exceeding 0.3 m when the road adhesion coefficient is 0.1. The lateral offset increases with the wind direction angle, peaking at 90° and 135°. Additionally, increasing wind and vehicle speeds result in a greater lateral offset. A higher road adhesion coefficient is associated with a reduced lateral offset. Notably, the lateral offset at a road adhesion coefficient of 0.1 significantly differs from that at coefficients ranging from 0.3 to 0.9, while the offsets at road adhesion coefficients of 0.3, 0.5, 0.7, and 0.9 show a gradually decreasing variation.
3.1.2. Lateral Acceleration
Figures 8 and 9 illustrate the relationship between lateral acceleration in cars and trucks and factors such as vehicle speed, wind speed, wind direction, and the road adhesion coefficient.
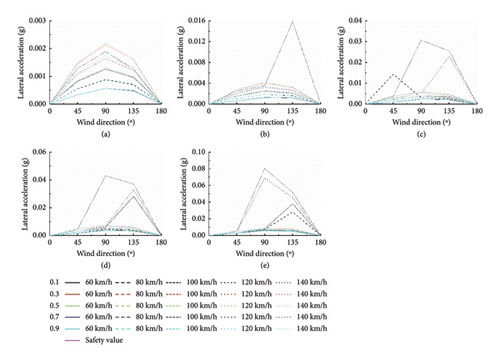
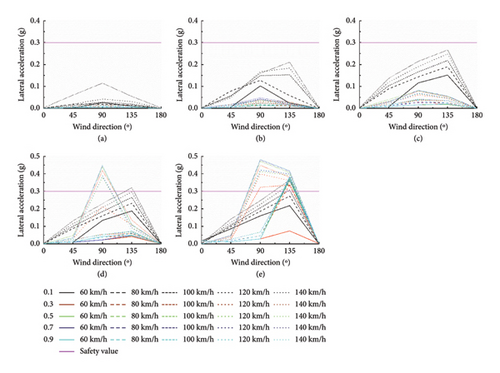
Figures 8 and 9 show that trucks experience greater lateral acceleration than cars when affected by crosswinds. Under all tested conditions, cars maintain lateral acceleration below the safe threshold of 0.4 g, indicating safe operation for both vehicle types. As the wind direction shifts, lateral acceleration first increases and then decreases. Specifically, at wind direction angles of 0° and 180°, lateral acceleration approaches zero, with peak values occurring at wind direction angles of 90° and 135°. Both wind speed and vehicle speed are positively correlated with lateral acceleration. In contrast, an increase in the road adhesion coefficient results in a decrease in lateral acceleration, highlighting an inverse relationship: a higher road adhesion coefficient reduces the likelihood of vehicle skidding and consequently lowers lateral acceleration.
3.1.3. Lateral Load Transfer Rate
Figures 10 and 11 show the relationships between lateral load transfer rates for cars and trucks and factors such as vehicle speed, wind speed, wind direction, and road friction.
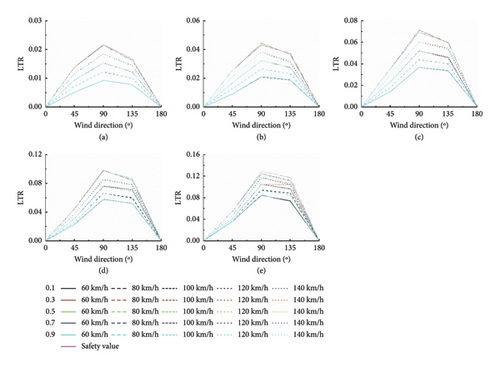
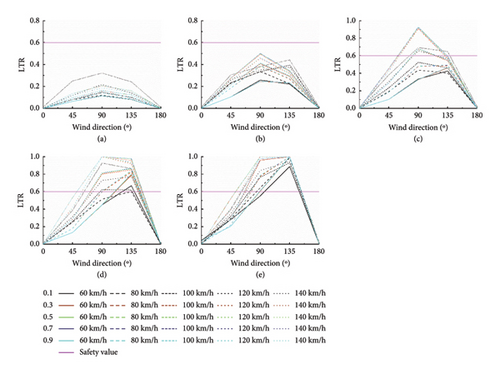
Figures 10 and 11 illustrate that trucks experience a larger lateral load transfer rate due to crosswinds than cars. In all crosswind conditions, the lateral load transfer rate remains within a safe limit of 0.6 for both vehicle types, indicating a stable state. The lateral load transfer rate first increases and then decreases as the wind direction changes. Specifically, at wind direction angles of 0° and 180°, the lateral load transfer rate approaches zero, with the peak occurring at wind direction angles of 90° and 135°. Additionally, both wind speed and vehicle speed contribute to an increase in the lateral load transfer rate. An increase in the road adhesion coefficient also elevates the lateral load transfer rate. However, within a road adhesion coefficient range of 0.3–0.9, there is no significant variation in lateral load transfer rates between cars and trucks.
3.2. Establishment of Safety Speed Model
Specific safety driving parameters have been established by analyzing simulation data from CarSim/TruckSim. The vehicle’s lateral offset should not exceed 0.3 m, and the lateral acceleration of passenger vehicles must remain below 0.4 g. For trucks, the acceptable limit for lateral offset is also set at 0.3 m. Additionally, the vehicle’s lateral load transfer rate should be constrained to a maximum of 0.6. These values are crucial for ensuring vehicle stability during operation. The maximum driving speed for each of the three driving stability evaluation indices is assessed, with the minimum of these speeds being designated as the safe speed for vehicles operating under crosswind conditions.
3.2.1. Safety Speed Model for Cars
The safe speed of cars under crosswind conditions is presented in Table 2. It should be noted that wind direction angles of 0° and 180° have minimal impact on vehicle driving stability. Therefore, data for wind direction angles of 67.5° and 112.5° are also included to provide a more comprehensive analysis of the impact of wind direction on safe driving speed.
| Serial number | Wind direction (°) | Wind speed (m/s) | Safe speed (km/h) μ = 0.1 |
|---|---|---|---|
| 1 | 45 | 5 | 147 |
| 2 | 10 | 147 | |
| 3 | 15 | 147 | |
| 4 | 20 | 147 | |
| 5 | 25 | 147 | |
| 6 | 67.5 | 5 | 147 |
| 7 | 10 | 147 | |
| 8 | 15 | 147 | |
| 9 | 20 | 147 | |
| 10 | 25 | 147 | |
| 11 | 90 | 5 | 147 |
| 12 | 10 | 146 | |
| 13 | 15 | 137 | |
| 14 | 20 | 126 | |
| 15 | 25 | 116 | |
| 16 | 112.5 | 5 | 146 |
| 17 | 10 | 133 | |
| 18 | 15 | 117 | |
| 19 | 20 | 102 | |
| 20 | 25 | 85 | |
| 21 | 135 | 5 | 141 |
| 22 | 10 | 124 | |
| 23 | 15 | 105 | |
| 24 | 20 | 86 | |
| 25 | 25 | 66 | |
Table 3 is the model coefficients in equation (2) fitted by the Marquardt method + general global optimization method.
| Model coefficient | Fitting result |
|---|---|
| p1 | 150.16 |
| p2 | −1.23E − 05 |
| p3 | 1.95 |
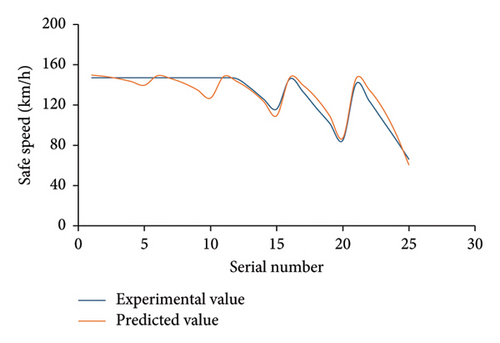
The vehicle safety speed model is verified by 25 sets of data. R2 is used as the index of prediction accuracy. It is verified that the R2 of the model prediction is 0.91, which indicates that the prediction accuracy is high, and the safety speed model works well. The comparison between the experimental values and the predicted values is shown in Figure 12.
3.2.2. Safety Speed Model for Trucks
The safe speed of trucks under crosswind conditions is shown in Table 4.
| Serial number | Wind direction (°) | Wind speed (m/s) | Safe speed (km/h) | ||||
|---|---|---|---|---|---|---|---|
| μ = 0.1 | μ = 0.3 | μ = 0.5 | μ = 0.7 | μ = 0.9 | |||
| 1 | 45 | 5 | 133 | 317 | 317 | 317 | 317 |
| 2 | 10 | 78 | 273 | 279 | 280 | 280 | |
| 3 | 15 | 60 | 204 | 207 | 208 | 208 | |
| 4 | 20 | 58 | 158 | 158 | 158 | 158 | |
| 5 | 25 | 0 | 148 | 148 | 148 | 148 | |
| 6 | 67.5 | 5 | 121 | 330 | 330 | 330 | 330 |
| 7 | 10 | 57 | 207 | 207 | 207 | 207 | |
| 8 | 15 | 25 | 115 | 115 | 115 | 115 | |
| 9 | 20 | 0 | 111 | 111 | 111 | 111 | |
| 10 | 25 | 0 | 102 | 102 | 102 | 102 | |
| 11 | 90 | 5 | 117 | 328 | 328 | 328 | 328 |
| 12 | 10 | 38 | 184 | 185 | 184 | 183 | |
| 13 | 15 | 4 | 92 | 92 | 92- | 92 | |
| 14 | 20 | 0 | 80 | 80 | 80 | 80 | |
| 15 | 25 | 0 | 59 | 58 | 58 | 58 | |
| 16 | 112.5 | 5 | 127 | 332 | 332 | 332 | 332 |
| 17 | 10 | 25 | 190 | 190 | 190 | 190 | |
| 18 | 15 | 3 | 75 | 75 | 75 | 75 | |
| 19 | 20 | 0 | 57 | 57 | 57 | 57 | |
| 20 | 25 | 0 | 23 | 23 | 23 | 23 | |
| 21 | 135 | 5 | 135 | 332 | 332 | 332 | 332 |
| 22 | 10 | 19 | 231 | 235 | 237 | 237 | |
| 23 | 15 | 3 | 151 | 152 | 147 | 145 | |
| 24 | 20 | 0 | 44 | 44 | 44 | 44 | |
| 25 | 25 | 0 | 21 | 21 | 21 | 21 | |
Table 5 is the model coefficients in the equation (4) with the road adhesion coefficient of 0.1 obtained by using the Marquardt method + general global optimization method.
| Model coefficient | Fitting result |
|---|---|
| p1 | −47.41 |
| p2 | 82,439.6 |
| p3 | 783.18 |
Table 6 is the model coefficients in the equation (4) with the road adhesion coefficient of 0.3–0.9 obtained by using the Marquardt method + general global optimization method.
| Model coefficient | Fitting result |
|---|---|
| p1 | −14.55 |
| p2 | 179,235.3 |
| p3 | 1605.87 |
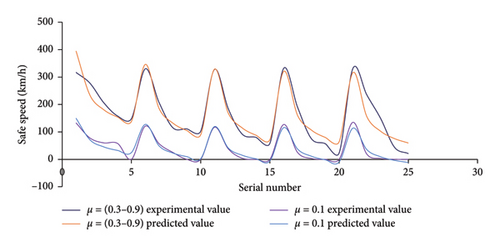
Similarly, a total of 25 data sets for each truck, with road adhesion coefficients ranging from 0.3 to 0.9, as well as an additional coefficient of 0.1, were analyzed to assess the accuracy of the truck safety speed model, as shown in Figure 13. The coefficient of determination (R2) was used as the metric for predictive accuracy. Equations (5) and (6) demonstrate high prediction accuracies, achieving R2 values of 0.94 and 0.90, respectively.
3.3. Parameter Sensitivity Analysis
In the safe speed model, the three parameters of wind direction, wind speed, and road friction coefficient, have different effects on the safe speed. Therefore, a sensitivity analysis of the parameters in the safe speed model is carried out using an orthogonal test and variance analysis. The orthogonal test factors and levels are shown in Table 7. L25 (36) was selected as the orthogonal table, and SPSS software was used to analyze the variance of the generated orthogonal test design scheme. The test results of the inter-subject effect are shown in Table 8.
| Level | Factor | ||
|---|---|---|---|
| Factor A (wind direction) (°) | Factor B (wind speed) (m/s) | Factor C (road adhesion coefficient) | |
| 1 | 45 | 5 | 0.1 |
| 2 | 67.5 | 10 | 0.3 |
| 3 | 90 | 15 | 0.5 |
| 4 | 112.5 | 20 | 0.7 |
| 5 | 135 | 25 | 0.9 |
| Quadratic sum | df | Mean square | F | p | |
|---|---|---|---|---|---|
| A (wind direction) | 10,611.04 | 4 | 2652.76 | 1.255 | 0.340 |
| B (wind speed) | 171,899.84 | 4 | 42,974.96 | 20.324 | 0.0001 |
| C (road adhesion coefficient) | 79,781.04 | 4 | 19,945.26 | 9.433 | 0.001 |
The greater the F value, the higher the influence of related factors on the test. According to Table 8, the influence of wind speed on safe speed is significant at the 0.001 level (F = 20.324, p = 0.0001 < 0.001), making it the main factor. The influence of the road friction coefficient on safety speed is significant at the 0.01 level (F = 9.433, p = 0.001 < 0.01), which is a secondary factor. The influence of wind direction on safety speed is not significant; therefore, the ranking of the three factors affecting safety speed is as follows: wind speed > road friction coefficient > wind direction.
3.4. Highway Driving Stability Early Warning System Under Crosswind Conditions
The highway driving stability early warning system under crosswind conditions was designed based on the safety speed models of cars and trucks. This system aims to enhance driving safety in real-time and reduce the number of traffic accidents caused by crosswinds.
3.4.1. Overall Composition of the Highway Driving Stability Early Warning System
- 1.
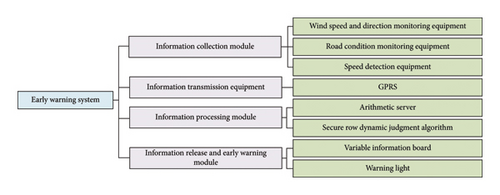
The information collection module is responsible for gathering data on road conditions, vehicle status, and crosswind conditions. Monitoring equipment installed along the highway collects and processes traffic data, such as vehicle type and driving speed. These collected data are then transmitted to the information processing module. Additionally, the information collection module also handles the collection of meteorological data and road pavement condition data, as shown in Figure 14.
- 2.
The information transmission module is responsible for transferring data from the information collection module to the processing module, and subsequently sending the processed data from the processing module to the data release and early warning system.
- 3.
The information processing module is the core component of the system and is responsible for managing the system’s operations. The structure of this module is shown in Figure 15.
- 4.
The information release and early warning module transmits early warning data through multiple channels to enhance driver safety. Additionally, it notifies road administration officials, traffic police, and other relevant personnel to take necessary on-site actions. The structure of this module is shown in Figure 16.


3.4.2. Hardware Platform of Highway Driving Stability Early Warning System
The highway driving stability early warning system under crosswind conditions utilizes intelligent road condition monitoring sensors in combination with Internet of Things (IoT) technology to enable real-time monitoring of road conditions. The system analyzes the collected data to generate on-site warnings and remote alerts, thereby improving highway driving safety. The hardware schematic diagram of the highway driving stability early warning system under crosswind conditions is presented in Figure 17.
3.4.2.1. Wind Speed and Direction Monitoring Equipment
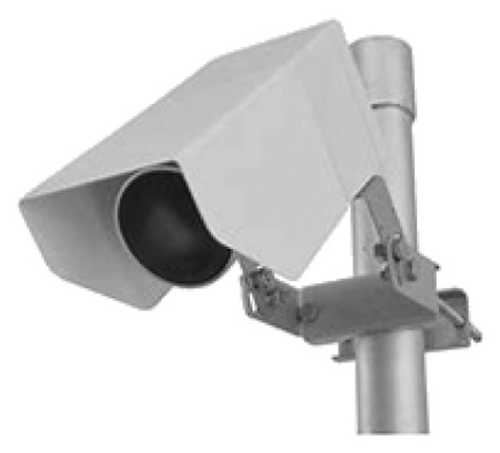
The wind speed and direction monitoring equipment is used to accurately measure and record real-time wind speed and direction. Given the need for automated data collection, wind speed detectors must exhibit high stability, reliability, sensitivity, and precision. An ultrasonic wind speed and direction detector is employed here, where the sensor measures wind speed by analyzing the speed of ultrasonic signal propagation. The wind speed is calculated by transmitting and receiving these ultrasonic signals.
3.4.2.2. Road Condition Monitoring Equipment
- 1.
The sensor features a housing that is resistant to weather damage and can easily adapt to outdoor environments.
- 2.
The sensor utilizes infrared remote sensing for non-contact monitoring, ensuring no damage to the road surface.
- 3.
The sensor can simultaneously measure several parameters, including road adhesion coefficient, water thickness, ice thickness, and snow thickness.
Additionally, the sensor is a nonembedded installation type, meaning it does not require cutting into the road surface, thus preventing traffic disruptions during installation.
3.4.2.3. Vehicle Type and Speed Detection Equipment
The vehicle type and speed detection equipment employ radar, cameras, and other auxiliary or display devices to construct seven modules, as outlined in Table 9. This system is designed to operate effectively in various environmental conditions, remaining unaffected by changes in weather or lighting. It offers stable performance and allows for continuous real-time monitoring, making it highly effective for detecting vehicle type and speed.
| Module name | Feature |
|---|---|
| Capture camera + radar | High-definition camera, millimeter wave speed radar, real-time speed measurement, and accurate capture |
| Fill light | High-speed shutter fills for camera. Capture high-definition license plate images even at night |
| Reflective speed limit sign | Displays the posted speed limit for the road section |
| Sheet metal chassis | Box enclosure |
| Reminder signs | The display below the tip shows the speed of the vehicle |
| License plate display | Displays license plate information |
| Speed display | Displays real-time vehicle speed information. Within the speed limit, the vehicle speed is displayed in green, and above the speed limit value, the vehicle speed is displayed in red |
3.4.2.4. Information Transmission Equipment
General Packet Radio Service (GPRS) is particularly beneficial due to its widespread availability, high data transmission efficiency, and strong scalability. By utilizing a GPRS private network, a robust security system for the highway driving stability early warning system can be established. This private network serves as the “nervous system” of the overall system, enabling the rapid and precise acquisition of data and the transmission of early warning information.
3.4.2.5. Information Processing Center Equipment
- 1.
The code is written to import data collected on vehicle type and speed, wind speed and direction, road adhesion coefficient, and other relevant parameters.
- 2.
Based on the safety speed model described in Chapter 3, a calculation code is developed to determine the safe speed value.
- 3.
Based on the calculated safe speed value, the warning light, driver’s instructions, and early warning information from emergency plans of various departments are triggered. The warning information is classified into three schemes:
- •
Scheme 1: If the safe speed value of a car is ≥ 120 km/h, or the safe speed value of a truck is ≥ 100 km/h.
- •
Scheme 2: If the car or truck’s safe speed value is ≥ 60 km/h.
- •
Scheme 3: If the car or truck’s safe speed value is ≤ 60 km/h.
- •
- 4.
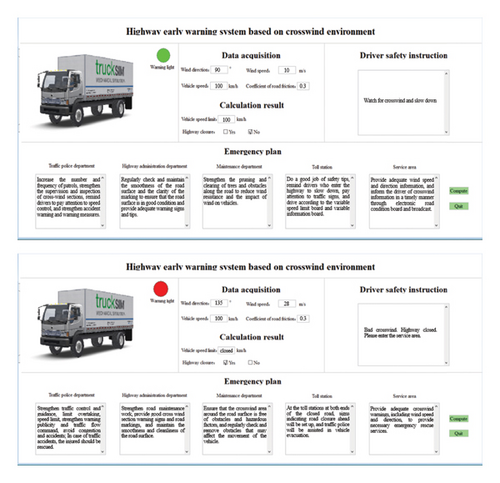
The interfaces for the highway driving stability early warning system under crosswind conditions are designed, as shown in Figure 19, with a truck used as an example.
3.4.2.6. Variable Information Board
Currently, highway driving stability early warning systems for road users largely rely on variable information boards, commonly known as signboards. These signboards use LED technology to display both text and graphics. There are two main types: variable speed limit signs and variable information displays. Together, these signboards convey important traffic restrictions and warnings specific to certain road sections. The timely and accurate dissemination of this information is crucial for ensuring highway safety, as it enables real-time communication of critical alerts to road users.
3.4.2.7. Warning Light
The warning light is an effective means of conveying information. The color change provides drivers with a clear, intuitive alert, resulting in a strong early warning effect. When used in conjunction with a variable information board, the overall effectiveness of the highway driving stability early warning system is significantly enhanced, providing a comprehensive alert system to improve road safety.
4. Example Application
4.1. Basic Information
The Zhengzhou Taohuayu Yellow River Highway Bridge is located at the junction of Zhengzhou City and Jiaozuo City. It is the fourth highway bridge across the Yellow River in Zhengzhou, with a total length of 7691.5 m. The bridge follows the standard design of a two-way, six-lane expressway, with a designed driving speed of 100 km/h [16]. Specifically, the speed limit is set at 100 km/h for cars and 80 km/h for trucks.
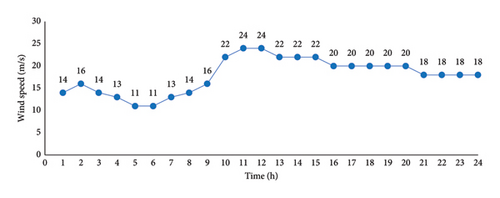
On February 19, 2024, the weather conditions at the Taohuayu Yellow River Highway Bridge in Zhengzhou were light rain, and the road surface’s adhesion coefficient was recorded at 0.3. Figure 20 displays the wind speed over a 24-h period, and Table 10 shows the wind direction.
| Time | Wind direction |
|---|---|
| 1 | Northeaster (135°) |
| 2 | Northeaster (135°) |
| 3 | Northeaster (135°) |
| 4 | East wind (90°) |
| 5 | East wind (90°) |
| 6 | Southeaster (45°) |
| 7 | Northeaster (135°) |
| 8 | Northeaster (135°) |
| 9 | Northeaster (135°) |
| 10 | East wind (90°) |
| 11 | East wind (90°) |
| 12 | East wind (90°) |
| 13 | Northeaster (135°) |
| 14 | East wind (90°) |
| 15 | East wind (90°) |
| 16 | East wind (90°) |
| 17 | East wind (90°) |
| 18 | East wind (90°) |
| 19 | East wind (90°) |
| 20 | East wind (90°) |
| 21 | East wind (90°) |
| 22 | East wind (90°) |
| 23 | East wind (90°) |
| 24 | East wind (90°) |
4.2. Safe Speed Analysis
For the road and wind conditions on February 19, 2024, the calculated safe speed for cars was found to be higher than 100 km/h when the road adhesion coefficient was 0.3, indicating that cars remained in a safe operating condition. However, trucks were considered to be in an unsafe condition under the same road adhesion coefficient. As a result, the analysis and calculation focused solely on determining the safe speed for trucks at a road adhesion coefficient of 0.3. The safety speed for vehicles on the Zhengzhou Taohuayu Yellow River Highway Bridge was calculated based on the road adhesion coefficient, wind speed, and wind direction over a 24 h period, as shown in Figure 21.
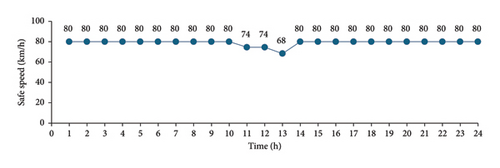
From Figure 21, it is evident that the safe driving speed for trucks on the Taohuayu Yellow River Highway Bridge in Zhengzhou, between 10:00 and 14:00 on February 19, 2024, was lower than the speed limit of 80 km/h. The primary reason for this reduced safe speed was the high wind conditions during that period.
4.3. Information Release and Early Warning
Taking the actual conditions at the Taohuayu Yellow River Highway Bridge in Zhengzhou at noon on February 19, 2024, as an example, the highway driving stability early warning system is applied for trucks under crosswind conditions. The interface of the Zhengzhou Taohuayu Yellow River Highway Bridge highway driving stability early warning system under crosswind conditions is shown in Figure 22.
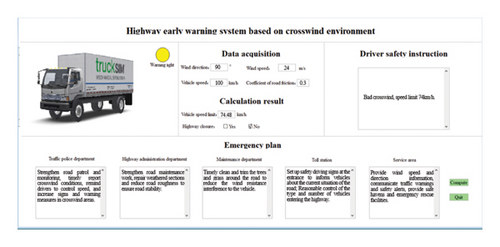
As seen in Figure 22, at noon on February 19, 2024, the wind direction at the Taohuayu Yellow River Highway Bridge was 90°, with a wind speed of 24 m/s and a road adhesion coefficient of 0.3. Under these conditions, the safe speed for trucks was calculated to be 74 km/h, and the warning light displayed yellow. The driver safety alert indicated that the crosswind conditions were hazardous, with a recommended speed limit of 74 km/h. In response, the emergency plan designated as Plan 2 for trucks was implemented.
This study investigates the relationship between the road friction coefficient, wind speed, and wind direction at the Zhengzhou Taohuayu Yellow River Highway Bridge from 1:00 a.m. to 24:00 p.m. on February 19, 2024. Utilizing the safe speed model for trucks discussed in Section 2, the safe driving speed for trucks is calculated. Furthermore, a highway warning system, informed by the crosswind environment as outlined in Section 3, is developed to generate the warning interface and precautionary measures specific to the Zhengzhou Taohuayu Yellow River Highway Bridge, thereby enhancing driving safety in crosswind conditions.
However, this study acknowledges several limitations, which are outlined as follows: (1) The investigation predominantly employed simulation methods to explore the correlation between the safe driving speeds of cars and trucks against variables such as crosswind speed, crosswind direction, and the road adhesion coefficient under crosswind scenarios. Future investigations should incorporate laboratory or field testing to substantiate the validity of conclusions drawn from simulation data. (2) The selection of vehicle types for this simulation study may lack representativeness, as only one model of car and one model of truck were analyzed. Subsequent research should encompass a wider array of vehicle types, particularly those trucks that are more susceptible to crosswind effects. (3) The road model utilized in this simulation is limited to a horizontal straight line; therefore, further research is essential to assess the relationship between vehicle driving stability and crosswinds on both horizontal and vertical curves. (4) The highway driving stability early warning system necessitates additional field tests to evaluate the timeliness and reliability of detection, data processing, and decision-making algorithms, as well as to enhance the short-term predictive capabilities of relevant parameters. This will facilitate the provision of advanced warning information to vehicles and assist in early decision-making on highways.
5. Conclusion
- 1.
As the wind direction varies from 0° to 180°, the lateral offset of the vehicle initially increases and subsequently decreases, reaching a peak at wind directions of 90° and 135°. At 0° and 180°, the lateral offset is approximately 0 m. The lateral offset is positively correlated with increases in both wind speed and vehicle speed, while an enhancement of the road surface friction coefficient contributes to a reduction in the lateral offset. Notably, trucks experience greater lateral offsets due to crosswinds when compared to passenger cars. Passenger cars exhibit unsafe conditions only at a road surface friction coefficient of 0.1, whereas trucks present unsafe conditions across all measured friction coefficients. The lateral offset for trucks at a friction coefficient of 0.1 is significantly larger than that observed within the range of 0.3–0.9.
- 2.
The lateral acceleration of the vehicle exhibits a similar pattern to that of the lateral offset, peaking at wind directions of 90° and 135° and nearing zero at 0° and 180°. Lateral acceleration increases alongside wind speed and vehicle speed, while it diminishes with an increase in the road surface friction coefficient. Trucks are more susceptible to the effects of crosswinds than passenger cars. Although passenger cars remain within the safety limit of 0.4 g under all conditions, trucks indicate unsafe conditions across all tested friction coefficients. The lateral acceleration of trucks at a friction coefficient of 0.1 is considerably elevated compared to that at friction coefficients of 0.3–0.9.
- 3.
The lateral load transfer ratio of the vehicle reflects a pattern of initial increase followed by a decrease in accordance with wind direction from 0° to 180°, with peaks observed at 90° and 135°. This ratio rises with increases in both wind speed and vehicle speed. Notably, as the road surface friction coefficient increases, the peak of the lateral load transfer ratio for trucks shifts from 90° to 135°, and from a lower to a higher friction coefficient. The ratio remains higher for trucks compared to passenger cars. Passenger cars consistently remain within the safety limit of 0.6 under all conditions; however, trucks present unsafe conditions across all tested friction coefficients, representing a risk of rollover. The lateral load transfer ratio of trucks at a friction coefficient of 0.1 is substantially lower than that at friction coefficients of 0.3–0.9.
- 4.
The determination of a minimum safe driving speed that adheres to the critical values required for lateral offset, lateral acceleration, and lateral load transfer ratio facilitates the establishment of a safety speed model. This model delineates the relationship between the safe driving speed of cars or trucks and the respective crosswind speed and direction for each road adhesion coefficient.
- 5.
The developed early warning system for highway driving stability under crosswind conditions incorporates modules for information collection, processing, transmission, and the dissemination of early warning alerts. This system is capable of monitoring critical parameters, such as wind speed and direction, vehicle type and speed, and the road adhesion coefficient in real time. Additionally, it computes the safe vehicle speed values based on the vehicle safety speed model and disseminates early warning information through variable information boards and warning lights. An exemplar application on the Zhengzhou Taohuayu Yellow River Highway Bridge validates the effectiveness of the system, demonstrating that the highway driving stability early warning system significantly enhances the driving safety of vehicles under crosswind conditions and effectively reduces the frequency of traffic accidents attributed to such environmental factors.
Conflicts of Interest
The authors declare no conflicts of interest.
Funding
No funding was received for this manuscript.
Open Research
Data Availability Statement
The data that support the findings of this study are available from the corresponding author upon reasonable request.


