Simulation Optimization of Shovel-Truck System in Open-Pit Mines Considering Rockmass Parameters
Abstract
The shovel-truck system remains a popular method for overburden removal and mineral excavation in open-pit mines, needing rigorous logistical management to achieve required productivity levels and maximize resource utilization. Fixed truck assignment (FTA) models represent a prevalent method for truck allocation in open-pit mining, owing to their simplified fleet operational management. However, existing FTA models often overlook the simultaneous minimization of both trucks’ waiting time and shovels’ idle time. Consequently, these oversights lead to suboptimal allocation of trucks to shovels, resulting in either trucks queuing or shovels idling while awaiting trucks. Such inefficiencies contribute to fleet underutilization and increased fuel costs. To tackle the above issue, this research introduces a novel truck dispatching rule, MFTA, which integrates geotechnical parameters and excavating equipment performance to optimize truck allocation in open-pit mining. Geotechnical parameters across various rock and soil formations reveal significant variability, influencing shovel performance assessed through the total loading time (TLT) indicator. Utilizing TLT and travel times of loaded and empty trucks, the study determines the optimal number of fixed trucks allocated to each shovel by minimizing the total waiting time (TWT). A case study conducted in an open-pit coal mine in Thar, Pakistan, validates the approach, demonstrating that adjusting truck allocations based on TLT significantly reduces operational inefficiencies and enhances productivity. The findings highlight the effectiveness of this method in improving overall operational efficiency and economics in open-pit mining. Integrating real-time data and advanced simulation techniques, this research enhances the competitiveness and sustainability of mining operations. These outcomes are particularly relevant for mining professionals aiming to optimize mining operations for improved efficiency and sustainability.
1. Introduction
1.1. The Loading and Haulage in Surface Mining
The loading and hauling process in surface mining operations plays a crucial role in the economic viability of the mining project. Surface mining operations involve the removal of the overburden and extraction of minerals, valuable ores, and coal from the Earth’s crust [1]. Open-pit mining is a prevalent surface mining technique that involves the development of levels or benches within both the overburden, to expose the targeted mineral, and within the mineral deposit itself, to excavate it.. The excavated overburden is then transported to a specified location, known as the dumpsite, whereas the targeted mineral is transported for further processing or directly to the end user, as the case may be [2]. These surface mining operations require heavy equipment such as draglines, hydraulic excavators, and bucket wheel excavators to accomplish the production demands [3]. A substantial capital investment is made in the procurement of mining equipment. Hence, the effective utilization of this equipment is one of the main economic considerations in every surface mining project [4, 5].
Equipment utilization indicates how effectively it is deployed and its contribution to overburden removal and the excavation of mineral [6]. Excavators, notably hydraulic shovels, have gained widespread popularity due to their variety in terms of scale of operation, especially when used for excavating soft sedimentary rocks. Hydraulic-operated shovels are now widely used in mining and civil construction sites, playing a vital role in both drill-blast excavation and mechanical excavation methods [7]. As a result, the shovel-truck system has become a common material handling and transportation system in open-pit mines.
Many truck allocation strategies have been suggested based on different objective functions to optimize the efficiency and productivity of mining operations. The fixed truck assignment (FTA) strategy, as described by Lizotte and Bonates [8], assigns trucks to shovels based on a predetermined schedule, focusing on maintaining a consistent workflow. In addition to this, other strategies such as minimizing truck waiting times (MTWTs) and minimizing shovel idle times (MSIDs) have been explored extensively. For example, Kolonja et al. [9] discussed that while the MTWT rule aims to reduce the waiting period for trucks, thereby enhancing overall operational flow, it can be less efficient than the MSID rule in under-trucked systems. Conversely, in over-trucked systems, the MTWT rule might be preferred as it better accommodates the surplus of trucks without causing significant delays.
Further research into truck allocation strategies has introduced the concept of maximizing truck momentary productivity. This approach prioritizes the immediate productivity of individual trucks, ensuring that each truck operates at its peak efficiency. Another strategy is minimizing shovel saturation or coverage, which involves managing the distribution of trucks to prevent any single shovel from becoming overloaded, thus maintaining a balanced workload across all equipment. Lizotte et al. [10] highlight that all these strategies are single-stage allocation methods, meaning they focus on optimizing a single parameter—such as truck or shovel utilization—without taking into account the broader operational and production constraints of the shovel-truck system. These single-stage approaches can indeed improve productivity by focusing on specific aspects of the operation. However, they often fail to consider the complex interplay between various elements of the system, which can significantly affect overall efficiency.
Additional literature has also explored multistage and dynamic dispatching approaches. For instance, a real-time dispatching system that adapts to changing operational conditions is proposed, aiming to optimize the allocation of trucks more holistically [11, 12]. Similarly, the use of simulation and optimization techniques is introduced to develop more sophisticated dispatching rules that consider multiple factors simultaneously, such as fuel consumption, maintenance schedules, and production targets [13, 14].
The FTA system is still used as a truck allocation strategy in open-pit mines because it is simple to understand by the operators and hence easy to implement. However, the FTA system is found to be inefficient because it either increases the truck waiting times at loading or may cause the shovel to remain idle. In either case, it increases the operating cost of mining activities. It is very important to determine the accurate number of trucks that need to be allocated, by identifying and considering the critical operating parameters while making truck allocation decisions. FTA allows operators to become familiar with their trucks, leading to more efficient operation and maintenance [15]. FTA enables targeted maintenance, reducing downtime, increasing overall equipment effectiveness, allowing for optimized haul road design, reducing travel times, and improving safety. Additionally, it facilitates production planning, enabling mines to better coordinate digging and hauling activities, improving operator skills and reducing errors, maximizing truck utilization, reducing idle time, and increasing productivity [16–18]. While automatic assignments may offer many benefits, such as flexibility and adaptability, the advantages of FTA make it a preferred choice in open-pit mining operations.
Nowadays, computational techniques such as discrete event simulations (DESs) are being used to model the behavior of complex systems effectively by using the available simulation software [19–23]. This helps the researchers to save time and effort invested in learning complex programming languages and also facilitates identifying the possible errors in the input data [24]. Studies have been conducted for fixed truck allocation based on objective functions such as production targets, shovel utilization, ore grade constraints, and haul distance [25, 26]. Additionally, researchers have considered ore grade blending and heterogenous fleet, i.e., different types of shovels, trucks, or both as the objective functions for optimal truck allocation [27].
1.2. Significance of Rockmass Parameters in Excavation and Loading Process
The rock mass parameters influence all stages of the mining process, from excavation to loading and haulage, and are critical for ensuring stability and safety [28]. The ongoing development of more sophisticated modeling techniques and monitoring systems continues to enhance our ability to predict and manage rock mass behavior in these challenging environments [29]. The significance of these parameters lies in their direct impact on the loading process, which encompasses excavation, transportation, and processing of the mined material. Key rock mass properties include uniaxial compressive strength, tensile strength (TS), shear strength parameters (cohesion (C) and friction angle), rock quality designation (RQD), wet bulk density (WBD), and moisture content of the formation [30, 31]. Additionally, the discontinuity parameters such as frequency and orientation of joints also play a vital role in the excavation and transportation of the exploited material. Unstable rock masses due to unfavorable joint dips can disrupt load and haul operations. Equipment may need to be rerouted, or additional transport cycles may be required to manage fragmented or loose material safely, increasing fuel and maintenance costs [32].
The rock mass behavior significantly affects the shovel performance, especially in scenarios where the drill-blast system is not recommended, and the excavation operation involves removing overburden and extracting minerals [33, 34]. Therefore, the deployment of shovels and the number of trucks assigned to each shovel must take into account the geological and geomechanical characteristics of the rock mass to maximize the equipment utilization [35]. The optimization of shovel-truck utilization is contingent upon correlating the variability in rock mass properties with its performance parameters [36].
A review of existing studies on fixed truck allocation indicates that variation in rock mass properties is not considered during truck allocation. This variation needs to be addressed by considering the lithological heterogeneity because rock properties significantly affect the excavation performance of the shovel. Lithological heterogeneity is the variation in the rock mass properties at different working levels of the pit. The material being excavated and loaded by the shovel varies from sandy, unconsolidated mass to firmly compacted rock mass. Additionally, high-strength rock layers are interbedded with low-strength layers, and vice versa. In either case, the excavation performance of the shovel significantly varies. Therefore, the shovels working at various levels will take different loading times to excavate the material from the bench face and load it into the truck and thus require a variable number of trucks to be allocated.
This research aims to determine the fixed number of trucks required to be allocated to each shovel, to minimize time losses associated with both the shovel and the truck. Initially, the rock mass properties that affect the excavation performance of the shovel are determined for each rock and soil type. This is done to account for lithological heterogeneity and to divide the overall coal-bearing strata into different layers based on variations in rock mass properties. Subsequently, the objective function considers operational constraints such as the excavation performance of shovels in different rock and soil formations, as well as the travel times of loaded and empty trucks. Based on these criteria, a novel FTA rule is suggested. This modified fixed truck assignment (MFTA) strategy is effective in minimizing the time losses associated with the shovel-truck systems by using the FTA rule as the allocation strategy.
2. Model Development
2.1. Acronym List
- •
TLT: Total loading time (sec.)
- •
SCT: Shovel cycle time (sec.)
- •
N: Number of shovel loading cycles to fill one truck
- •
Tspot: Spotting time of truck at loading point (sec.)
- •
Tleave: Leaving time of the truck from the loading point (sec.)
- •
TCT: Truck cycle time (mins.)
- •
Tloaded: Travel time of loaded truck (mins.)
- •
Tdump: Unloading or dumping time of truck (mins.)
- •
Tempty: Travel time of empty truck (mins.)
- •
TWT: Total waiting time of shovel and truck (mins.)
- •
SRT: Shovel ready time (mins.)
- •
TRT: Truck ready time (mins.)
- •
Trelease: Shovel release time (mins.)
- •
Tseize: Shovel seize time (mins.)
- •
Tnow: The current time of operation, as a truck enters the system (mins.)
- •
Twait: Truck waiting time in queue (mins.)
- •
Trelease(T − 1): Shovel release time in the previous instance (mins.)
- •
FC: Fuel consumption
- •
SFC: Fuel consumption of shovel
- •
TFC: Fuel consumption of truck
2.2. MFTA Model
The MFTA model offers significant advantages over the traditional FTA model by incorporating a comprehensive assessment of excavation performance, lithological heterogeneity, and operational constraints. Unlike FTA, which does not consider the excavation performance of shovels, the MFTA meticulously evaluates the excavation performance across various rock and soil formations, as well as travel times. This new approach ensures a continuous and efficient workflow, minimizing idle times for both trucks and shovels. By considering the diverse characteristics of the excavation site and adjusting the number of trucks accordingly, the MFTA model significantly reduces downtime. The novelty of the MFTA model lies in its holistic consideration of rockmass factors that influence excavation operations. By accounting for lithological heterogeneity, it ensures that the trucks and shovels are not just allocated based on fixed numbers but are adjusted according to the specific demands of different geological formations. This leads to a more seamless workflow, as resources are consistently and effectively used.
- •
Rockmass properties are known and constant.
- •
Lithological heterogeneity is accounted for by dividing the strata into distinct layers.
- •
Excavation performance of shovels is known and constant per rock and soil formation.
- •
Travel times of loaded and empty trucks are known and constant.
The total loading time (TLT) is considered a major indicator of shovel performance in this study. It is defined as the total time a shovel takes to fill one truck including its spotting and leaving times at the loading point. The spotting and leaving times of the truck are incorporated into the TLT because the shovel is typically involved in excavation work as the loaded truck departs from the loading point, and the next (empty) truck spots itself for getting filled. The shovel cycle time (SCT) is a critical factor in determining the efficiency and productivity of the excavation process. Rock mass parameters significantly influence the SCT, and these parameters can be broadly categorized into geological, mechanical, and operational factors. Harder rocks require more force and time to be broken down by the shovel, which can slow down the loading process and consequently increase the SCT. Softer rocks are easier to excavate, leading to shorter SCT. Well-fragmented rock (due to blasting or natural conditions) is easier to load, resulting in faster cycle times. In contrast, poorly fragmented rock requires additional handling, which can slow down the shovel operation.
The truck cycle time (TCT) is considered a performance indicator for trucks. It is the time taken by a loaded truck to travel from loading point to dumping (unloading) point and travel back to next loading point. This does not include the truck waiting time (in case of queuing at loading point), which is considered as time loss component in this study.
2.3. Objective Function and Constraints
The MFTA considers the inherent variability in rock characteristics throughout the mining area, providing a more adaptable and responsive dispatching strategy. The developed model contributes to the advancement of equipment utilization by determining the accurate number of trucks to be assigned to a shovel for a specific period, i.e., during which the shovel does not change its location.
2.4. Development of Simulation Model
Based on the mathematical model developed in the previous section, the simulation model is created using Arena software. Arena software is widely recognized and utilized for simulation and optimization across various industries [37–39]. Trucks are created as entities, whereas the excavation, loading, and hauling operations are designed as processes in the simulation model. Furthermore, the loading times of shovels, dumping times of trucks, and travel times of loaded and empty trucks are considered as inputs. The process flowchart shown in Figure 1 describes the stages of model development.
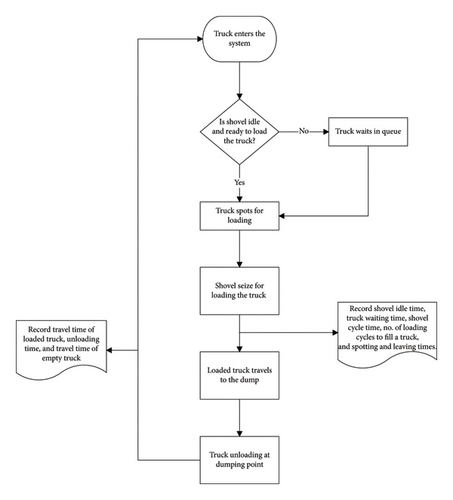
The loading and hauling operation starts with the arrival of trucks at the loading point where the shovels are deployed for either the removal of overburden or the excavation of the coal. If the shovel is ready to load at the time when a truck arrives loading point, the truck spots for loading; otherwise, it will join the queue and wait. In either case, once the truck is spotted, the shovel will excavate and load the material in the truck. The material type depends on the location of the shovel, i.e., the bench where it is deployed. Depending on the material type loaded in trucks, the trucks might travel to the coal crusher, in-pit dump, or ex-pit dump. Once the loaded trucks reach their corresponding destinations, they might spot to unload/dump the material or wait for their turn. The empty trucks subsequently travel back and return to their respective fixed loading points. The results of simulations are saved in a .txt file for further analysis and processing.
The simulation model does not consider the unavailability of trucks and shovels in case of corrective or preventive maintenance. Therefore, it is assumed that the total truck fleet and shovels are available for a complete work shift. Furthermore, the model does not account for the unavailability of operators and rates of face advance (i.e., the production targets of different shovels). Additionally, the shovels fill the trucks as per the FIFO (first in, first out) rule, which indicates that the truck that arrives earlier at the loading spot will be given priority for loading. Finally, the developed model is run, and the simulation results are compared with the actual results acquired from the real-time field investigation. The investigated parameters include loading times, travel times, and time losses. The number of replications for the simulation model is determined as suggested by Anani and Awuah-Offei [40], which is discussed in detail in the next section.
3. Model Implementation
3.1. Study Area
The Thar Coalfield is situated in the Thar Desert of Sindh province of Pakistan. It has about 175 billion tons of lignite-type coal making it one of the largest coal deposits in the world. The Thar coal is currently the most essential and sustainable energy source for Pakistan. The discovery of coalfield dates back to the late 1980s; however, the resources were confirmed through a detailed exploration of the area in 1994 [41]. The Thar coal project is currently the major coal-producing project in Pakistan, which is focused on the utilization of indigenous coal reserves for electricity generation.
The Thar Coalfield is comprised of three geological formations [42]. The top surface of the coalfield is composed of undulating and thick sand dunes of Recent formation deposited during the quaternary period. Lithologically, the Recent formation is composed of a blend of sand, silt, and clay [1]. The Subrecent formation underlies the Recent formation and was deposited during the same period. These are alluvial deposits comprising silty sand, sandstone, siltstone, and claystone. The overlying strata then meets the coal-bearing zone (the Bara formation), deposited during the tertiary period of the Cenozioc era (Figure 2). The coal-bearing formation consisted of a sequence of coal seams of varying thickness, deposited at about 130 and 250 m deep, with a cumulative seam thickness of 1.45–42.6 m [43].
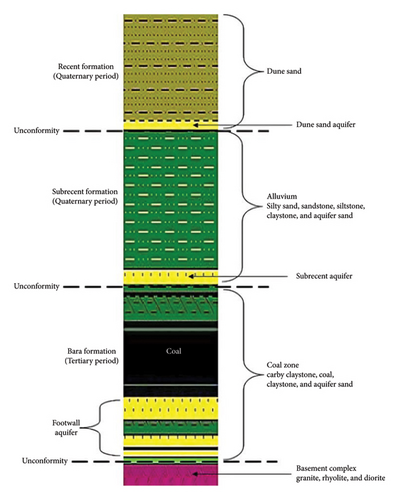
These entire strata are slightly dipping at about 2°, which makes it structurally simple, and no major fault zones are encountered within the coalfield. The Bara formation rests upon the major unconformity, underlain by the granite basement zone deposited during the Precambrian era [44]. Prolonged erosion and nondeposition have resulted in the basement granite being highly weathered. It is moderately compacted and composed of coarse to fine quartz grains, with minor amounts of rhyolite and diorite [45]. Figure 2 presents the generalized lithology and stratigraphy of the Thar coal basin.
At the base of the Recent formation lies the dune sand aquifer. This aquifer is present all over the Thar Desert and on the Indian side. The water column in this aquifer is only around one to 5 m at maximum. The Subrecent aquifer is located at the base of the Subrecent formation. It is spread all over the Thar area, having a thickness from almost zero to about 12 m with an average of about 6 m. The footwall aquifer lies at the base of the Bara formation. This aquifer covers the whole Thar area. It has a varying thickness of about 30 to 50 m [46].
3.2. Data Collection and Time Study Analysis
The study area currently practices the FTA system to allocate a specific number of trucks to each working shovel unit, which remains allocated to serve the same shovel throughout the shift. This allocation decision is based on the TCT, which depends on the truck’s route length (distance between the loading and dumping stations). Therefore, the shovels that are deployed near the dumping stations are allocated with a smaller number of trucks as compared to those that are working comparatively farther. This allocation strategy assumes that all shovels operate similarly and have consistent performance throughout the shift. However, in real-time mining operations, shovel performance can vary due to factors such as geological conditions, rock hardness, fragmentation, and operator skill. Some shovels may be more efficient and productive than others, leading to quicker loading times and shorter cycle times. Conversely, shovels facing tougher conditions may experience longer cycle times. Because the FTA system does not account for these variations in shovel performance, it can lead to inefficient utilization of equipment and increased time losses.
This study centered on the optimization of trucks required to be allocated at each working shovel to minimize the time losses associated with the shovel and truck utilization. Queuing scenario occurs due to an excessive number of trucks allocated to any shovel, whereas the shovels stand idle due to the unavailability of trucks for a specific period, i.e., a smaller number of trucks are allocated. Real-time field and laboratory investigations are conducted.
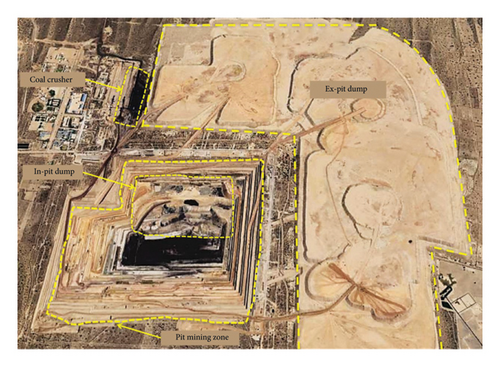
The field investigation involved recording videos of shovel excavation and loading operations for fifteen shovels deployed at different lithological levels of an open-pit coal mine in Thar. The mine can produce 3.8 million tons of lignite coal per year. There are two waste dumps: one located outside the pit mining zone, called the “ex-pit” dump, and another located within the pit mining zone, known as the “in-pit” dump. The coal crushing unit is located near the stockyard area beside the ex-pit dump (Figure 3).
The shovels are backhoe-type hydraulic operated (Komatsu PC-1250), with a bucket capacity of 7 m3, filling two different types of trucks, i.e., 34 m3 for overburden (TL875D) and 54 m3 for coal (TL875M). At each shovel (loading) station, the filling of forty trucks is recorded for 5 days, and the operational parameters are then extracted from the videos. These parameters include SCT, number of shovel loading cycles to fill a truck (N), travel times of loaded truck (Tloaded), unloading or dumping times (Tdump), travel times of empty truck (Tempty), spotting times (Tspot), leaving times (Tleave), shovel idle times (Tidle), and truck waiting times (Twait).
The laboratory investigation involved the determination of geotechnical parameters for each rock/soil type, to understand the variation in the excavation performance of shovel. Shaikh et al. [30] proposed that the rockmass parameters such as RQD, unconfined compressive strength (UCS), TS, C, internal angle of friction (ϕ), WBD, and moisture content (M) are essential to be considered while assessing the shovel performance. The representative core samples from two exploratory boreholes are selected to determine the rock properties at each working bench. The samples are prepared and tested in the laboratory on an “as received” (AR) basis, following the ASTM and ISRM-compliant methods [47–49]. The average values of the rock properties determined from the laboratory testing are presented in Table 1.
| Rock type | Formation | UCS (MPa) | TS (MPa) | C (MPa) | ϕ (deg.) | M (%) | WBD (t/m3) | RQD (%) |
|---|---|---|---|---|---|---|---|---|
| Dune sand | Recent | 0.00 | 0.00 | 0.05 | 38 | 20.2 | 2.00 | 0.0 |
| Sandstone | Subrecent | 2.00 | 0.27 | 0.08 | 42 | 21.8 | 2.04 | 53.7 |
| Silty sand | Subrecent | 0.47 | 0.06 | 0.07 | 40 | 17.5 | 2.06 | 45.2 |
| Siltstone-1 | Subrecent | 0.80 | 0.16 | 0.10 | 36 | 16.6 | 2.10 | 81.1 |
| Claystone-1 | Subrecent | 0.60 | 0.15 | 0.15 | 35 | 18.0 | 2.15 | 79.3 |
| Siltstone-2 | Subrecent | 0.66 | 0.08 | 0.13 | 31 | 13.5 | 2.20 | 81.6 |
| Aquifer sand-1 | Subrecent | 0.50 | 0.07 | 0.11 | 41 | 21.2 | 1.99 | 0.0 |
| Claystone-2 | Subrecent | 1.17 | 0.17 | 0.09 | 36 | 12.2 | 2.30 | 73.8 |
| Aquifer sand-2 | Bara | 0.50 | 0.07 | 0.11 | 41 | 21.2 | 1.99 | 0.0 |
| Carby claystone | Bara | 1.30 | 0.24 | 0.19 | 39 | 35.6 | 1.57 | 75.5 |
| Coal-1 | Bara | 1.87 | 0.22 | 0.24 | 45 | 46.8 | 1.29 | 89.0 |
| Coal-2 | Bara | 1.81 | 0.21 | 0.19 | 48 | 40.6 | 1.26 | 84.6 |
| Claystone-3 | Bara | Pit bottom | ||||||
The data modeling and analysis methodology has been described in detail by Anani and Awuah-Offei [40], emphasizing the importance of adequately capturing the variability in simulation outcomes by performing a sufficient number of replications. The number of replications for the simulation model is determined to achieve statistically significant outcomes. Initially, a small number of simulation runs are conducted to estimate the mean and variance of key performance metrics. Using the results from these initial runs, a confidence interval is calculated for the mean of each performance metric, commonly at a 95% confidence level.
The half-width of the confidence interval, which represents the margin of error around the estimated mean, is then evaluated. If the half-width is too large, indicating an imprecise estimate, additional replications are performed. By increasing the number of replications, the standard error of the mean is reduced, thereby narrowing the confidence interval and decreasing the half-width. This iterative process ensures that the simulation results are both statistically significant and practically useful for decision making in mining operations. By iteratively adjusting the number of replications based on the observed variability and desired precision, they provide a structured way to achieve reliable simulation outcomes.
The TLT (equation (1)) and travel times of loaded and empty trucks were extracted through time study analysis. These data are stored in a text file (.txt format). The text files are analyzed using Arena input analyzer to generate the probability distribution functions (PDFs), which assisted in acquiring the distributions that best fit the sample data. Based on the chi-square and Kolmogorov–Smirnov (KS) tests, the distributions are evaluated to measure the goodness of fit [50]. An example of probability distribution analysis for TLT of shovel working in siltstone-2 rock performed using an Arena input analyzer is shown in Table 2. For a sample size of two hundred, the available distributions and corresponding error values are expressed as follows.
| Function | Sq. error |
|---|---|
| Normal | 0.0121 |
| Beta | 0.0185 |
| Triangular | 0.0214 |
| Uniform | 0.0578 |
| Weibull | 0.0647 |
| Erlang | 0.0839 |
| Exponential | 0.0839 |
| Gamma | 0.101 |
| Lognormal | 0.185 |
The expressions for the loading times are presented in Table 3, along with the corresponding distribution and test statistics.
| No. of shovels | Shovel location | Lithology | Distribution | Expression | p value (KS test) | Sq. error |
|---|---|---|---|---|---|---|
| 2 | S-1, S-2 | Dune sand | Exponential | 130 + EXPO (52.5) | > 0.15 | 0.041754 |
| 1 | S-3 | Sandstone | Normal | NORM (263, 39.2) | > 0.15 | 0.094197 |
| 1 | S-4 | Silty sand | Beta | 139 + 60∗BETA (0.445, 0.575) | > 0.15 | 0.106397 |
| 2 | S-5, S-6 | Siltstone-1 | Normal | NORM (210, 40.4) | > 0.15 | 0.042670 |
| 1 | S-7 | Claystone-1 | Exponential | 201 + EXPO (34.7) | > 0.15 | 0.086343 |
| 1 | S-8 | Siltstone-2 | Normal | NORM (246, 24.7) | > 0.15 | 0.012104 |
| 1 | S-9 | Aquifer sand-1 | Uniform | UNIF (143, 206) | > 0.15 | 0.081349 |
| 1 | S-10 | Claystone-2 | Exponential | 217 + EXPO (44.6) | > 0.15 | 0.020093 |
| 1 | S-11 | Aquifer Sand-2 | Beta | 213 + 98∗BETA (0.515, 0.546) | > 0.15 | 0.062870 |
| 1 | S-12 | Carby claystone | Beta | 240 + 95∗BETA (0.277, 0.386) | > 0.15 | 0.084489 |
| 2 | S-13, S-14 | Coal-1 | Normal | NORM (308, 31.7) | > 0.15 | 0.033535 |
| 1 | S-15 | Coal-2 | Uniform | UNIF (168, 339) | > 0.15 | 0.022222 |
Likewise, the expressions for loaded and empty truck travel times are presented in Table 4.
| Shovel location | Travel time type | Distribution | Expression | p value (KS test) | Error |
|---|---|---|---|---|---|
| S-1 | Loaded | Lognormal | 14.4 + LOGN (1.41, 1.44) | > 0.15 | 0.059032 |
| Empty | Beta | 9.61 + 0.97∗BETA (0.742, 0.96) | > 0.15 | 0.042616 | |
| S-2 | Loaded | Normal | UNIF (13.8, 14.3) | > 0.15 | 0.080000 |
| Empty | Uniform | NORM (9.23, 0.145) | > 0.15 | 0.152058 | |
| S-3 | Loaded | Lognormal | 13.7 + LOGN (0.834, 0.781) | > 0.15 | 0.022076 |
| Empty | Beta | 9.05 + 1.15∗BETA (0.753, 0.965) | > 0.15 | 0.044024 | |
| S-4 | Loaded | Beta | 15.9 + 1.15∗BETA (1.08, 0.594) | > 0.15 | 0.073662 |
| Empty | Exponential | 12 + EXPO (0.307) | > 0.15 | 0.074705 | |
| S-5 | Loaded | Beta | 15.9 + 0.34∗BETA (0.436, 0.49) | > 0.15 | 0.050378 |
| Empty | Beta | 9.88 + 0.74∗BETA (0.754, 0.486) | > 0.15 | 0.032306 | |
| S-6 | Loaded | Exponential | 14 + EXPO (0.552) | > 0.15 | 0.050126 |
| Empty | Beta | 10 + 1.31∗BETA (1.35, 1.18) | > 0.15 | 0.017084 | |
| S-7 | Loaded | Uniform | UNIF (14, 16.4) | > 0.15 | 0.024490 |
| Empty | Normal | NORM (10.6, 0.356) | > 0.15 | 0.033567 | |
| S-8 | Loaded | Normal | NORM (8.78, 0.294) | > 0.15 | 0.071245 |
| Empty | Normal | NORM (6.11, 0.697) | > 0.15 | 0.017383 | |
| S-9 | Loaded | Uniform | UNIF (6.23, 9.47) | > 0.15 | 0.050000 |
| Empty | Uniform | UNIF (5, 7.24) | > 0.15 | 0.018750 | |
| S-10 | Loaded | Beta | 20 + 5∗BETA (0.403, 0.36) | > 0.15 | 0.037989 |
| Empty | Beta | 12 + 16∗BETA (0.0565, 0.0588) | > 0.15 | 0.047725 | |
| S-11 | Loaded | Uniform | UNIF (21.1, 22.2) | > 0.15 | 0.065306 |
| Empty | Normal | NORM (16.8, 0.333) | > 0.15 | 0.034585 | |
| S-12 | Loaded | Uniform | UNIF (5.37, 6.28) | > 0.15 | 0.050000 |
| Empty | Uniform | UNIF (6.82, 7.73) | > 0.15 | 0.050000 | |
| S-13 | Loaded | Beta | 23.5 + 0.84∗BETA (0.812, 0.727) | > 0.15 | 0.065942 |
| Empty | Gamma | 23.8 + GAMM (0.159, 2.31) | > 0.15 | 0.039196 | |
| S-14 | Loaded | Gamma | 19.3 + GAMM (0.168, 2.08) | > 0.15 | 0.041786 |
| Empty | Lognormal | 19.3 + LOGN (0.368, 0.34) | > 0.15 | 0.039043 | |
| S-15 | Loaded | Beta | 21.5 + 0.88∗BETA (0.434, 0.582) | > 0.15 | 0.047665 |
| Empty | Lognormal | 19.1 + LOGN (0.449, 0.411) | > 0.15 | 0.071271 | |
3.3. Simulation Optimization
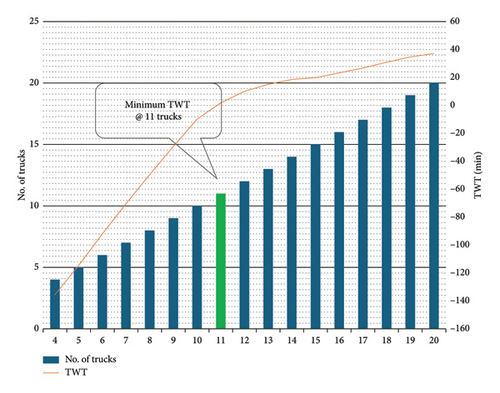
Based on the data collected and the model developed in the previous section, a simulation optimization is performed to determine the optimum number of trucks required to be allocated at each shovel. The trucks (configured as entities) are allocated in a variable range of 4 to 20 units to each of the fifteen shovels (configured as resources). The optimization is carried out using the OptQuest tool in the Arena software, which offers heuristic-type simulation optimization [51, 52]. The tool optimized the loading and hauling process, as created in the Arena simulation model (Figure 1), for determining the required number of trucks. The objective function is to minimize the time losses, i.e. the average TWT of trucks and shovels.
While determining the optimal value of the objective function, the foremost priority is set as TWT = 0, which indicates an ideal scenario in that neither the truck waits in queue, nor the shovel stays idle. Secondly, considering that the fuel consumption of an idle shovel is much greater than that of a truck waiting in the queue, the second priority is given to minimizing the shovel’s idle times. For this purpose, another constraint is defined, i.e., the optimum number of trucks must be determined at a minimum value of TWT > 0 and a confidence interval of 95%. The results of simulation optimization, including the number of trucks and corresponding TWT, are exported in a .txt file for further analysis.
For a demonstration, the analysis of simulation results for shovel-1 deployed in dune sand is presented in Figure 4. It is observed that eleven trucks will be required to be allocated at shovel-1 for which the corresponding average TWT is minimum.
4. Results and Discussion
A case study is conducted as part of the implementation of the developed model. The performance parameters are determined for the shovel-truck operation through real-time field investigation of the loading and hauling process in each rock/soil formation. The TLT is calculated, and PDF expressions are acquired (Table 3) performing the goodness of fit tests using the Arena input analyzer. The distribution functions included normal, exponential, beta, and uniform distributions. Furthermore, travel times for both loaded and empty trucks are obtained from comprehensive time study analyses. Probability distribution expressions for these travel times are established and documented in Table 4, which include beta, uniform, normal, lognormal, exponential, and gamma distributions based on empirical data.
Finally, the simulation optimization is conducted using OptQuest within the Arena simulation environment. Table 5 presents the optimization results, which reflect the adjusted parameters and improvements achieved through the optimization process. This integrated approach ensures that the model accurately represents real-world conditions, allowing for effective decision making and process improvement in the loading and hauling operations of the mining environment.
| Shovel location | Lithology | Optimum no. of trucks (NTopt) | TWT @ NTopt (mins.) | TWT @ NTopt + 1 (mins.) | TWT @ NTopt − 1 (mins.) |
|---|---|---|---|---|---|
| S-1 | Dune sand | 11 | 1.78 | 10.04 | −9.84 |
| S-2 | Dune sand | 10 | 3.81 | 10.90 | −10.99 |
| S-3 | Sandstone | 8 | 7.00 | 12.13 | −4.11 |
| S-4 | Silty sand | 13 | 2.30 | 5.25 | −5.56 |
| S-5 | Siltstone-1 | 10 | 4.91 | 9.27 | −6.77 |
| S-6 | Siltstone-1 | 10 | 6.79 | 11.58 | −2.12 |
| S-7 | Claystone-1 | 9 | 6.44 | 10.43 | −4.87 |
| S-8 | Siltstone-2 | 6 | 3.11 | 7.62 | −6.50 |
| S-9 | Aquifer sand-1 | 8 | 4.00 | 6.95 | −3.12 |
| S-10 | Claystone-2 | 12 | 8.42 | 19.01 | −7.98 |
| S-11 | Aquifer sand-2 | 11 | 6.15 | 11.05 | −5.05 |
| S-12 | Carby claystone | 5 | 2.91 | 7.40 | −9.60 |
| S-13 | Coal-1 | 11 | 6.37 | 13.14 | −9.57 |
| S-14 | Coal-1 | 9 | 1.65 | 10.74 | −20.60 |
| S-15 | Coal-2 | 12 | 7.02 | 14.50 | −5.34 |
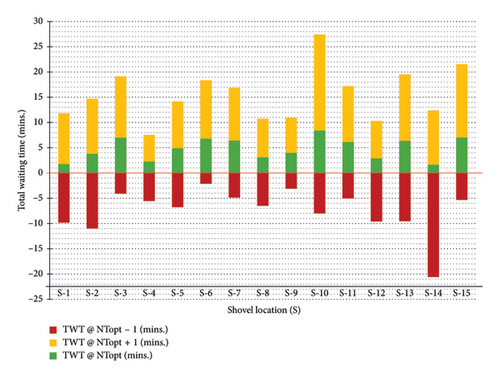
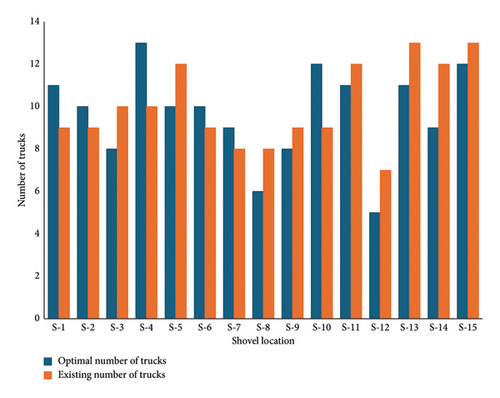
Three scenarios have been discussed in terms of the TWT parameter (Table 5). Firstly, for an optimal number of trucks (NTopt), the corresponding average TWT parameter (TWT@NTopt) is determined. Subsequently, the TWT@NTopt is compared with the average TWTs in two different cases, i.e., TWT in case a single truck unit is increased than the optimal number (TWT@NTopt + 1) or decreased (TWT @ NTopt − 1). The observation that the optimal number of trucks determined by the simulation yields the minimum positive values of TWT in each case validates the model. Increasing or decreasing a single truck from the optimal number significantly affects the TWT parameter. A comparison between the TWTs for the discussed scenarios has been made to attribute the variation in TWT to the increase or decrease in NTopt (Figure 5). The optimum number of trucks required at corresponding loading points in different rocks and soil formations compared to the actual number of trucks allocated is shown in Figure 6. The total optimal number of trucks required is 145, for the case study.
4.1. Model Verification
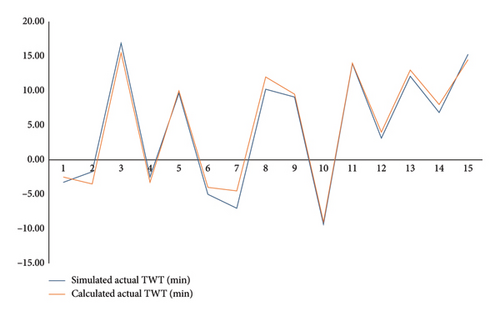
The cross-correlation between “calculated actual TWT” from the time study analysis and “simulated actual TWT” is shown in Figure 7, suggesting a very strong correlation and indicating that the simulation accurately models the actual waiting time. It is observed that the simulation methodology is reliable and can predict the TWT with high accuracy. Any minor deviations might result from variability in the simulated system. Overall, the simulated system is reliable for optimal truck allocation problems where accurate modeling of waiting times is essential to reduce the inefficiencies.
Furthermore, the optimized TWT results obtained from simulation optimization are compared with simulated actual TWT data of the existing loading and hauling system in the study area (Figure 8). A significant difference between the datasets is evident. For instance, at shovel location S-6, the average actual TWT is recorded as −5 min, indicating that the shovel is idle during this period. In contrast, the optimized average TWT at S-6 is 6.8 min, signifying the average waiting time for trucks at that location.
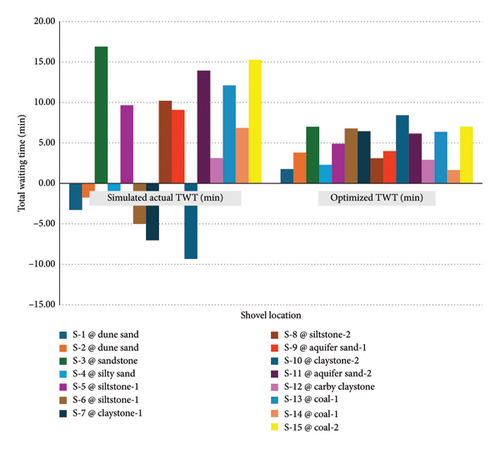
Given the higher fuel consumption of shovels compared to trucks, it is recommended to have at least one truck waiting at each shovel location to prevent shovel idle situations. The optimization results clearly demonstrate that adjusting the number of fixed trucks allocated to each shovel minimizes waiting times, considering the TLT of each shovel. This comparison highlights the effectiveness of the optimization approach in reducing idle times and enhancing operational efficiency in the loading and hauling process within the mining operation.
The optimization results, derived from a comprehensive analysis of the loading process, underscore the critical role of adjusting the allocation of fixed trucks to each shovel in minimizing waiting times. By meticulously considering the TLT associated with each shovel, the proposed MFTA approach optimizes resource utilization and enhances operational efficiency. The mining industries are critically reliant on efficient material handling, and hence minimizing time losses translates to significant cost savings and improved productivity. Therefore, implementing tailored allocation strategies based on TLT metrics emerges as a pivotal aspect of operational optimization, facilitating smoother workflows and bolstering overall performance.
5. Conclusions
This research introduces a truck dispatching rule, MFTA, which considers rock and soil properties alongside the performance of excavating equipment. Geotechnical parameters for rock and soil formations are determined (Table 1), revealing significant variations in rock behavior across different working levels. The performance of the shovel is analyzed based on variations in rock and soil properties, resulting in the determination of a performance indicator, TLT (Table 3). Considering the TLT and travel times of loaded and empty trucks (Table 4), the number of fixed trucks required to be allocated to each shovel is determined (Table 5). The time losses associated with both shovel and truck utilization are minimized to enhance the economics of the overall loading and hauling system.
A case study was performed to determine the optimal number of trucks for each shovel deployed for coal production in an open-pit coal mine at Thar Coalfield, Pakistan. It is concluded that adjusting truck allocations based on the TLT for each shovel significantly reduces time losses and improves operational efficiency, economics, and productivity. The results demonstrated the effectiveness of the proposed approach in enhancing the performance of open-pit mining operations. By integrating real-time data and utilizing advanced simulation techniques, this research provided valuable insights into the optimization of fixed truck allocation strategy, contributing to the overall competitiveness and sustainability of mining operations. The outcomes of this research are expected to have practical implications for mining operators and management professionals seeking to optimize the efficiency and sustainability of mining operations.
Further avenues for research could explore the integration of additional performance metrics beyond those currently examined. These could encompass factors such as equipment maintenance downtime, environmental impacts, and safety considerations, providing a more comprehensive evaluation of system efficiency. Moreover, the proposed methodology could benefit from the inclusion of dynamic operational factors, such as varying demand levels, unexpected equipment failures, or changing geological conditions. By incorporating these dynamic elements, the methodology could be refined to offer more robust and adaptable solutions for optimizing shovel-truck systems in open-pit mines.
Conflicts of Interest
The authors declare no conflicts of interest.
Funding
This research received no funding.
Acknowledgments
We gratefully acknowledge the support and guidance provided by the Department of Mining Engineering, Mehran University of Engineering and Technology, Jamshoro, Sindh, Pakistan, throughout this research. We also extend our gratitude to Sindh Engro Coal Mining Company, Block-II, Thar Coalfield, for their assistance and contributions to various aspects of this study. Additionally, we would like to express our gratitude to the participants who generously shared their time and insights, without whom this research would not have been possible.
Open Research
Data Availability Statement
The manuscript contains all relevant data for this study. Any supporting datasets used or analyzed are available from the corresponding author upon reasonable request.


