Trajectory-Based Safety Analysis of Electric Battery Taxis
Abstract
This paper utilizes trajectory data of electric taxis in Shenzhen to first study the driving characteristics of electric taxis from different indicators such as travel/driving speed, overspeed ratio, and overspeed amplitude. A combination weighting VlseKriterijumska Optimizacija I Kompromisno Resenje (VIKOR) evaluation method based on Nash equilibrium is constructed to comprehensively assess the operation safety of electric taxis in various spatiotemporal scenarios. The results show that the average driving speed and overspeed amplitude of battery electric taxis is 39.14 km/h and 22.78%, which is 1.27 and 1.72 times that of fuel taxis. The average overspeed ratio, average acceleration and deceleration and total acceleration and deceleration frequency are all more than twice those of fuel taxis. The average acceleration, deceleration, and idle time ratios of battery electric taxis are 0.27, 0.24 and 0.43, respectively, with a constant speed time ratio of only 0.06. The proposed combination weighting VIKOR evaluation method outperforms other evaluation methods in comprehensively considering data discreteness and correlation. Electric taxis have the highest operational safety on arterial roads, while the safety on minor arterial roads and local roads is relatively poor, especially on weekends. In all spatiotemporal scenarios, the overall operation safety of electric taxis is lower than that of fuel taxis. The research results can provide theoretical support for the formulation of effective measures and policies to reduce dangerous driving behavior of electric taxis.
1. Introduction
Given the increasingly severe energy crisis and environmental pollution, electric vehicles have emerged as the hotspot for the future development of the automotive industry due to their remarkable advantages in environmental protection, high energy efficiency, and independence from oil resources [1]. In the context of continuous promotion of green and low-carbon policies and the gradual improvement of related infrastructure, battery electric vehicles (BEVs) have emerged as the mainstream of the new energy vehicle market due to their zero emissions characteristics. Currently, the global number of new energy vehicles has surpassed 17 million units, with China, the US, Japan, and Germany serving as representative forces in electric vehicle research and development worldwide [2]. By the end of June 2022, the number of new energy vehicles in China had reached an impressive 10.01 million, accounting for 3.23% of the total vehicle population. Notably, BEVs constituted a substantial majority, with 8.10 million units, representing 80.93% of the total number of new energy vehicles [3].
While BEVs offer advantages such as lower noise and higher efficiency compared to traditional fuel vehicles, their unique operation characteristics have also introduced new challenges for traffic managers. The increasing number of traffic accidents and casualties involving electric vehicles has raised concerns. In 2019 alone, Shanxi Province witnessed 148 new energy vehicle-related traffic accidents, a staggering year-on-year increase of 279.48%, resulting in 11 fatalities and 152 injuries [4]. In Norway, data from 2019 showed that the accident rate of newly registered electric vehicles within the first year was approximately 50%, significantly higher than the 25%–30% range for fuel vehicles during the same period. Similar trends were also reflected in the data from China Banking and Insurance Information Technology Management Co., Ltd. From 2016 to the first half of 2020, the overall accident frequency of new energy vehicles was 3.6% higher than that of traditional fuel vehicles, and the accident frequency of household new energy vehicles was even higher, reaching 9.3%. These data all indicate that the accident rate of electric vehicles is generally higher [5]. The escalating safety issues associated with BEVs necessitate comprehensive analysis and improvement efforts to ensure the well-being of drivers and passengers.
Furthermore, in addition to the fundamental differences in power configuration, battery electric taxis exhibit distinct driving characteristics, including variations in acceleration and deceleration frequency and average speed when compared to fuel taxis. As the electrification of taxis becomes more prevalent, it is essential to conduct thorough analyses of these driving characteristics and perform safety evaluations specific to electric taxis. This study aims to investigate whether BEVs offer superior safety levels compared to their fuel counterparts and determine the need for effective safety countermeasures to enhance the well-being of drivers and passengers. By leveraging GPS trajectory data, this research will analyze and compare the driving characteristics of battery electric taxis and fuel taxis, utilizing various driving characteristic indicators to construct a combination weighting VlseKriterijumska Optimizacija I Kompromisno Resenje (VIKOR) evaluation method based on Nash equilibrium. The evaluation outcomes will provide valuable insights into the operation safety of battery electric taxis across multiple spatiotemporal scenarios, enabling urban traffic control departments to formulate appropriate countermeasures, reduce dangerous driving behaviors, and develop effective management policies for battery electric taxis.
2. Literature Review
Numerous studies have been conducted to evaluate the safety of BEVs [6–9]. However, the existing literature predominantly focuses on the safety of power systems and electrical components within electric vehicles [10–12]. Limited research has been conducted on the qualitative analysis and quantitative evaluation of the overall operation safety of electric vehicles as a whole [13].
Qiu et al. [14] proposed two parameters, namely, steady-state brake energy efficiency and dynamic brake energy efficiency, to assess vehicle operating conditions. They demonstrated that the serial control strategy provided more suitable comfort braking performance and compared the strategy under different conditions, justifying the proposed evaluation parameters. Chen et al. [15] conducted a joint hierarchical optimization of vehicle speed planning and powertrain control for a plug-in hybrid electric vehicle. They integrated external traffic disturbances and powertrain characteristics into speed planning through a Gaussian process model and desired acceleration, respectively. In the power allocation layer, they employed a Double Delay Q-Learning (DDQL) algorithm to optimize power allocation based on the planned speed transients. The feasibility and energy efficiency of the proposed co-optimization strategy were verified using a traffic-in-the-loop simulator under various urban driving scenarios. This current research mainly focuses on analysis of the individual operating performance of vehicles. However, there is still a lack of in-depth exploration and weight analysis of various operation characteristics, such as the startup performance and braking performance of electric vehicles, as well as the weights assigned to different indicators.
Several scholars have employed various evaluation methods to study the operation safety of electric vehicles. McGordon et al. [16] investigated the effect of differential pedal operation by drivers on vehicle energy consumption at the same average vehicle speed. Their results demonstrated that the test group with smooth pedal changes achieved better power-saving and longer battery life. Vatanparvar et al. [17] proposed a context-aware driving behavior estimation method based on artificial neural networks and nonlinear autoregressive algorithms. They developed a driving behavior model that incorporated the driver’s historical behavior, current driving action responses and average speed of the route obtained from Google Maps for long-term evaluation of driving habits. Donkers, Yang and Viktorović [18] selected representative dangerous driving behaviors and categorized them into acceleration combination class and turning class based on driving data collected by the new energy vehicle monitoring system. They established an evaluation model using the fuzzy comprehensive evaluation method, considering the frequency of dangerous driving behaviors. The Spearman nonparametric statistical method was then applied to identify and analyze the dangerous driving behaviors affecting energy consumption. The K-means algorithm was used for automatic classification of driving behavior, and the energy consumption distribution for different levels of driving behavior was analyzed, showing lower energy consumption for smooth driving [19]. Up to the present, evaluation methods including the fuzzy comprehensive evaluation method [20], principal component analysis method [21], logistic regression algorithm [22], score card model [23] and other basic models [24], are relatively simplistic and do not provide a comprehensive and scientific assessment.
In summary, existing research on the operation safety of electric vehicles has primarily focused on the safety of internal components and lacks a comprehensive evaluation of driving safety in different operation stages. The current evaluation methods are relatively simplistic and fail to provide a comprehensive and scientific assessment. Furthermore, there is a lack of detailed investigation into the spatiotemporal characteristics of driving behavior in electric vehicles [25]. To address the deficiencies and fill the gap in existing research, comprehensive spatiotemporal analysis of driving characteristics of electric vehicles will be conducted. This paper also demonstrates a novel combination weighting VIKOR method based on Nash equilibrium for the evaluation of operation safety.
3. Analyses of Driving Characteristics of Battery Electric Taxi
In the aim of revealing the driving characteristics of battery electric taxis, GPS recorders were installed on 14 battery electric taxis in Shenzhen and a total of about 7 million GPS trajectory data with a sampling interval of 1 s from January 21 to 29, 2019 were collected. Using the similar method, GPS trajectory data of 84 fuel taxis in Beijing from September 1 to 31, 2019 with a sampling interval of 10 s were also collected. All trajectory data were collected during 00:00–23:59. To be specific, 5 arterial roads, 5 minor arterial roads and 5 local roads are selected from Shenzhen and Beijing, respectively, to calculate the driving characteristics of battery electric taxis and fuel taxis in different spatiotemporal scenarios. Morning peak, nonpeak hours and evening peak in Shenzhen are defined as 7:00–9:00, 14:00–16:00 and 17:30–19:30, respectively. While morning peak, nonpeak hours and evening peak in Beijing are defined as 7:00–9:00, 12:00–14:00 and 17:00–19:00, respectively.
3.1. Travel Speed/Driving Speed
On the basis of the travel speed, the GPS trajectory data is grouped according to the time interval of every 15 min, and the driving speed on the different road grade and time periods are calculated, respectively.
The calculation results of the travel and driving speed of the battery electric taxi are shown in Figure 1. The travel speed and driving speed of the battery electric taxi in various spatiotemporal scenarios follow a similar distribution. The spatial distribution of battery electric taxis travel/driving speed from the highest to the lowest is arterial road (42.72/54.13 km/h), minor arterial road (26.63/34.66 km/h) and local road (21.12/28.62 km/h). The battery electric taxis travel/driving speed in weekend (32.14/41.38 km/h) is greater than in the workday (28.21/36.89 km/h), and the average travel/driving speed during the evening peak hours (31.46/39.37 km/h) is greater than the morning peak (26.08/36.45 km/h).
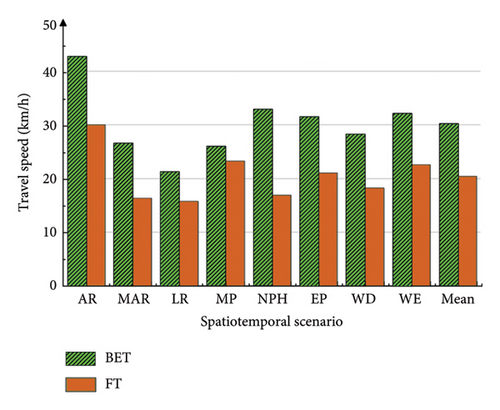
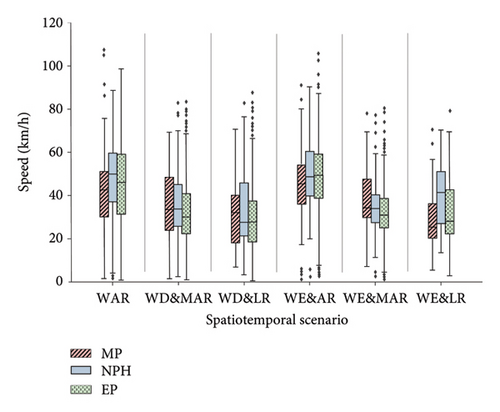
The minimum travel/driving speed of battery electric taxis is 14.15/23.40 km/h, the maximum travel/driving speed is 52.54/62.95 km/h, and the average travel/driving speed is 30.16/39.14 km/h. Compared with the fuel taxis, the minimum, maximum and average travel/driving speed are increased by 94.90%/10.85%, 16.76%/13.65% and 47.79%/26.65%, respectively. Both in time or space, battery electric taxis have higher mean and standard deviations of travel/driving speed than the fuel taxis, reflecting drivers perform more aggressive driving behavior when driving battery electric taxis.
3.2. Overspeed Ratio and Amplitude
The ratio of the overspeed time of the taxi j on the road segment l is used to represent the overspeed ratio of the vehicle. The overspeed amplitude El refers to the ratio of the vehicle speed exceeding the speed limit. The greater the overspeed amplitude, the higher the risk of driving. The overspeed ratio and amplitude of battery electric taxis are shown in Figure 2. In terms of time, the overspeed ratio and amplitude of battery electric taxis on weekends are higher than those on workdays. In terms of space, due to the lack of road traffic signs and markings and supervision on local roads, the overspeed ratio of battery electric taxis on local roads is 28.50%, which is 3.33 times and 1.80 times of the speeding ratio on arterial and minor arterial roads, respectively. The overspeed amplitude of battery electric taxis on local road is 39.17%, which is 4.43 times and 1.93 times that of arterial and minor arterial roads, respectively. The average overspeed ratio of battery electric taxis is 16.83%, which is 2.90 times that of fuel taxis. The average overspeed amplitude is 22.78%, which is 1.72 times that of fuel taxis.
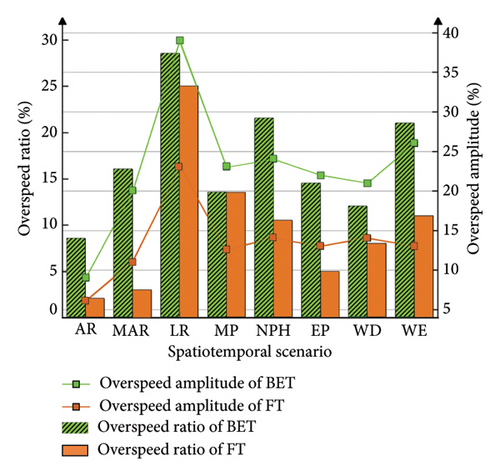
The overspeed ratio and amplitude of battery electric taxis in multiple spatiotemporal scenarios are significantly higher than those of fuel taxis, especially on local roads. It reflects that drivers exhibit more frequent and irregular dangerous behaviors when driving BEVs.
3.3. Acceleration and Deceleration Frequency and Operating Status
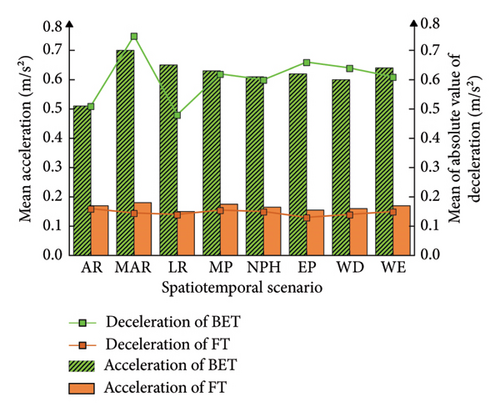
The acceleration and deceleration characteristics of battery electric taxis are obtained by using the instantaneous speed and time information contained in the trajectory data. Results are shown in Figure 3(a). It can be seen that the average acceleration and deceleration of battery electric taxis on minor arterial roads are greater than those on arterial roads and local roads. The mean acceleration of battery electric taxis is 0.62 m/s2, and the mean deceleration is −0.63 m/s2, which are 3.60 and 4.20 times that of fuel taxis, respectively. The average acceleration and deceleration value of battery electric taxis are much higher than those of fuel taxis.
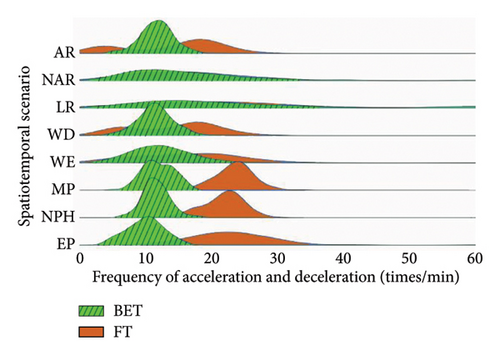
Acceleration and deceleration frequencies refer to the number of accelerations or decelerations in a unit time (times per minute). It can be seen from Figure 3(b) that battery electric taxis are prone to have more frequent acceleration and deceleration behaviors when driving on the local roads. The sum of acceleration and deceleration frequencies of battery electric taxis is 45.60 times/min, which is 2.10 times that of fuel taxis. The results are consistent with the fact that the energy consumed by the battery electric taxis during acceleration and deceleration is much lower than that of fuel taxis. Frequent accelerations and decelerations will reduce the stability of the vehicle, thereby affecting the driving safety.
The driving process of the vehicle can be classified into four types of operation states, including acceleration, deceleration, idle speed and constant speed. In this study, the state where the vehicle speed is lower than 5 km/h is regarded as the idle speed [26]. The states where the acceleration and deceleration values exceed the range of (−0.15 m/s2 < a < 0.15 m/s2) and the speed is not zero are considered as the acceleration and deceleration states, respectively. The time ratio of the above three operation states in the driving process of the battery electric taxi is compared with the corresponding states of the fuel taxi, as shown in Figure 4. It can be seen from Figure 4 that the battery electric taxi has higher stability on the arterial road and weekends. The average proportion of acceleration, deceleration and idle time of battery electric taxis is 27%, 24% and 43%, respectively, and the proportion of constant speed time is only 6%. The overall driving stability of battery electric taxis is poor. Figure 4 shows that the average proportion of acceleration, deceleration and idling time of fuel taxis is 23%, 15% and 29%, respectively. Three types of operation state time proportion of battery electric taxis are all larger than those of fuel taxis, indicating that they have less time at constant speed than fuel taxis, and thus the driving status is less stable.
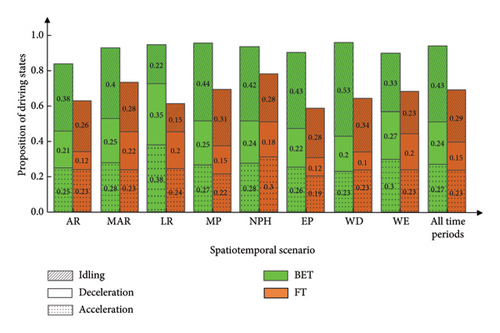
During the weekend, the proportion of acceleration and deceleration time of BEVs is basically the same as the idle time, reflecting that they are in a smooth driving state on weekends with high probability. During weekdays, the acceleration and deceleration time of BEVs is relatively small, and the idle time is the same as the constant speed time, reflecting the congestion situation of BEVs on weekdays. In addition, compared to the operation state of fuel vehicles, BEVs have longer acceleration and deceleration time, and their driving state is more unstable.
4. Combination Weighting VIKOR Method Based on Nash Equilibrium
The operation safety evaluation of battery electric taxis in various spatiotemporal scenarios is a multiattribute decision making problem [27]. For the multiattribute decision making problems, there are common weighting method, ideal point method, contrast coefficient method and so on. Among them, the VIKOR method is a classic multiattribute, multicriteria compromise evaluation and decision-making method. It is also a compromise solution that is closest to the ideal solution, which can provide a compromise solution for discrete multiple indicators [28]. In addition, the VIKOR method can effectively evaluate the situation where conflict and incommensurability exist among the criteria [29]. Therefore, the VIKOR method is adopted to evaluate and rank the operation safety of battery electric taxis in different spatiotemporal scenarios.
Substituted into equation (10) to calculate the combination weight based on the Nash equilibrium. The obtained could effectively coordinate the conflict between the CRITIC method and the entropy weighting method, so as to effectively improve the accuracy of weight calculation for evaluation indicators.
-
Condition 1: Acceptable effectiveness threshold
() -
Where A1 and A2 are the spatiotemporal scenario and corresponding indicators in the first and second Qp ranking, respectively. DQ is the acceptable advantage threshold, when p ≤ 4, DQ = 1/4.
-
Condition 2: Acceptable reliability.
-
As to the best spatiotemporal scenario with the smallest Qp, the corresponding Sq (or Rq) must be smaller than that of the second evaluation object in the Qp ranking.
-
If only Condition 1 is met, then A1 and A2 are the optimal solution among all the evaluated space-time scenarios. If only Condition 2 is met, then A1, A2, …An are all the optimal schemes, where the maximum value of n is determined by Q(An) − Q(A1) < DQ.
5. Modelling Results
A total of 8 driving characteristic indicators from 3 speed performance categories are selected to evaluate the operation safety of battery electric taxis: (1) startup performance including mean acceleration and acceleration frequency; (2) operation performance including driving speed, travel speed, overspeed ratio and overspeed amplitude and (3) braking performance including mean deceleration and deceleration frequency. Table 1 shows the weight coefficients of driving characteristic indicators obtained by using CRITIC method, improved CRITIC method, entropy weighting method and the combination weighting method based on Nash equilibrium proposed in this paper. As can be seen from Table 1, the combination weighting method based on Nash equilibrium can better balance the emphasis of CIRTIC method and entropy weighting method on evaluation indicators, and obtain more reasonable weight coefficients. The weights of driving characteristic indicators based on the proposed combination weighting method differ slightly since the differences from the mean weight are within the range of 0.003–0.450, and the mean value of the differences is only 0.030. The results show that the selected driving characteristic indicators have a balanced influence on the operation safety of battery electric taxis, and also prove that the selected driving characteristic indicators in the study are appropriate.
| Calculation method | Mean acceleration V1 |
Acceleration frequency V2 |
Driving speed V3 |
Travel speed V4 |
Overspeed ratio V5 |
Overspeed amplitude V6 |
Mean deceleration V7 |
Deceleration frequency V8 |
|---|---|---|---|---|---|---|---|---|
| CRITIC method | 0.110 | 0.085 | 0.156 | 0.130 | 0.170 | 0.147 | 0.101 | 0.102 |
| Improved CRITIC method | 0.141 | 0.109 | 0.120 | 0.109 | 0.156 | 0.107 | 0.129 | 0.130 |
| Entropy weighting method | 0.204 | 0.186 | 0.064 | 0.061 | 0.087 | 0.068 | 0.128 | 0.203 |
| Combination weighting method | 0.171 | 0.146 | 0.094 | 0.086 | 0.123 | 0.088 | 0.129 | 0.165 |
Further analyzing the relative importance of the driving characteristic indicators of battery electric taxis, the results show that the objective weights of the four indicators, namely, the mean acceleration, the acceleration frequency, the absolute mean deceleration and the deceleration frequency, are all greater than or equal to the mean weight of 0.125, and the cumulative weight reaches 0.610. Among them, the most influential indicator is the mean acceleration, with a weight of 0.171, which indicates that the excessive acceleration of battery electric taxis will greatly affect the operation safety.
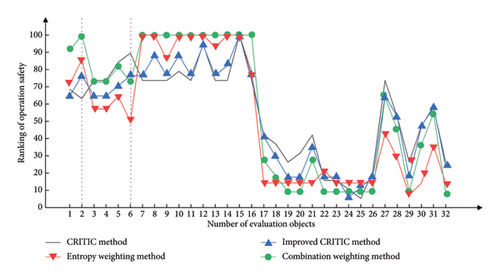
The weight coefficients calculated by various methods are then put into VIKOR method for evaluating and ranking, and results are shown in Figure 5. A total of 16 integrated spatiotemporal scenarios are analyzed and fuel taxis are used to assist in comparative analysis of the operation safety of BEVs . The percentage represents the comprehensive ranking. The higher the percentage, the lower the ranking and the worse the operation safety. The evaluation results of the four methods show that, in all integrated spatiotemporal scenarios, the operation safety of fuel taxis is higher than that of battery electric taxis. The operation safety of fuel taxis on minor arterial roads is higher than that of arterial roads, while that of battery electric taxis is just the opposite.
Therefore, in order to ensure the safety of passengers and road traffic, speed limit management should be implemented for battery electric taxis in time period and road segment with poor safety, so as to improve taxi driver vigilance and regulation awareness, reduce the probability and severity of traffic accidents, and also the potential safety hazards.
Among the four evaluation results, the rankings of battery electric taxis numbered 2 and 6, that is, the nonpeak hour of arterial roads and the morning peak of minor arterial roads have relatively great difference. Among them, the operation safety values calculated by the CRITIC method and improved CRITIC method on the minor arterial roads in the morning peak are better than those on the arterial roads in the nonpeak hour, while the operation safety values calculated by the entropy weighting method and the combination weighting method based on Nash equilibrium are the opposite. In reality, the operation safety of the arterial road during the nonpeak hour is better than that of the minor arterial road during the morning peak.
The combination weighting VIKOR method based on Nash equilibrium comprehensively considers the correlation and discreteness of data, thus obtains a more reasonable ranking results than the CRITIC method and the improved CRITIC method. Compared with the entropy weighting method, the combination weighting VIKOR method based on Nash equilibrium accounts for the correlation of indicators, and reduces the difference between the obtained rankings, and the ranking results are more reasonable. The combination weighting VIKOR method based on Nash equilibrium proposed in the research could effectively evaluate the operation safety of battery electric taxis. Further analysis of the safety evaluation results of battery electric taxis in multiple time and space scenarios are shown in Figure 6.
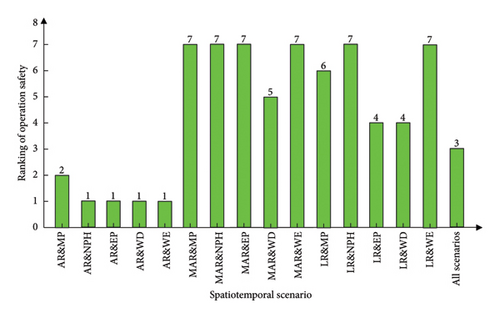
It can be seen from Figure 6, the safety evaluation results of 16 integrated spatial-temporal scenarios of battery electric taxis are divided into 7 levels. In terms of space, the battery electric taxis have the highest operation safety on the arterial roads, while the minor arterial roads and local roads have relatively poor operation safety, especially on weekends. In terms of time, the battery electric taxis are safer on weekdays than on weekends. The overspeed ratio, overspeed amplitude, acceleration and deceleration frequency of battery electric taxis on minor arterial roads and local roads are higher than those on arterial roads. The driving speed and acceleration and deceleration frequency on weekends are higher than those on workdays. The higher the driving speed or the frequency of acceleration and deceleration, the more aggressive the driving behavior, and the worse the corresponding operation safety. In addition, the traffic management level and monitoring facilities of local roads and minor arterial roads are not as good as those of arterial roads, which might also be the key factor leading to speeding and other risk driving behavior.
6. Conclusions
Based on GPS trajectory data from battery electric taxis in Shenzhen, the driving characteristics of battery electric taxis are analyzed using eight speed indicators and compared with traditional fuel taxis. The findings reveal that electric taxis exhibit faster travel speeds, more significant instances of overspeed, frequent acceleration and deceleration, and drivers tend to behave more aggressively in comparison to fuel taxis. To evaluate the operation safety of battery electric taxis in various spatiotemporal scenarios, a combination weighting method named VIKOR is proposed, considering multiple driving characteristic indicators. To address the limitations of the traditional CRITIC weight method, certain improvements are made by replacing standard deviation with average deviation and utilizing absolute values of correlation coefficients to ensure rationality in the weights among different indicators. Entropy weight method is incorporated for combination weighting based on Nash equilibrium. The results indicate that the proposed method provides more reasonable evaluation results compared to alternative methods. These conclusions offer a theoretical basis for the application of different battery types and implications for the formulation of strategies and policies aimed at reducing hazardous driving behaviors in electric vehicles for cities with similar comparable taxi service systems and population dynamics. Furthermore, the findings can assist urban management in enhancing road traffic safety by implementing appropriate speed limits in specific time and space when the operation safety of battery electric taxis is compromised. In the future, it would be beneficial to conduct further in-depth research and exploration on different types of electric vehicles, such as private cars. Also, the driving trajectories of different models would be compared on different roads and in various cities.
Nomenclature
-
- j
-
- The serial number of vehicle (j = 1, 2, …, J)
-
- l
-
- The road segment
-
- m
-
- The mth trajectory point of the vehicle j on the road segment l (m = 1, 2, …, M)
-
- dj
-
- The driving distance of the vehicle j on the road segment l
-
- l
-
- The sampling time of the mth trajectory point of the vehicle j on the road segment l
-
-
- The speed of the vehicle j at the mth trajectory point on the road segment l
-
-
- The travel speed of the battery electric taxi j on the road segment l
-
-
- The average travel speed of all battery electric taxis on the road segment l
-
-
- The travel speed of the fuel taxi j on road segment l
-
-
- The average travel speed of all fuel taxis on road segment l
-
-
- The time when the vehicle enters the road segment l
-
-
- The time when the vehicle leaves the road segment l
-
-
- The driving speed of the vehicle j on the road segment l
-
-
- The average driving speed of all vehicles on road segment l
-
-
- The overspeed ratio of the vehicle j on road segment l
-
- El
-
- The overspeed amplitude on road segment l
-
- q
-
- The qth evaluation indicator
-
- ADq
-
- The mean deviation for indicator q
-
- xpq
-
- The normalized value of the driving characteristic indicator after normalization
-
- P
-
- The total number of spatiotemporal scenarios
-
- Wq
-
- The objective weight of the qth driving characteristic indicator
-
- rpq
-
- The correlation coefficient between the pth spatiotemporal scenario and the qth indicator
-
- Q
-
- The total number of driving characteristic indicators
-
- wq
-
- The objective weight of the qth driving characteristic indicator
-
-
- The entropy weight of the qth driving characteristic indicator
-
- eq
-
- The entropy value of the qth driving characteristic indicator
-
- tpq
-
- The proportion of the qth driving characteristic indicator of the pth evaluation object
-
- wk
-
- The weight matrix (k = 1, 2, …, L)
-
- L
-
- The types of calculation method of indicator weights
-
- μ
-
- The linear combination weight coefficient
-
-
- The optimal combination weight coefficient
-
- wi
-
- The combination weight
-
-
- The optimal combination weight
-
- r+
-
- The positive ideal solution
-
- r−
-
- The negative ideal solution
-
- Sp
-
- The group utility
-
- Rp
-
- The individual regret
-
- Qp
-
- The compromise evaluation of the operation safety of taxis under multiple spatiotemporal scenarios
-
- v
-
- The coefficient of the decision mechanism v ∈ [0, 1]
-
- An
-
- The spatiotemporal scenario and corresponding indicators in the nth Qp ranking
-
- DQ
-
- The acceptable advantage threshold
Abbreviations
-
- VIKOR
-
- VlseKriterijumska Optimizacija I Kompromisno Resenje
-
- CRITIC
-
- Criteria Importance Though Intercriteria Correlation
-
- GPS
-
- Global Positioning System
-
- DDQL
-
- Double Delay Q-Learning algorithm
-
- BET
-
- Battery electric taxis
-
- FT
-
- Fuel taxi
-
- AR
-
- Arterial road
-
- MAR
-
- Minor arterial road
-
- LR
-
- Local road
-
- MP
-
- Morning peak
-
- NPH
-
- Nonpeak hour
-
- EP
-
- Evening peak
-
- WD
-
- Workday
-
- WE
-
- Weekend
Conflicts of Interest
The authors declare no conflicts of interest.
Funding
The research was supported by the National Natural Science Foundation of China (Grant No. 72371017). Additional funding was provided by the Laboratory of Transport Pollution Control and Monitoring Technology, Data-Driven Dynamic Calculation of Energy Consumption and Carbon Emissions of Multiple Types Vehicles in Road Network Environment (Grant number (2022) JH-F041).
Acknowledgments
Additional funding was provided by the Laboratory of Transport Pollution Control and Monitoring Technology, Data-Driven Dynamic Calculation of Energy Consumption and Carbon Emissions of Multiple Types Vehicles in Road Network Environment (Grant number (2022) JH-F041).
Open Research
Data Availability Statement
The data of this study can be requested from the corresponding author.


