Evaluating Impacts of Public Transit and Automobiles During Connected and Automated Vehicle Adoption
Abstract
The adoption of connected and automated vehicles (CAVs) and automated vehicles (AVs) is expected to improve overall travel efficiency in traffic networks. However, this improvement may vary across multimodal road traffic, influencing the equity of travel experiences among different income groups. This study evaluates the equity effects of AV deployment during its gradual adoption in public transit and automobiles. Five scenarios with varying penetration rates are designed to represent the transition from HVs to CAVs in public transit and automobiles. Different model parameters were calibrated to represent HVs, AVs, and CAVs, and four measurements of effectiveness were developed to compare travel experiences between high-income individuals, who primarily rely on private automobiles, and low-income individuals, who depend on public transit. A detailed case study was conducted using real-world road network and traffic flow data from Madison, Wisconsin. Simulation results reveal that while AV adoption improves overall traffic efficiency, including nonupgraded vehicles, it also exacerbates disparities in travel performance between high- and low-income groups, even with efforts to expand AV-enabled public transit.
1. Introduction
Connected and automated vehicle (CAV) and automated vehicle (AV) technologies have gained considerable attention in recent years due to their potential to bring benefits to various aspects of society [1, 2]. Numerous studies have explored the potential impacts of the AV on urban transportation, focusing on accessibility [3], mobility [4, 5], energy efficiency [6, 7], and safety [8–10]. However, these impacts can vary significantly depending on how and where AVs are deployed. For instance, deploying AVs in fixed-route public transit systems may have different impacts compared to their deployment in more flexible automobiles. When such differences affect income groups unequally, they can raise equity concerns. Therefore, understanding the distributional effects of AV deployment is crucial to ensure equitable sharing of AV benefits among income groups.
Some studies in the literature have explored the potential impacts of AVs by discussing the conceptual effects of AV adoption across different population groups. For instance, Alessandrini et al. [11] noted that shared AVs could improve accessibility for residents in areas with limited transportation services. Similarly, Fagnant et al. [12] suggested that AV deployment could enhance mobility for the elderly, individuals with disabilities, and children. When examining pricing schemes for shared AVs, Chen and Kockelman [13] observed that models yielding higher revenue-to-cost ratios tend to favor travelers with a high time value, potentially benefiting higher-income groups. The challenge of balancing equitable access with revenue generation is likely to grow as private companies increasingly handle transportation demand. Additionally, Chen and Kockelman [13] explored equity in electric vehicle infrastructure, highlighting the importance of fair access to charging stations. Reference [14] argued that, without supportive regulatory policies, AVs could exacerbate existing transportation barriers for low-income and minority populations. During the AV adoption period, issues surrounding access to AV-related mobility and safety benefits raise further equity concerns.
Despite extensive discussions, only a few studies have attempted to quantitatively examine the impact of this new technology using specific regional data and case studies. Reference [15] presented a regional travel demand model to quantify how transportation outcomes may differ for disadvantaged populations in the Washington, D.C., area under various future scenarios. The results showed that the high occupancy AV and enhanced transit scenarios provide equity benefits, either by mitigating an existing gap in the outcomes between the demographic groups or reducing the extent to which that gap expanded. Reference [16] analyzed the equity implications of Automated Mobility-on-Demand (AMoD) in three full-scale prototype cities using SimMobility. Their results indicated that equity-oriented outcomes can be achieved in large, densely populated, transit-oriented cities due to high mass transit usage, which suppresses car usage and limits induced demand for AMoD. Reference [17] used data from a travel demand model to evaluate the change in accessibility brought by shared AV services in Dallas-Fort Worth. Results suggested that the access benefits of shared AVs are higher in neighborhoods with more vulnerable populations, though some groups (e.g., individuals over age 65) experience lower levels of access improvement. Reference [18] developed and demonstrated a modeling framework to support distributional equity assessments of AV systems. A case study conducted for the Tampa Bay region revealed that high AV penetration rates are required for substantial reductions in inequality. For further details on the equity impacts and quantification methods, see the review in reference [19].
- •
Analyzing the disparities in travel experiences across multimodal traffic during the adoption of AV technologies and quantifying the associated equity impacts among different income groups.
- •
Developing a simulation-based modeling framework that incorporates five scenarios representing the gradual penetration of AVs into multimodal traffic, with calibrated behavior models for different vehicle types (HVs, AVs, and CAVs) and four refined measurements of effectiveness (MOEs).
- •
Conducting simulation experiments using empirical geographic and traffic data to evaluate the impacts and validate the framework.
The remainder of this paper is organized as follows. Section 2 describes the modeling and analysis methodology. Section 3 shows the results of the case study and discussions. Section 4 concludes this paper and provides future work.
2. Materials and Methods
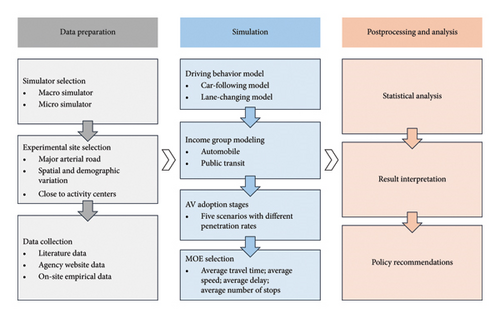
This section introduces the modeling framework used for AV regional impact analysis. Figure 1 presents the flowchart of the proposed simulation-based analysis framework. The framework consists of three main steps: data preparation, simulation, and postprocessing and analysis. The data preparation stage involves selecting an appropriate simulator, identifying the experimental site, and gathering all necessary data for the case study. The simulation stage includes modeling the driving behaviors of HVs, AVs, and CAVs, distinguishing income groups, defining AV adoption stages, and selecting relevant MOEs. The postprocessing and analysis stage focuses on using statistical tools to analyze simulation results, interpreting findings based on domain knowledge, and ultimately providing policy recommendations for regional development. This section mainly focuses on the first two stages, while the result analysis methods are detailed in the experimental section.
2.1. Simulator Selection
A common approach to conducting a case study in transportation research is to utilize simulation software to analyze complex traffic conditions. In the literature on regional impact analysis of AVs, these simulators can be broadly categorized into macroscopic and microscopic tools. Macroscopic simulators, such as VISUM [25], TransCAD [1, 3], and MATSim [12, 18] are often used for transportation and urban planning. In contrast, microscopic simulators, such as VISSIM [6, 8] and SUMO [26], incorporate more detailed features. These include customizable vehicle behavior models, differentiation between public transit and private automobiles, and the simulation of signal interactions.
Table 1 summarizes recent studies that use specific regional data and case studies to analyze the impacts of AVs, with a focus on the simulation software adopted. Overall, the choice of the simulator often depends on the specific objectives of the study. For example, when analyzing mixed traffic flows involving vehicles with different automation technologies, microscopic simulators like VISSIM are well-suited due to their flexibility in adjusting behavior model parameters, which we will mention in the following sections.
| Authors | Software | Simulation scale | Simulation level |
|---|---|---|---|
| [1] | TransCAD | Austin, TX, USA | Macro |
| [3] | TransCAD | Counties of Imperial, Los Angeles, Orange, Riverside, San Bernardino, and Ventura | Macro |
| [12] | MATSim | Austin, TX, USA | Macro |
| [18] | MATSim | Tampa Bay region, FL, USA | Macro |
| [25] | VISUM | Halle, Germany | Macro |
| [26] | SUMO | 3 roadways in Columbus, Ohio, USA | Micro |
| [6] | VISSIM | A 4 km expressway | Micro |
| [8] | VISSIM | A 5 km tangent freeway | Micro |
| This paper | VISSIM | A 5 km urban road | Micro |
Given that this study aims to analyze the detailed interactions between automobiles and public transit, and to incorporate localized features of the case study region, a microscopic simulation framework is adopted. Among the available options, we select VISSIM, a widely used and validated platform for traffic microsimulation. VISSIM is a versatile software package that models the full range of roadways and public transportation operations across various functional classifications. As a time-step and behavior-based microscopic traffic simulation tool, VISSIM accurately captures complex traffic dynamics by considering lane configurations, vehicle compositions, signal timings, and other key factors. The software employs a psycho-physical driver behavior model that closely replicates real-world driving patterns [27].
2.2. Experiment Site Selection and Data Collection
The selection of the experiment site follows a set of criteria designed to ensure both transportation representativeness and demographic diversity. Specifically, the site should include (1) major arterial roads with significant traffic volumes and multimodal infrastructure, including established public transit services; (2) spatial and demographic variation in income levels, age groups, and racial composition to support equity-focused analysis; and (3) relevance to real-world transportation planning challenges, such as proximity to activity centers (e.g., universities and employment hubs) that generate diverse travel demand. These criteria ensure that the selected area can reflect a range of mobility needs and enable meaningful analysis of the impacts of AV adoption on different population groups.
- •
Academic literature and technical documentation: For general traffic behavior parameters that are not location-specific, such as those related to AV, public transit, and vehicle behavior models, data can be drawn from published academic studies and simulation model documentation. These sources provide standardized and validated values applicable across a wide range of contexts.
- •
Publicly available datasets from transportation agencies: For region-specific but systematically collected data, such as traffic demand, vehicle volumes, and infrastructure attributes, official data portals and open-access government repositories serve as reliable sources. These datasets typically originate from transportation departments or municipal agencies and reflect aggregate-level conditions within the study area.
- •
Empirical on-site or map-based data collections: For detailed spatial or operational characteristics that are not consistently reported by public agencies, such as road geometry, signal locations, and transit stop placements, data can be extracted through a combination of field observation, aerial imagery, and digital mapping tools. These sources are essential for accurately reconstructing local transportation networks within the simulation.
2.3. Driving Behavior Models
Car-following and lane-changing are the two most common driving behaviors in traffic systems. In microscopic traffic simulation tools, car-following and lane-changing models are used to reflect real-world vehicle behaviors. While the former calculates a vehicle’s longitudinal acceleration, the latter determines whether a vehicle should switch lanes based on the speed and positions of surrounding vehicles. By adjusting these models and their parameters in the simulator, we can accurately model different vehicle behaviors.
As mentioned earlier, this study uses VISSIM as the simulation platform. VISSIM offers two default car-following models: Wiedemann 74 and Wiedemann 99. Compared to Wiedemann 74, Wiedemann 99 provides more adjustable parameters and assumes a linear relationship between speed and following distance, modeled as a constant time headway plus standstill distance. Additionally, Wiedemann 99 allows vehicles to maintain their exact desired speed when not influenced by a leading vehicle, making it more suitable for simulating AVs [28]. PTV defines three AV driving behaviors: AV-ALL-Knowing, AV-Normal, and AV-Cautious [29]. AV-ALL-Knowing represents more aggressive driving behavior, where AVs operate with smaller thresholds for minimum distance, higher acceleration, and greater deceleration, reflecting a highly efficient and cooperative driving style. AV-Cautious represents cautious driving behavior, and AV-Normal represents standard driving behavior. The AV-Normal mode represents standard driving behavior characterized by parameters set to average values. This study focuses on a mixed traffic environment involving two types of vehicle automation technologies: AV and CAV, along with HVs. In this study, AVs refer to vehicles that operate autonomously using only onboard perception systems. CAVs are AVs further equipped with V2X communication capabilities, allowing access to infrastructure data and other agents’ driving intentions for enhanced decision making [30]. To represent the driving behaviors of each type, we adopt the AV-ALL-Knowing and AV-Normal parameter settings to model CAVs and AVs, respectively. We keep the original parameter settings in VISSIM for HVs. Detailed parameter values for the Wiedemann 99 model are provided in Table 2.
| Parameters | Description | HV | AV | CAV | Unit |
|---|---|---|---|---|---|
| CC0 | Desired distance between lead and following vehicles | 1.5 | 1.5 | 1.0 | m |
| CC1 | Headway time desired time between lead and following vehicles | 0.9 | 0.9 | 0.6 | s |
| CC2 | Following variation additional distance over safety distance that a vehicle requires | 4 | 0 | 0 | m |
| CC3 | Threshold for entering to “following” state time in seconds before a vehicle starts to decelerate to reach safety distance (negative) | −8 | −8 | −6 | s |
| CC4 | Negative “following threshold” specifies variation in speed between lead and following vehicles | −0.35 | −0.1 | −0.1 | m/s |
| CC5 | Positive “following threshold” specifies variation in speed between lead and following vehicles | 0.35 | 0.1 | 0.1 | m/s |
| CC6 | Speed dependency of oscillation | 11.44 | 0 | 0 | m−1·s−1 |
| CC7 | Oscillation acceleration: Acceleration during the oscillation process | 0.25 | 0.1 | 0.1 | m/s2 |
| CC8 | Standstill acceleration | 3.5 | 3.5 | 4.0 | m/s2 |
| CC9 | Acceleration with 80 km/h | 1.5 | 1.5 | 2.0 | m/s2 |
Similarly, VISSIM distinguishes the lane-changing models between necessary lane changes and free lane changes. The necessary lane changes happen when reaching the next connector of the route and free lane changes happen if more space is available on the new lane or if longer driving at the desired speed is required. Key parameters for these models such as safety distance reduction factor and maximum deceleration for cooperative braking can be used to differentiate HV, AV, and CAV. Since PTV does not provide example lane-changing parameters for AVs, we used the parameters from [31], which are collected by Goudappel in the Netherlands. The details for the parameters can be found in Table 3.
| Parameter | HV | AV | CAV | Unit |
|---|---|---|---|---|
| Maximum deceleration (own) | −4 | −4 | −4 | m/s2 |
| Maximum deceleration (trailing vehicle) | −3 | −3 | −4 | m/s2 |
| −1 m/s2 per distance (own) | 200 | 100 | 100 | m |
| −1 m/s2 per distance (trailing vehicle) | 200 | 100 | 100 | m |
| Accepted deceleration (own) | −1 | −1 | −1 | m/s2 |
| Accepted deceleration (trailing vehicle) | −0.5 | −1 | −1.5 | m/s2 |
| Safety distance reduction factor | 0.6 | 0.6 | 0.75 | NA |
| Maximum deceleration for cooperative braking | −3 | −3 | −9 | m/s2 |
2.4. Modeling Income Groups and AV Adoption Stages
Understanding the travel behaviors of different income groups is essential for analyzing the impact of AVs on socioeconomic equity. Studies have shown that the low-income group, such as students and freelancers, often depends on public transportation, as the costs of owning and maintaining a private vehicle are prohibitive [24]. As a result, they tend to live near transit hubs to reduce walking distances to stations. In contrast, high-income individuals typically own automobiles, which provide greater flexibility and convenience [23]. Our model captures these distinct behaviors to better represent the socioeconomic factors influencing travel decisions. Two types of vehicles were defined in the simulation environment, automobiles and buses, to represent the typical travel modes of high-income and low-income groups, respectively. Automobiles were modeled using VISSIM’s default vehicle class. For buses, we utilized VISSIM’s dedicated public transit simulation tools. Bus vehicles were configured under a specific vehicle class with customized parameters for length, acceleration, and desired speed distributions, distinct from passenger cars. Transit lines were implemented using VISSIM’s “Public Transport Line” and “Stop” features, allowing for the precise control of route paths, dwell times, headways, and boarding/alighting behavior.
Another important consideration is the penetration rate of AVs. When AVs are initially introduced, their high prices may make them inaccessible even to some high-income individuals. However, public transportation, largely funded by the government, can more readily adopt the latest technologies. Therefore, this study considers different AV penetration rates to simulate multiple development stages of the AV technology. Additionally, the distinctions within the high-income group can be modeled by varying penetration rates, where some individuals can afford AVs while others cannot upgrade and continue using AVs. Existing studies have shown that when the penetration rate of AVs reaches approximately 30%, a noticeable improvement in traffic flow performance can be observed [32]. Building on this insight, and considering that our study involves three types of vehicles, HVs, AVs, and CAVs, we define five scenarios based on different levels of AV adoption centered around the 30% threshold. Furthermore, recognizing that a complete transition to 100% AV penetration remains unlikely in the near future, we include an additional scenario based on a more realistic projection. According to estimates by the U.S. Department of Transportation, AV penetration may reach approximately 85% by the year 2040 [33]. Therefore, this study evaluates five scenarios: Scenario 1 represents a fully human-driven environment with no AV presence; Scenario 2 corresponds to the early introduction of AVs; Scenario 3 reflects the 30% AV threshold observed in prior studies; Scenario 4 models a widespread but not yet complete AV deployment; and Scenario 5 assumes a fully automated traffic system. The detailed vehicle-type penetration rates for each scenario are provided in Table 4. In the experimental section, we will compare the travel outcomes for the two income groups across these five scenarios.
| Scenario | Transit mode | HV (%) | AV (%) | CAV (%) |
|---|---|---|---|---|
| Scenario 1 | Public transit | 100 | 0 | 0 |
| Automobile | 100 | 0 | 0 | |
| Scenario 2 | Public transit | 0 | 100 | 0 |
| Automobile | 70 | 30 | 0 | |
| Scenario 3 | Public transit | 0 | 0 | 100 |
| Automobile | 0 | 70 | 30 | |
| Scenario 4 | Public transit | 0 | 0 | 100 |
| Automobile | 0 | 15 | 85 | |
| Scenario 5 | Public transit | 0 | 0 | 100 |
| Automobile | 0 | 0 | 100 | |
2.5. MOEs
- •
Average travel time: This metric represents the mean time spent by vehicles within the simulation network during the simulation period, reflecting overall network efficiency. Higher values indicate increased congestion or longer travel durations. While VISSIM provides only the total travel time, the average travel time can be calculated based on the number of vehicles of each type in the network for a fairer comparison.
- •
Average speed: The average speed is the mean travel speed of all vehicles in the network, calculated by dividing total travel distance by total travel time. Higher values suggest smoother traffic flow.
- •
Average delay time per vehicle: As defined in HCM 2000 [34], delay includes both stop delay and acceleration/deceleration time (start-up loss). In VISSIM, the delay is calculated by subtracting the ideal travel time from the actual travel time and then averaging it across all delayed vehicles within one or more road segments or intersections [35].
- •
Average number of stops per vehicle: This metric measures the average number of times a vehicle stops during its journey in the simulation network. A stop occurs whenever a vehicle’s speed drops to zero due to traffic conditions or control measures such as signals. Fewer stops indicate smoother traffic flow and more efficient operations.
Since the goal is to compare the travel efficiency of public transit and automobiles, an essential factor for public transit is the time residents spend traveling from their homes to transit stations and the waiting or queuing time. Therefore, for public transit, we calculate the average travel time by dividing the total travel time by the number of vehicles and then adding a constant tc to account for these additional factors.
- •
Numerical comparison of MOEs across the five scenarios.
- •
Changes in travel efficiency relative to the baseline scenario with only HVs (Scenario 1).
- •
Performance differences between the two travel modes.
These three perspectives provide a comprehensive evaluation of the impact of AVs on both income groups.
3. Results and Discussion
3.1. Experiment Area
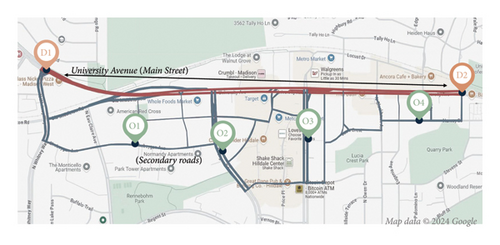
As shown in Figure 2, the case study focuses on University Avenue, the primary east-west arterial corridor in Madison, Wisconsin, and its connecting secondary roads. This corridor was selected due to its critical role in the city’s transportation network. University Avenue accommodates substantial traffic volumes, with an average weekday traffic count of approximately 30,000 vehicles, and is supported by a well-developed multimodal transit system, including local buses and the recently implemented bus rapid transit infrastructure. The corridor features multiple signalized intersections, designated transit lanes, and pedestrian crossings, making it representative of complex urban traffic environments.
In addition to its transportation significance, the study area exhibits diverse socioeconomic and demographic characteristics. The corridor runs adjacent to the University of Wisconsin–Madison campus and includes a high concentration of apartment housing, attracting a large student population. Public transit serves as the primary travel mode for many of these residents. According to recent census data [36], approximately 40% of residents are between the ages of 20 and 29, and nearly half of all households report annual incomes below $50,000. These features make University Avenue an ideal setting for evaluating equity-related outcomes, particularly in terms of mobility access and the distributional impacts of emerging transportation technologies across income groups.
3.2. Experimental Setting
- •
Four origins of apartments and houses were selected in densely populated residential areas. Two destinations were chosen at the endpoints of the main road, as shown in Figure 2.
- •
The locations of public transit stations were selected based on real-world data. To simplify the simulation model, we only consider public transit operating on the major road, while automobiles can travel on both major and secondary roads, as shown in Figure 2. This simplification does not affect the simulation results, as automobiles offer more flexible route choices compared to public transit with fixed routes.
- •
The desired speed distributions were derived from the speed limits of each road segment in real life, following a normal distribution. This ensures that vehicle speeds are generally centered around the speed limits, with natural fluctuations reflecting real-world conditions.
- •
Vehicle input settings in VISSIM represent traffic volume per hour, calculated by dividing daily traffic counts by 24. The traffic count data were obtained from the WisDOT open data website (https://data-wisdot.opendata.arcgis.com/), which shares Geographic Information System datasets with the public. For the missing data, we used the K-nearest neighbors algorithm [37] to estimate traffic counts.
- •
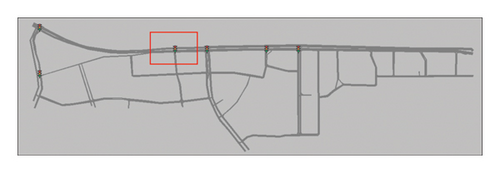
Stop signs and signal heads were configured according to real conditions in Madison. The traffic signal timings were set as follows: red light for 30 s, green light for 45 s, and yellow light for 3 s. The locations of signal heads are shown in Figure 3. The rectangle part will be taken as an example area to show the traffic performance under five scenarios.
- •
The additional time was estimated as 6 min, based on the walking time from low-income residential areas to public transit stations as calculated by Google Maps.
Figure 3 illustrates the details of the simulation area in VISSIM. Figure 3(a) provides an overview map of the study area in VISSIM, highlighting the locations of traffic lights. Figure 3(b) shows the detailed setup of a T-intersection, which is marked by the rectangle in Figure 3(a). In Figure 3(b), white dashed lines divide the lanes, while yellow dashed lines and arrows indicate turning directions. Figure 3(c) presents examples of visualization results for the five scenarios.

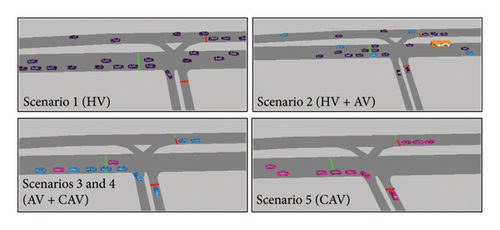
The specific version of the VISSIM simulator we used is PTV VISSIM 4.3. For each scenario, we run the simulation five times and use the average value of each metric for comparison. All experiments were conducted on a machine equipped with a 3.2 GHz AMD Ryzen 7 7735HS with Radeon Graphics CPU and 16 GB of memory, running the Windows 11 operating system. The project files and data processing code are publicly available at https://github.com/zll-hust/AV_Equity.
3.3. Experiment Results
In this section, we show the results of the comparison methods mentioned in Section 2.4 between public transit and automobiles. Note that in this section, all speed units are converted to kilometers per hour and time units to minutes.
Table 5 presents the detailed results from the simulation. In the initial Scenario 1, the overall performance of public transit is slightly worse than that of automobiles. Although public transit performs better in terms of delay time and the number of stops, automobiles achieve higher average speeds and shorter average travel time. This is due to two main reasons: first, the locations of destinations make main roads more congested than minor roads, allowing faster travel speeds for automobiles compared with public transit; second, the travel time for public transit accounts for the additional time passengers spend walking from their starting points to transit stations and waiting at stations. However, as the AV penetration rate increases to the level of Scenario 5, automobiles demonstrate significantly better performance across multiple metrics compared to public transit. One reason for this is that the fixed time spent walking to transit stations does not improve even when public transit upgrades to AVs. This suggests that with the advancement of AV technology, high-income groups are likely to gain greater benefits in terms of accessibility and mobility.
| Measurements | Transit mode | Scenario 1 | Scenario 2 | Scenario 3 | Scenario 4 | Scenario 5 |
|---|---|---|---|---|---|---|
| Average travel time | Public transit | 11.775 | 11.285 | 10.690 | 10.340 | 10.220 |
| Automobile | 9.714 | 6.507 | 5.583 | 5.142 | 4.844 | |
| Average speed | Public transit | 16.551 | 18.049 | 19.932 | 20.612 | 20.842 |
| Automobile | 19.221 | 23.831 | 27.760 | 28.861 | 29.206 | |
| Average delay time per vehicle | Public transit | 4.263 | 3.590 | 2.943 | 2.891 | 2.849 |
| Automobile | 4.662 | 2.680 | 2.219 | 2.162 | 2.114 | |
| Average number of stops per vehicle | Public transit | 9.500 | 9.400 | 6.300 | 6.200 | 6.100 |
| Automobile | 13.177 | 12.229 | 11.210 | 10.612 | 10.494 | |
To validate the consistency between our simulation results and real-world conditions, we collaborated with an anonymous company to obtain vehicle telematics data from vehicles operating in the Madison area. Vehicle telematics data refer to vehicle-generated information collected through onboard sensors and communication systems, typically including GPS trajectories, speed profiles, and time-stamped movement data [38]. Our data capture vehicle trajectories along the study corridor, with an estimated market penetration rate of approximately 5%–7%. Based on the analysis of this dataset, the observed average speed of vehicles on the targeted road segment is approximately 18.309 m/s. This value differs by only 4.7% from the simulated average speed of automobiles in Scenario 1, which falls within a 5% margin of error. This close agreement indicates that the simulation results are well aligned with actual traffic conditions, supporting the validity of our model.
- 1.
As the penetration rates of AVs increase, the performance of both public transit and automobile systems improves. This indicates that AV technology can effectively enhance the mobility of transportation systems. Moreover, the improvement shows a trend of diminishing marginal returns, as most curves exhibit patterns resembling convex or concave functions.
- 2.
The impact of AV technology on public transit and automobile systems differs. From Scenario 1 to Scenario 5, automobiles achieve an improvement of nearly 50% across most metrics, whereas the improvement for public transit ranges between 10% and 40%. The only exception is the metric “average number of stops per vehicle,” which shows an irregular trend. A possible explanation is that during the simulation, vehicles on minor roads, where many stop signs exist, are allowed. In this study, we did not account for the potential improvements AV technology could bring to stop signs. In reality, with vehicle-to-vehicle communication capabilities, intersection control methods could evolve from traditional stop signs to approaches that do not require stopping. Thus, this metric requires further validation through more complex simulations.
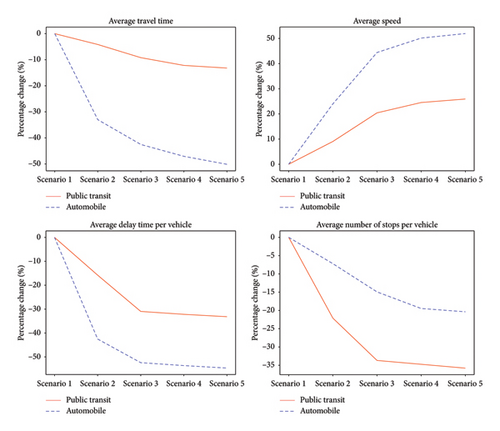
Overall, the introduction of AV technology has a more significant positive impact on automobile systems. From an equity perspective, this suggests that the efficiency gap between low-income and high-income groups may widen further, potentially exacerbating inequities in mobility benefits.
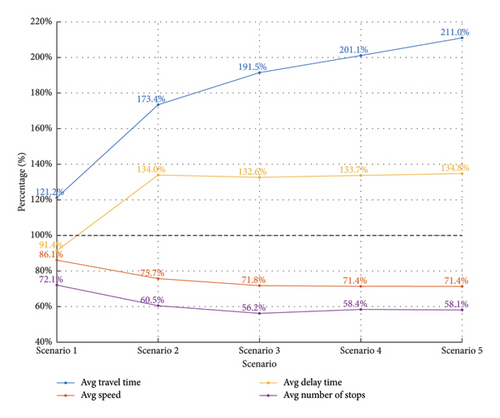
To further compare the travel efficiency of public transit and automobile modes, Figure 5 illustrates the changes in the differences between four MOEs across the five scenarios. Similar to the previous analysis, the largest gaps between the two transit modes are observed in average travel time and average speed, with the differences increasing as AV adoption expands. In contrast, the differences in average delay time and average number of stops are relatively smaller and exhibit less variation across the scenarios. Overall, the efficiency gap between public transit and automobile modes widens progressively from Scenario 1 to Scenario 5.
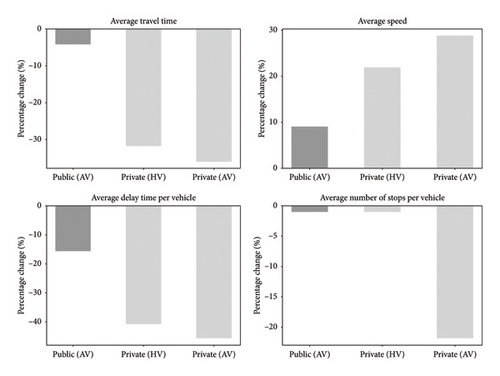
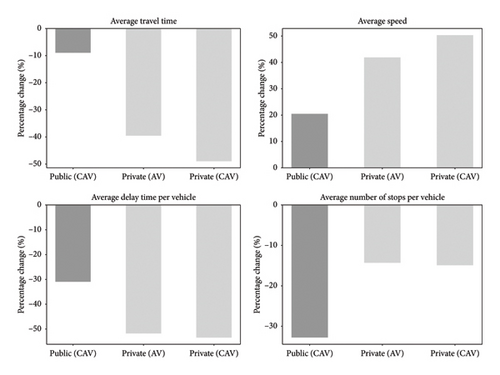
In the five scenarios we designed, both Scenario 2 and Scenario 3 include a mix of cars at different levels of technological development. An interesting comparison is to evaluate the improvement of different types of vehicles relative to the baseline scenario. As expected, public transit, which is quickly updated with the latest technologies, might achieve greater efficiency improvements compared to certain automobile users who do not update their vehicles as promptly. Figure 6 illustrates the improvement levels of public transit and the two types of automobiles in Scenario 2 and Scenario 3 relative to the baseline scenario. Contrary to our expectations, the results show that both types of automobile users experience significantly greater improvements than public transit. This suggests that even if some private cars are not upgraded to AVs or CAVs, the introduction of partial AVs can still significantly enhance the overall efficiency of the transportation system. The outcome corresponds with those who pointed out that the HV-AV pair would have better traffic performance than the HV-HV pair.
3.4. Discussion
The results of this study yield several important implications for transportation policymakers and urban planners. First, the observed improvements in system-wide mobility as the penetration rate of AVs increases suggest that AV technology holds considerable promise for enhancing transportation efficiency. This finding aligns with the conclusions of many prior studies [11, 12, 39]. However, the diminishing marginal returns identified in the analysis indicate that the benefits of AV deployment may weaken at higher adoption levels. This finding suggests that policymakers should adopt a phased and cost-effective AV deployment strategy.
Second, the unequal distribution of mobility benefits across income groups raises concerns about potential equity challenges. This finding is consistent with prior research suggesting that AV adoption may disproportionately benefit higher-income individuals, who are more likely to experience improvements in accessibility and travel time savings [15, 18]. This disparity may further disadvantage low-income populations and disadvantaged communities by increasing their exposure to negative externalities such as traffic collisions, noise, and air pollution. To mitigate these risks, policymakers should consider implementing equity-oriented strategies, such as providing subsidized access to AV-enabled public transit services for low-income users, prioritizing AV deployment in underserved areas, and applying dynamic pricing mechanisms to ensure equitable access to emerging technologies. However, some studies also show that the equity impacts of AV deployment can vary significantly on the urban scale, particularly due to differences in public transit dependence among local populations [16]. These findings highlight the need for localized assessments to support policymaking.
Finally, the finding that partial AV adoption already contributes significantly to system performance underscores the value of mixed-fleet strategies. Rather than requiring full AV deployment, governments may focus on facilitating the gradual integration of AVs into existing traffic systems, supported by regulatory frameworks, safety guidelines, and pilot programs. Such an approach allows cities to manage uncertainty while still capturing the early benefits of automation, thereby supporting a more inclusive and adaptive transition toward future mobility.
4. Conclusion
The adoption of CAV technologies is anticipated to enhance overall traffic efficiency in road networks, but the benefits may not be equitably shared across income groups. This study evaluates the equity implications of varying impacts on travel experiences among different groups as transportation systems transition from HV-dominated to AV-dominated compositions. A simulation-based modeling framework was developed based on empirical geographic and statistical data to assess these impacts, incorporating five scenarios representing the gradual penetration of AVs into multimodal traffic. Driving behavior differences among HVs, AVs, and CAVs were modeled through calibrated car-following and lane-changing parameters. Income groups were categorized based on their reliance on public transit or automobiles, with penetration rates adjusted to reflect different AV adoption stages. Four refined traffic performance metrics were employed to measure the impacts, while equity implications were analyzed through three comparative approaches. A case study of Madison’s main road revealed that AV adoption improves overall traffic efficiency but with diminishing marginal returns for both public transit and automobiles. Furthermore, it widens the disparity in travel performance between low- and high-income groups, even when efforts are made to improve access to AV-enabled public transit for lower-income populations. This disparity is largely driven by challenges such as limited station coverage and persistent congestion on main roads, which hinder the full realization of AV benefits. Additionally, simulation results indicate that while AV adoption improves the traffic efficiency of nonupgraded vehicles by enhancing overall network mobility, this unintended benefit may further exacerbate inequities, increasing the gap between middle- and high-income groups and their lower-income counterparts. Although the conclusions of this study are drawn from a case study based on Madison, the proposed modeling framework is designed to be generalizable and adaptable to other urban contexts. By adjusting the simulation inputs to reflect local transportation infrastructure, population characteristics, and AV adoption scenarios, policymakers and planners in other regions can apply this framework to assess the potential impacts of AV technologies in their cities. This flexibility enables the development of context-specific strategies that align with regional mobility goals, infrastructure readiness, and equity considerations.
While this study highlights the equity challenges posed by AV deployment, it is important to note that the results may vary with changes in simulation settings. One limitation of this study is the relatively small size of the simulated area compared to city-scale simulations. This limitation arises because the model incorporates detailed road features, such as lanes, traffic signals, and vehicle behaviors at intersections. Scaling up simulations with such detailed settings requires significantly more computational resources. Moreover, simulation outcomes may differ based on urban characteristics, such as population density, with denser cities like New York potentially exhibiting different patterns from smaller cities like Madison. Future research could address these limitations by integrating AI algorithms to generate detailed maps for diverse urban environments, enabling more comprehensive analyses of AV impacts. Additionally, since our findings highlight the potential equity challenges posed by AVs, further studies should explore strategies to enhance AV-enabled public transit services. One possible approach is to redesign the locations and densities of transit stations to better align with AV capabilities. Expanding AV-enabled transit networks and implementing policies, such as flexible bus lane strategies, may also help. For example, during peak hours, transit lanes could be prioritized for buses, while allowing automobiles to access them during off-peak periods. These new strategies can be evaluated using the framework proposed in this study to assess their impact on equity. Furthermore, as AVs continue to incorporate a broader range of functionalities beyond basic car-following and lane-changing behaviors, future work could explore more comprehensive and realistic AV behavioral models. Incorporating advanced perception, decision-making, and cooperative driving mechanisms into the simulation framework could improve the accuracy and applicability of the results in more complex traffic environments.
Conflicts of Interest
The authors declare no conflicts of interest.
Funding
No funding was received for this manuscript.
Open Research
Data Availability Statement
The data that support the findings of this study are openly available in AV-Equity at https://github.com/zll-hust/AV-VISSIM.


