Sperm Quality, Seminal Characteristics, and Their Relationship in the Bulatmai Barbel (Luciobarbus capito) Following First and Second Stripping During the Breeding Season
Abstract
The present study investigated the effects of multiple sperm collections on sperm quality, seminal plasma ionic and biochemical parameters, and the relationship between measured variables in the Bulatmai barbel (Luciobarbus capito) during the breeding season. For this purpose, the sperm of males (n = 10) with a mean body weight of 1761.5 ± 385.3 g and an average total length of 55.6 ± 2.8 cm were collected through the first and second stripping process at a 1-week interval. According to the results, sperm quality parameters, including sperm volume (SV), spermatocrit, spermatozoa concentration, total sperm production (TSP), and total motility (%) significantly decreased at the second sperm sampling (p < 0.05). The seminal plasma from the first sperm sampling had higher cholesterol and sodium levels (p < 0.05). Besides, the osmolality of the first stripping was notably higher than comparison of the second stripping (p < 0.05). The first and second strippings revealed significant correlations among SV–TSP, spermatocrit–TSP, spermatocrit–spermatozoa concentration, and TSP–spermatozoa concentration. Unique correlations include motility percentage–motility duration (MD), glucose-calcium (negative), glucose–MD, cholesterol–potassium, and triglyceride–magnesium in the first stripping and SV–MD, SV–spermatozoa concentration, spermatocrit–MD, TSP–MD, and total protein-osmolality in the second. The results of this study recommend that a single stripping method could be more suitable for controlled reproduction programs of Bulatmai barbel males at the hatchery centers to ensure optimal sperm viability and enhance reproductive success.
1. Introduction
Bulatmai barbel (Luciobarbus capito) belongs to the Cyprinidae family and is mainly found in the inland rivers of the southern Caspian and Aral Seas [1, 2]. This species exhibits a bimodal migratory behavior in the Caspian Sea; some individuals live in the sea and migrate into rivers for spawning, while others remain in their origin rivers throughout their life cycle [1]. According to previous studies [1, 3, 4], the Bulatmai barbel reaches peak reproductive condition around April in natural environments, at a water temperature of 19–23°C. This fish is classified as a vulnerable species [5] due to habitat degradation, overfishing, and river pollution, which have severely impacted its spawning grounds. Meanwhile, it can be considered a significant economic fish with high potential for aquaculture due to its wide feeding habits, rapid growth, saline–alkali resistance, and tender, delicious meat [6]. Currently, by recognizing ecological vulnerability and promising aquaculture traits, the Iranian Fisheries Organization is actively trying to develop an artificial reproduction protocol in order to assess the feasibility of aquaculture of this valuable species in the southern Caspian Sea basin. To ensure the success of these efforts, sustainable aquaculture practices are essential, particularly through implementing broodstock management strategies. In this regard, broodstock management can be considered a critical component of sustainable aquaculture to produce high-quality gametes for restocking and commercial aquaculture programs of the Bulatmai barbel endangered populations.
Sustainable controlled reproduction depends on effective broodstock management, while the latter needs to take into consideration the biological limitations of sperm collection strategies [7, 8]. Multiple stripping in aquaculture is one strategy that can maximize sperm availability to advance sustainable reproduction [9–11]. The efficiency of this method has been reported in a wide variety of species, including common carp Cyprinus carpio [9, 11, 12], pikeperch Sander lucioperca [10], mrigal carp Cirrhinus mrigala [13], Persian sturgeon Acipenser persicus [14], sterlet Acipenser ruthenus [15, 16], Russian sturgeon Acipenser gueldenstaedtii [17], Caspian brown trout Salmo caspius [18], and pacu Piaractus mesopotamicus [19]. Since ensuring the quality and viability of male gametes is essential for successful reproduction and the production of high-quality offspring [8, 20, 21], it is important to conduct studies that optimize stripping protocols with an emphasis on multiple sperm collection. This approach can assist consistent reproductive success and support controlled reproduction programs for the Bulatmai barbel in hatchery centers.
Nowadays numerous factors are suggested to determine sperm quality biomarkers, including (a) volume, (b) spermatozoa motility parameters (motility duration [MD], velocity, and percentage of total motility), (c) spermatozoa concentration, (d) membrane composition, stability, and DNA integrity, and (e) seminal plasma osmolality, pH, and compounds [7, 8, 22–24]. Among them, key performance criteria in controlled reproduction include spermatozoa motility parameters and spermatozoa concentration [11, 25–27]. Alternatively, sperm volume (SV) and seminal plasma characteristics can also be considered the main quality indicators measured in hatchery operations [8, 28]. Evaluating these parameters can help in developing a standardized protocol for sperm quality control in different fish species.
To our knowledge, no study has been conducted on the biological aspects of sperm, such as sperm motility and seminal plasma composition, for the Bulatmai barbel following the first and second stripping. This is while efficient planning for restocking and commercial aquaculture of this species requires standardized gamete management and handling. Therefore, this study aimed to identify biomarkers of sperm quality, analyze the characteristics of seminal plasma, and explore their relationship through the first and second periods of semen collection at a 1-week interval during the spawning season. This information could offer practical approaches to managing and handling the male broodstock of this valuable species.
2. Materials and Methods
2.1. Ethical Statement
This research was carried out in accordance with the National Institute of Health Guide for the care and use of laboratory animals [29].
2.2. Fish and Experimental Treatment
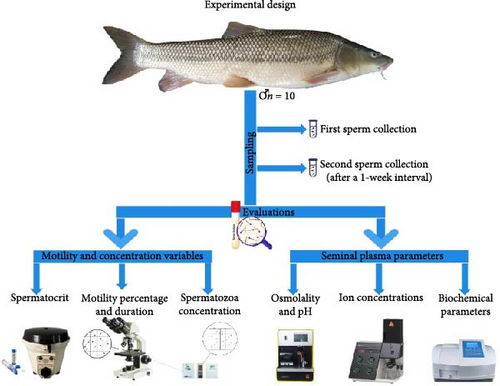
Male Bulatmai barbel (n = 12), with an average weight of 1698.5 ± 379.1 g, were captured during their natural reproductive migration using a purse seine net in the Caspian Sea in late April when the water temperature ranged from 18.5 to 19.5°C. Following their capture, the fish were transported to the Shahid Ansari Teleost Fish Restocking and Genetic Conservation Center (Rasht, Guilan, Iran). After transportation, 10 healthy male fish, free from visible body damage, were selected and placed into a 4000 L experimental tank. The fish were kept in this condition for a 3-day adaptation period. During the experiment, the fish were kept in natural water sourced from the Sefid-Rood River, with an average temperature of 20.1 ± 0.7°C. The fish were maintained under natural photoperiod conditions (12L:12D) throughout the experiment. The schematic of the experimental design of the present study is shown in Figure 1.
2.3. Sampling
After adaptation to hatchery conditions, males (all experimental fish, n = 10) with a mean body weight of 1761.5 ± 385.3 g and an average total length of 55.6 ± 2.8 cm were taken from the tanks and anesthetized with clove (Syzygium aromaticum) powder extract solution at 200 mg L−1 for subsequent handling. After that, fish were floy-tagged and sperm were collected (first stripping) with sterile 5 mL syringes using gentle abdominal massage. Special care was taken during the first and second sperm sampling to prevent contamination of samples with mucus, blood, urine, or feces. The fish were returned to the experimental tank after the sampling was completed. After a 1-week interval, sperm were obtained again (second stripping) from each male according to the method described in the first stripping. The time interval between two samplings was determined based on previous studies [9, 12, 30].
2.4. Motility and Spermatozoa Concentration Variables
The SV (mL) of each male was measured directly after collection with 5 mL syringes calibrated to 0.01 mL. Fresh semen was stored on ice (+4°C) during analysis. The maximum storage time of the sperm samples before motility analysis was half an hour. Sperm motility was assessed by visual evaluation on a light microscope glass slide after direct activation in the activation medium (hatchery water) at room temperature (19–20°C) according to the method described by Hadi Alavi et al. [31], with some modifications. In brief, 10 μL of sperm was mixed with 50 μL of hatchery water at the same temperature on a glass slide with a coverslip. The mixture was then visually examined at 5 s post-activation under the microscope (Olympus Corporation, Tokyo, Japan) at 40x magnification until 100% of spermatozoa were immotile. Sperm motility was expressed as a percentage of total motility, and the duration from sperm activation to the complete cessation of movement was recorded with a stopwatch as the motility time, representing the MD. Each evaluation was replicated two times per male.
2.5. Seminal Plasma Parameters
Seminal plasma was separated by centrifuging sperm samples twice at 10,000 g for 10 min. After centrifugation, the supernatant was stored at −80°C for subsequent analysis. The osmolality and pH of seminal fluid were measured using a Roebling osmometer (Messtechnik GmbH & Co., Berlin, Germany) and a WTW-537 pH meter (Xylem, Munich, Germany), respectively [28]. The concentrations of calcium (Ca2+) and magnesium (Mg2+) were measured colorimetrically using a spectrophotometer (Unico, Dayton, USA) with commercial kits (Pars Azmun, Karaj, Iran). To determine the concentrations of potassium (K+) and sodium (Na+), a flame photometer (Sherwood Scientific Ltd, Cambridge, United Kingdom) was used. Biochemical parameters, including glucose, cholesterol, triglycerides, and total protein concentrations, were measured using a spectrophotometer (Unico, Dayton, USA) and commercial kits (Pars Azmun, Karaj, Iran) according to instructions provided for each kit.
2.6. Statistical Analysis
Data from the first and second sperm sampling were compared using a paired t-test with SPSS software (version 23.0, IBM Corporation, Armonk, USA). Before conducting statistical analyses, the normality of data and the homogeneity of variances were confirmed by the Shapiro–Wilks and Levene’s tests, respectively. Pearson’s linear correlation was applied to identify the relationship between sperm quality parameters and seminal plasma characteristics. All values were presented as mean and standard deviation (±SD).
3. Results
3.1. Motility and Spermatozoa Concentration Variables
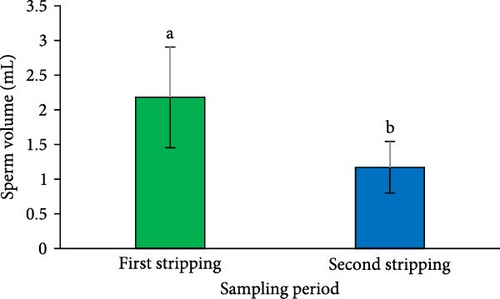
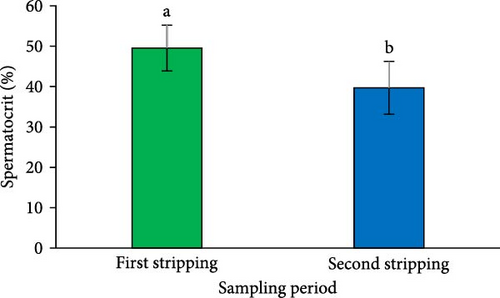
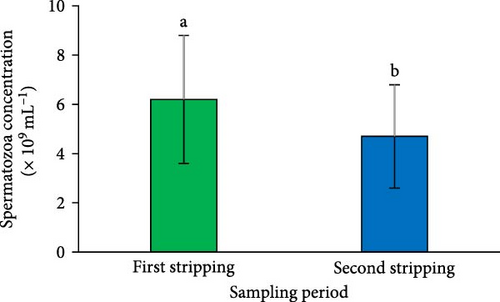
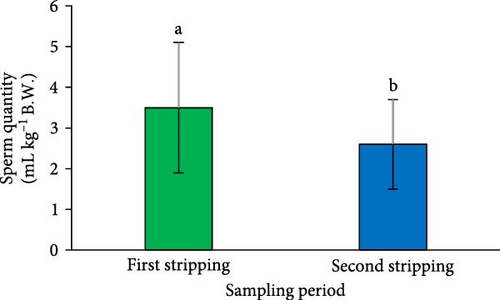
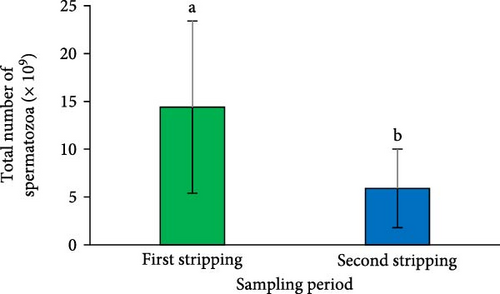
A significant reduction in both SV (Figure 2A) and sperm quantity (Figure 2D) was noted in the second sperm sampling compared to the first (p < 0.05). Additionally, a considerable decrease was observed in spermatocrit (Figure 2B), spermatozoa concentration (Figure 2C), and the total number of spermatozoa (Figure 2E) at the second sperm sampling (p < 0.05).
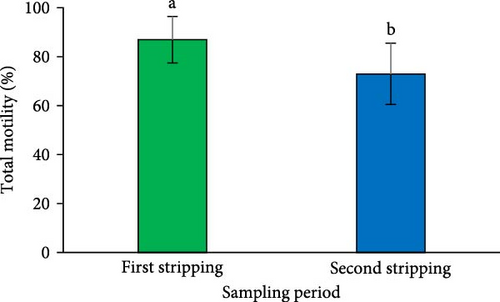
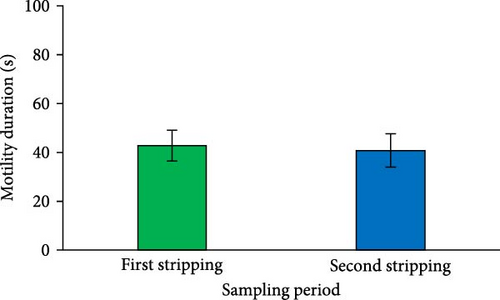
The results indicated a significant reduction in the percentage of total motility at the second sperm sampling (after a 1-week interval from the first stripping) (p < 0.05; Figure 2F). However, the spermatozoa MD measured at the second stripping was similar to that of the first (p > 0.05; Figure 2G).
3.2. Seminal Plasma Parameters
The results revealed significantly higher cholesterol and sodium levels in the seminal plasma from the first sperm sampling (p < 0.05; Table 1). Moreover, the osmolality of the seminal plasma from the first stripping was notably higher compared to the second stripping (p < 0.05; Table 1). Other seminal plasma characteristics (i.e., glucose, triglyceride, total protein, calcium, magnesium, and potassium contents, and pH value) did not differ significantly between first and second sperm sampling (p > 0.05; Table 1).
| Seminal plasma characteristics | Collection time | |
|---|---|---|
| First stripping | Second stripping | |
| Glucose (mg dL−1) | 7.5 ± 0.9 | 7.2 ± 1.0 |
| Cholesterol (mg dL−1) | 8.2 ± 0.5a | 7.9 ± 0.9b |
| Triglyceride (mg dL−1) | 14.0 ± 3.1 | 14.8 ± 4.2 |
| Total protein (mg dL−1) | 1.1 ± 0.4 | 1.2 ± 0.4 |
| Calcium (mM L−1) | 2.1 ± 0.3 | 1.9 ± 3.0 |
| Magnesium (mM L−1) | 0.4 ± 0.1 | 0.4 ± 0.2 |
| Sodium (mM L−1) | 144.6 ± 12.1a | 133.2 ± 14.2b |
| Potassium (mM L−1) | 53.5 ± 8.6 | 55.6 ± 10.3 |
| Osmolality (mOsmol L−1) | 278.6 ± 38.0a | 256.2 ± 29.6b |
| pH | 8.5 ± 0.1 | 8.4 ± 0.1 |
- Note: Mean values in the same row with different superscript letters indicate a significant difference (p < 0.05).
3.3. Relationship Between Sperm Quality and Seminal Plasma Ionic and Biochemical Parameters
During the first sperm sampling, significant correlations were found among various parameters (Table 2), specifically between SV and the total number of spermatozoa (0.893); spermatocrit value with both spermatozoa concentration (0.820) and the total number of spermatozoa (0.800); spermatozoa concentration with both sperm quantity (0.815) and the total number of spermatozoa (0.822); the percentage of spermatozoa motility and MD (0.676); glucose with calcium (−0.722, Table 3) and spermatozoa MD (0.723, Table 4); cholesterol and potassium (0.711); and between triglyceride and magnesium (0.809).
| Sperm quality parameters | Collection time | Sperm quality parameters | |||||
|---|---|---|---|---|---|---|---|
| Sperm volume | Spermatocrit | Spermatozoa concentration | Sperm quantity | Total number of spermatozoa | Total motility | ||
| Spermatocrit | First stripping | 0.584 | — | — | — | — | — |
| Second stripping | 0.543 | — | — | — | — | — | |
| Spermatozoa concentration | First stripping | 0.515 | 0.820 ∗∗ | — | — | — | — |
| Second stripping | 0.639 ∗ | 0.712 ∗ | — | — | — | — | |
| Sperm quantity | First stripping | 0.016 | 0.576 | 0.815 ∗ | — | — | — |
| Second stripping | 0.178 | 0.616 | 0.806 ∗∗ | — | — | — | |
| Total number of spermatozoa | First stripping | 0.893 ∗∗ | 0.800 ∗∗ | 0.822 ∗∗ | 0.397 | — | — |
| Second stripping | 0.894 ∗∗ | 0.679 ∗ | 0.889 ∗∗ | 0.502 | — | — | |
| Total motility | First stripping | 0.216 | −0.202 | −0.195 | −0.273 | 0.082 | — |
| Second stripping | 0.022 | −0.178 | −0.383 | −0.497 | −0.104 | — | |
| Motility duration | First stripping | 0.506 | 0.217 | 0.067 | −0.208 | 0.361 | 0.676 ∗ |
| Second stripping | 0.702 ∗ | 0.659 ∗ | 0.428 | 0.054 | 0.636 ∗ | 0.217 | |
- Note: n = 10.
- ∗p < 0.05; ∗∗p < 0.01.
| Seminal plasma characteristics | Collection time | Seminal plasma characteristics | ||||||||
|---|---|---|---|---|---|---|---|---|---|---|
| Glucose | Cholesterol | Triglyceride | Total protein | Calcium | Magnesium | Sodium | Potassium | Osmolality | ||
| Cholesterol | First stripping | 0.122 | — | — | — | — | — | — | — | — |
| Second stripping | −0.108 | — | — | — | — | — | — | — | — | |
| Triglyceride | First stripping | 0.046 | 0.206 | — | — | — | — | — | — | — |
| Second stripping | −0.483 | 0.322 | — | — | — | — | — | — | — | |
| Total protein | First stripping | 0.058 | −0.154 | −0.012 | — | — | — | — | — | — |
| Second stripping | −0.467 | 0.598 | 0.029 | — | — | — | — | — | — | |
| Calcium | First stripping | −0.722 ∗ | 0.100 | 0.106 | 0.331 | — | — | — | — | — |
| Second stripping | −0.146 | −0.018 | 0.368 | −0.091 | — | — | — | — | — | |
| Magnesium | First stripping | 0.247 | 0.259 | 0.809 ∗∗ | −0.276 | −0.50 | — | — | — | — |
| Second stripping | 0.369 | −0.026 | 0.304 | −0.411 | 0.228 | — | — | — | — | |
| Sodium | First stripping | 0.324 | 0.555 | 0.228 | 0.374 | −0.190 | 0.025 | — | — | — |
| Second stripping | 0.466 | −0.158 | −0.237 | 0.018 | −0.285 | 0.263 | — | — | — | |
| Potassium | First stripping | −0.122 | 0.711 ∗ | 0.392 | 0.242 | 0.539 | 0.310 | 0.335 | — | — |
| Second stripping | 0.206 | 0.200 | 0.046 | 0.209 | 0.465 | 0.298 | 0.211 | — | — | |
| Osmolality | First stripping | −0.599 | −0.004 | −0.109 | 0.173 | 0.534 | 0.011 | −0.168 | 0.165 | — |
| Second stripping | −0.457 | 0.465 | 0.333 | 0.805 ∗ | −0.082 | 0.024 | 0.304 | 0.241 | — | |
| pH | First stripping | 0.217 | 0.122 | −0.009 | 0.296 | 0.026 | −0.245 | 0.043 | 0.440 | −0.438 |
| Second stripping | 0.372 | −0.101 | −0.486 | 0.004 | −0.060 | −0.153 | 0.553 | 0.328 | −0.211 | |
- Note: n = 10.
- ∗p < 0.05; ∗∗p < 0.01.
| Sperm quality parameters | Collection time | Seminal plasma characteristics | |||||||||
|---|---|---|---|---|---|---|---|---|---|---|---|
| Glucose | Cholesterol | Triglyceride | Total protein | Calcium | Magnesium | Sodium | Potassium | Osmolality | pH | ||
| Sperm volume | First stripping | 0.433 | −0.024 | −0.076 | 0.223 | −0.275 | 0.087 | 0.322 | 0.113 | −0.292 | 0.108 |
| Second stripping | −0.128 | −0.364 | −0.508 | −0.045 | 0.208 | 0.61 | 0.430 | 0.039 | −0.095 | 0.189 | |
| Spermatocrit | First stripping | −0.029 | −0.394 | 0.100 | 0.128 | 0.078 | −0.060 | −0.105 | 0.055 | −0.448 | 0.389 |
| Second stripping | −0.112 | −0.562 | −0.016 | −0.602 | 0.315 | 0.199 | −0.055 | −0.188 | −0.539 | 0.090 | |
| Spermatozoa concentration | First stripping | −0.266 | −0.341 | −0.012 | 0.474 | 0.344 | −0.228 | 0.026 | 0.260 | 0.026 | 0.403 |
| Second stripping | −0.465 | −0.308 | −0.121 | 0.053 | 0.321 | −0.315 | −0.020 | 0.025 | −0.090 | 0.295 | |
| Sperm quantity | First stripping | −0.463 | −0.619 | 0.020 | 0.552 | 0.466 | −0.323 | −0.221 | 0.017 | 0.203 | 0.311 |
| Second stripping | −0.672 ∗ | −0.006 | 0.335 | 0.054 | 0.36 | −0.323 | −0.357 | −0.163 | −0.112 | 0.038 | |
| Total number of spermatozoa | First stripping | 0.161 | −0.188 | −0.170 | 0.334 | −0.049 | −0.167 | 0.192 | 0.159 | −0.239 | 0.330 |
| Second stripping | −0.155 | −0.473 | −0.430 | −0.032 | 0.188 | −0.226 | 0.263 | −0.049 | −0.157 | 0.292 | |
| Total motility | First stripping | 0.485 | −0.125 | −0.522 | −0.050 | −0.254 | −0.014 | −0.346 | −0.204 | 0.104 | −0.036 |
| Second stripping | 0.452 | −0.506 | −0.152 | −0.286 | 0.024 | 0.080 | 0.367 | −0.121 | −0.209 | −0.100 | |
| Motility duration | First stripping | 0.723 ∗ | 0.106 | 0.064 | 0.039 | −0.260 | 0.403 | −0.089 | 0.253 | −0.325 | 0.392 |
| Second stripping | 0.526 | −0.565 | −0.443 | −0.535 | 0.217 | 0.336 | 0.494 | 0.245 | −0.504 | 0.559 | |
- Note: n = 10.
- ∗p < 0.05.
During the second sperm sampling, significant correlations were observed among various parameters (Table 2), including between SV and spermatozoa concentration (0.639); the total number of spermatozoa (0.894) and MD (0.702); spermatocrit with both spermatozoa concentration (0.712) and the total number of spermatozoa (0.679); MD with both spermatocrit (0.659) and the total number of spermatozoa (0.636); spermatozoa concentration with both sperm quantity (0.806) and the total number of spermatozoa (0.889); total protein and osmolality (0.805, Table 3); and between glucose and sperm quantity (−0.672, Table 4).
4. Discussion
4.1. Motility and Spermatozoa Concentration Variables
The present study indicated that sampling 1 week after the first stripping negatively affects the Bulatmai barbel spermatozoa motility percentage, while the duration of spermatozoa motility remained unaffected. In line with the results of the present study, researchers reported a reduction in sperm quality in terms of motility after re-stripping in various teleost fish species, including common carp [11], pacu [19], rainbow trout Oncorhynchus mykiss [34], and Caspian brown trout [18]. The same results have been observed in sturgeon species in the case of Persian sturgeon [14, 35] and Russian sturgeon [17]. In contrast, research has shown that in some teleost fish species, such as common carp [36], Solea senegalensis [37], and turbot Scophthalmus maximus [38], sperm can be re-stripped without any significant differences in motility parameters. Furthermore, an increase in the motility parameters of spermatozoa has been observed in Sterlet after the second [15] or third sperm collection [16]. These differences might be related to species-specific reactions during re-stripping intervals, environmental conditions, and spermiation induction methods. Moreover, after the first stripping, fish undergo stress, and it typically takes several days for their sperm ducts to recover and be ready to release mature sperm for the next phase. Considering the interval between two strippings in our study was only 1 week, it may have been too short for the second stripping process. Consequently, future studies should investigate the effects of a longer interval between repeated sperm collections on the sperm quality parameters of the Bulatmai barbel.
As previously reported for cyprinid species [13, 36], re-stripping could affect SV and density, resulting in a significant reduction in the outcomes of the second stripping compared to the first. Our findings are consistent with previous research, indicating that the SV, spermatozoa concentration, spermatocrit, and total spermatozoa production of the Bulatmai barbel significantly decreased at the second stripping. Similar results have been reported in various teleosts [18, 34] and sturgeon species [14, 16, 17, 35]. Nevertheless, some studies have suggested that the concentration of spermatozoa remains unaffected after re-stripping processes. For instance, Malinovskyi et al. [10] demonstrated that multiple sperm collections do not significantly affect SV and spermatozoa concentration in pikeperch compared to single sperm collection. The reason for this difference is unclear, but it may be related to variations in the biological characteristics of different species and their environmental conditions. Reduced spermatozoa concentration after re-stripping in the present study may be due to depletion of sperm reserves in the testes [25, 39], stress-induced handling [7, 40, 41], and hormonal imbalances affecting sperm production and quality [8, 21]. However, the specific effect of these cases needs to be evaluated in future studies.
4.2. Seminal Plasma Parameters
Our results indicated that the osmolality, sodium, and cholesterol concentrations in the Bulatmai barbel’s seminal plasma were lower in the second stripping. Similar changes in seminal plasma osmolality and sodium concentration have been observed in the case of Caspian brown trout [18] and Persian sturgeon [14]. Malinovskyi et al. [10] have also reported a decrease in the osmolality of pikeperch seminal plasma following multiple sperm collections. So far, no seminal plasma cholesterol content alteration has been documented in other fish species after multiple sperm collections. However, a decline in total protein concentration has been mentioned by Hajirezaee et al. [18] in Caspian brown trout. The observed differences arise from the stratified nature of seminal plasma along the reproductive tract [14], contamination with urine in later fractions [25, 36], species-specific anatomical features [42], and the mechanical and/or hormonal effects of multiple sperm collections [7, 21]. On the other hand, the observed reduction of osmolality in the second stripping of the present study could be related to the short re-stripping interval and insufficient time for sperm replenishment in the sperm ducts. In this regard, it has been well proven that chronic stress originating from handling could disrupt hormonal balance (e.g., reduced testosterone), impairing spermatogenesis and reproductive capacity in fish [40, 43]. Altogether, our results show the favorable quality of the first stripping sperm samples, which can be considered for controlled reproduction programs. Further research can focus on re-stripping intervals, mapping secretory patterns, refining collection methods, and defining hormonal influences on seminal plasma dynamics. This knowledge will advance reproductive biotechnology and improve the reproductive outcomes in wild and farmed populations of Bulatmai barbel fish.
4.3. Relationship Between Sperm Quality and Seminal Plasma Ionic and Biochemical Parameters
In the first stripping, the strong positive relationships among SV, the total number of spermatozoa, spermatocrit, and spermatozoa concentration highlight the functional integrity of the male reproductive system and could reflect efficient spermatogenesis process, vigorous sperm production, and better fertilization potential. A higher spermatocrit value indicates denser sperm, which is associated with increased spermatozoa concentration and total output [28, 31]. These findings are consistent with studies in teleosts, such as common carp [9] and rainbow trout [34], where seminal volume directly predicts fertility potential. The positive correlation between motility percentage and duration (r = 0.676) suggests that, under optimal conditions, total motility can maintain functionality for a longer time. The implication of glucose in extending MD (r = 0.723) highlights its role as an energy source for sperm activity [44]. According to Lahnsteiner et al. [45, 46], there is a significant decrease in seminal plasma glucose levels during the motility process. Therefore, the positive correlation observed in the present study between seminal plasma glucose levels and MD suggests that higher glucose levels may prolong viability by delaying energy depletion through glycolysis [44]. In contrast, the negative correlation of glucose with calcium (r = −0.722) suggests that calcium may have a dual role in activating and inhibiting motility pathways; however, this hypothesis requires further investigation in future studies. Focus on these physiological mechanisms in future studies could aid in developing targeted strategies to improve reproductive success in aquaculture. The correlation between cholesterol and potassium (r = 0.711) could relate to membrane stability, as cholesterol alters fluidity [47] while potassium helps maintain osmotic balance [48]. Similarly, the relationship between triglycerides and magnesium (r = 0.809) may indicate a connection between energy storage provided by triglycerides [49] and ATP-dependent motility regulation by magnesium [50].
In the second stripping, strong osmolality-total protein correlation (r = 0.805) may indicate proteins’ contribution to cell membrane permeability and osmotic balance [51], which are crucial for the survival of spermatozoa cells. A decrease in osmolality at second stripping, which is consistent with previous studies [10, 14, 18], can be evidence of decreased sperm quality following multiple sperm sampling. The inverse correlation of glucose with sperm number (r = −0.672) could indicate metabolic stress, wherein glucose is rerouted to meet physiological stress (e.g., cortisol-stimulated gluconeogenesis) at the expense of sperm production. However, this hypothesis requires further investigation in future experiments. The change from volume-correlated (first stripping) to motility- and stress-related correlations (second stripping) is likely caused by sperm reserve depletion and hormonal exhaustion (e.g., reduced testosterone for spermatogenesis). The same trends are observed in re-stripped pacu, where steroidogenesis declines over the breeding season [19]. Overall, since some quality parameters are affected in Bulatmai barbel sperm following re-stripping, prioritizing the first stripping can be suggested for artificial fertilization and/or cryopreservation programs.
5. Conclusion
The results of the present study demonstrate that although Bulatmai barbel males can be stripped for a second time without the need for hormonal induction during the breeding season, re-stripping after a 1-week interval negatively affects some sperm quality parameters. These results highlight the complex balance between sperm production, metabolic resource allocation, and seminal plasma homeostasis in Bulatmai barbel, hence emphasizing the species-specific aquaculture management requirements. Hatchery centers should consider these findings to maximize sperm use and prevent reductions in fertility outcomes. Further research is required to develop improved protocols for sustainable artificial reproduction, improve reproductive efficiency, and ensure the well-being of the Bulatmai barbel broodstock and other related species.
Conflicts of Interest
The authors declare no conflicts of interest.
Author Contributions
Erfan Akbari Nargesi: conceptualization, methodology, investigation, project administration (lead), supervision, formal analysis, visualization, writing–original draft preparation, writing–review and editing. Danial Gorouhi: resources, project administration (supporting).
Funding
The authors received no financial support for this article.
Acknowledgments
The authors extend their sincere gratitude to the dedicated laboratory staff at the Faculty of Natural Resources, University of Guilan, and the team at the Shahid Ansari Teleost Fish Restocking and Genetic Conservation Center for their invaluable assistance throughout the experimental phase.
Open Research
Data Availability Statement
The data supporting the findings of this research are available from the corresponding author upon reasonable request.


