Effects of Cold Stress on Skin Color, Immuno-Antioxidant Function, Muscle Compositions, and Intestinal Microbiota of Red Tilapia During Overwintering
Abstract
Cold stress due to overwintering is considered a major issue limiting the development of the red tilapia (Oreochromis spp.) industry. This study was the first to systematically investigate the effects of cold stress on skin color, immuno-antioxidant function, muscle compositions, and intestinal microbiota of red tilapia during overwintering. Fish (initial weight: 72.71 ± 1.32 g) were divided into the cold stress group (cold) and the control group. In the control group, the water temperature (WT) was maintained at 20°C, which is consistent to with the overwintering WT indoors or greenhouse in the local area. In the cold group, the WT was decreased from 20°C to 8°C by 2°C per day during the experiment. At the end of the experiment, we found that the L∗ value of fish ventral skin in the cold group was lower than that in the control group (p < 0.05). The superoxide dismutase (SOD), malondialdehyde (MDA), glutathione (GSH), catalase (CAT), and total antioxidant capacity (T-AOC) activities were higher, but complement 3 (C3) and complement 4 (C4) activities were lower in the liver of cold group fish than those in the control group (p < 0.05). For the gill tissue, the SOD, MDA, and GSH activities were higher, but the C3 activity was lower in the cold group than those in the control group (p < 0.05). The total amino acid (TAA) content in the muscle of fish in the cold group was higher than that in the control group (p < 0.05). 16 s rRNA analysis showed that the intestinal microbial abundance and alpha diversity of fish in the cold group decreased (p < 0.05). Component analysis revealed a significantly higher relative abundance of Cetobacterium spp. in the fish of the cold group. The findings of this study will provide a valuable understanding of fish cold stress during overwintering, which will contribute to facilitating the breeding of new cold-resistant varieties of red tilapia in the future.
1. Introduction
It has been known that environmental temperature affects the physiological functions of poikilothermic animals, such as fish [1]. Negative effects of cold stress on fish have been reported in many studies [2–4]. It has been demonstrated that the plasma protein and the biochemical indices of pufferfish (Takifugu obscurus) exhibited significant changes when the water temperature (WT) decreased from 25 to 13°C [5]. Sun et al. [6] found that a decrease of WT from 28 to 13°C resulted in a decrease in blood cell counts, DNA damage, and significant changes in biochemical parameters in orange grouper (Epinephelus coioides). Additionally, temperature has been demonstrated to influence the skin color differentiation of fish. Pavlidis et al. [7] observed that red porgies (Pagrus pagrus) reared at 19°C exhibited higher brightness levels than those reared at 15°C, and the highest skin melanin content was observed in fish reared at 15°C. Wang et al. [8] observed the skin color of red tilapia (Oreochromis spp.) at 16°C was darker than that at 25 and 30°C groups. Many studies have also evaluated the impact of stressors (salinity changes, culture environment, dietary additions, starvation, etc.) on physiological responses such as hormone levels, histology, oxidative response, osmoregulation, and gene expression in red tilapia [9-11]. Although there have been many reports on the effect of temperature on tilapia, the exact regulatory mechanisms underlying the cold stress of red tilapia during overwintering are still unclear.
Red tilapia is a superior species resulting from the crossbreeding of mutated red Mozambique tilapia (O. mossambicus) with other tilapia species, such as Nile tilapia (O. niloticus) [12]. After many generations of breeding, red tilapia has become an economically important fish species worldwide due to its colorful skin, lack of black peritoneum, adaptability, fresh taste, high market value, and so on [13]. However, red tilapia is a warm-water fish that is unable to overwinter naturally in the northern regions of China. In addition, different species of tilapia show different cold tolerance in response to cold stress [2]. Blue tilapia (O. aureus) is considered the most tolerant to low temperatures, and O. mossambicus is the most sensitive species to low temperatures, which transmits this trait to the offspring, as in hybrid red tilapia [14]. Red tilapia has a wide WT adaptation range and can tolerate low temperatures of 8°C, with a critical temperature of 7°C. When the WT drops to 6.5°C, red tilapia may go into shock and die at 6°C [15]. In some regions, red tilapia faces the problems of stunted growth and high mortality during the overwintering period [16, 17]. Concurrently, the issue of the darkening of the body color of red tilapia as a consequence of cold stress overwintering has a significant impact on the economic value of red tilapia [18]. So, the cold stress problem limited the development of the red tilapia industry in China.
In our previous study, we identified the melanogenesis pathway and candidate genes and microRNAs associated with chronic cold stress by transcriptome and microRNA-seq analysis [18–20]. The effects of temperature [21], dietary cysteine and tyrosine (Tyr) [22], and background color [23] on the growth, skin color, and physiological function of red tilapia were also assessed. Recently, we studied the joint analysis of the brain metabolome and transcriptome of red tilapia under overwintering cold stress [24]. In this study, we systematically investigated the effects of cold stress on skin color, immuno-antioxidant function, muscle composition, and intestinal microbiota of red tilapia during overwintering. The findings of this study will provide a valuable understanding of fish cold stress during overwintering, which will facilitate the breeding of new cold-resistant varieties of red tilapia in the future.
2. Materials and Methods
2.1. Fish
All animal treatments in this study were approved by the Bioethical Committee of Freshwater Fisheries Research Center (FFRC) of the Chinese Academy of Fishery Sciences (CAFS; BC 2013863, 9/2013), guidelines for the Care and Use of Experimental Animals of China. The red tilapia used in the study was a new aquaculture variety “Zhongheng No. 1” (GS-01-002-2022) with a genetically stable and consistent pink skin color. It is obtained from the original parents of Malaysia’s red tilapia population with pink skin color and no red and black spots after five generations of mass selection by FFRC, CAFS. The breeding target traits were skin color and body weight. It is now one of the dominant aquaculture species in China due to its consistent skin color, fast growth, and stable genetic traits under various culture conditions. The fish were kept in indoor conical fiberglass tanks (diameter 150 cm × depth 120 cm) and acclimated in a flow-through water system for overwintering.
2.2. Experiment
Eighty fish (initial weight: 72.71 ± 1.32 g) were randomly divided into two groups (each group 40 fish) for cold and control groups, respectively. The fish were kept in indoor conical fiberglass tanks (diameter 150 cm × depth 120 cm). The experiment period was 6 days. During the experiment, the room temperature was less than 6°C. So the WT was maintained at 20°C by the temperature controller (SUNSUN, Zhejiang, China) in the control group, which is consistent with the overwintering WT in the greenhouse of the local area. In the cold group, the WT was decreased by 2°C per day from 20°C to 8°C. Every morning at 8 a.m., the temperature controller was set 2°C lower. On the last day, we added crushed ice to help cool it down if the WT could not be lowered by the temperature controller. Following 1 day of temperature maintenance at 8°C, fish from both groups were sampled. During the period of the experiment, the same commercial fish feed (Tong Wei, Chengdu, China) was used and the fish was fed twice a day until the day before sampling. Aeration was supplied to each tank 24 h per day and photoperiod was 12D : 12L. During the experiment, the swimming and feeding behaviors of the red tilapia were observed and recorded every day.
2.3. Sampling
At the end of the experiment, the number of fish in each group was counted. It was observed that some of the red tilapia in the cold group ceased feeding when the WT was below 10°C, sank to the bottom of the tank, and gradually lost equilibrium when the temperature was 8°C. However, there was no mortality during the period of the experiment. Before sampling, we measured the L∗, a∗, and b∗ values in the dorsal and ventral skin of six fish in the cold and control group. Then another six fish were randomly selected and sampled from each group. The liver and gill tissues of three fish were excised for physiological parameters, and muscle tissues were taken for specific amino acids and fatty acids contents analysis. The intestinal contents of six fish were obtained for 16S rDNA amplicon sequencing. All samples were snap-frozen and stored at − 80°C.
2.4. L∗, a∗, and b∗ Values of Skin
We measured the L∗, a∗, and b∗ values in the dorsal and ventral skin of fishes with a Color Quest XE (Hunterlab, USA) as described by Wang et al. [23]. After the instrument correction, we placed the dorsal and ventral skin (above and below the lateral line) of the fish on the reflectance port to obtain the L∗, a∗, and b∗ values. The L∗ (brightness) axis (0−100): 0 for black and 100 for white. The a∗ (red–green) axis: A positive value is red, a negative value is green, and 0 is neutral. The b∗ (blue–yellow) axis: The positive value is yellow, the negative is blue, and 0 is neutral.
2.5. Immuno-Antioxidant Analysis
Catalase (CAT), superoxide dismutase (SOD), glutathione (GSH), malondialdehyde (MDA), total antioxidant capacity (T-AOC), lysozyme (LZM), complement 3 (C3), and complement 4 (C4) in liver and gill tissues were detected according to the instructions of the kit from Nanjing Jiancheng Bioengineering Institute (Nanjing, China).
Before the measurement of muscle composition, the samples were freeze-dried using a freeze-dryer (Jinshi, Nanjing, China). The amino acid content was detected by Agilent liquid chromatograph (Ag-1100, USA) with the national standard method (GB 5009.124-2016 “Determination of Amino Acids in Foods of National Standards for Food Safety”). The fatty acid composition was analyzed by Shimadzu gas chromatograph (GC-2030, Japan) with GB 5009.168-2016 (“Determination of Fatty Acids in Foods of the National Standard for Food Safety”).
2.6. Intestinal Microbial Diversity Analysis
Microbial DNA was extracted from red tilapia stool samples using the E. Z. N. A. stool DNA Kit (Omega Bio-tek, Norcross, GA, U. S.) according to the manufacturer’s protocols. The V3-V4 region of the bacteria 16s ribosomal RNA gene was amplified by PCR. The purified PCR products were quantified with Qubit 3.0 (Life Invitrogen) to construct Illumina Pair-End libraries. Pair-end sequencing was performed on the Illumina Novaseq 6000 platform (Nanjing Gene Pioneer Co., Ltd.) on the amplicon libraries. The alpha diversity index was analyzed based on QIIME2 (qiime2-2021.11).
2.7. Statistical Analysis
Statistical analysis was performed using SPSS 25 (SPSS Inc., Chicago, IL, USA). The data conformed to normal distribution and variance χ2 test. The significance of differences was analyzed using the independent samples t-test. All the results are presented as mean ± standard error of the mean (SEM).
3. Results
3.1. L∗, a∗, and b∗ Values of Skin
At the end of the experiment, the L∗, a∗, and b∗ values in the dorsal and ventral skin of red tilapia are shown in Table 1. The ventral L∗ value of fish in the cold group was significantly lower than that in the control group (p < 0.05). There was no significant difference in L∗, a∗, and b∗ values for the dorsal skin.
| Items | Cold | Control | Significance | |
|---|---|---|---|---|
| Dorsal skin | L∗ | 64.29 ± 2.06 | 67.93 ± 0.48 | — |
| a∗ | −1.46 ± 0.51 | −2.04 ± 0.47 | — | |
| b∗ | −3.36 ± 1.26 | −5.88 ± 0.94 | — | |
| Ventral skin | L∗ | 70.30 ± 1.65 | 77.18 ± 1.06 | ∗ |
| a∗ | −1.43 ± 0.61 | −1.51 ± 0.51 | — | |
| b∗ | −1.17 ± 1.61 | −1.03 ± 0.75 | — | |
- ∗ indicates a significant difference between groups (p < 0.05).
3.2. Immuno-Antioxidant Indicators
The liver SOD, MDA, GSH, CAT, and T-AOC activities of fish in the cold group were higher (p < 0.05), but the C3 and C4 activities of fish in cold group were lower than those in the control group (p < 0.05; Table 2). The levels of SOD, MDA, and GSH of fish gill in the cold group were higher (p < 0.05), but the C3 level was lower (p < 0.05) than those in the control group (Table 2).
| Physiological parameters | Liver | Gill | ||
|---|---|---|---|---|
| Cold | Control | Cold | Control | |
| SOD (U/mgprot) | 171.97 ± 9.81 | 44.90 ± 4.29∗∗ | 162.26 ± 8.71 | 50.61 ± 2.79∗∗ |
| MDA (nmoL/mgprot) | 5.33 ± 0.17 | 1.59 ± 0.23∗∗ | 33.63 ± 3.50 | 13.10 ± 0.42∗∗ |
| GSH (mgGSH/prot) | 11.36 ± 1.83 | 5.65 ± 0.67∗ | 5.51 ± 0.80 | 2.16 ± 0.37∗ |
| CAT (mgprot) | 26.13 ± 1.71 | 15.39 ± 0.36 | 3.44 ± 0.53 | 2.90 ± 0.48 |
| T-AOC (U/mgprot) | 1.01 ± 0.04 | 0.94 ± 0.05 | 0.15 ± 0.01 | 0.15 ± 0.02 |
| LZM (U/mgprot) | 1.24 ± 0.18 | 0.78 ± 0.07 | 0.43 ± 0.05 | 0.28 ± 0.07 |
| C3 (μg/mL) | 17.71 ± 0.13 | 21.33 ± 0.53 | 16.17 ± 0.39 | 17.76 ± 0.50 |
| C4 (μg/mL) | 1.60 ± 0.05 | 2.65 ± 0.22 | 1.55 ± 0.06 | 1.85 ± 0.16 |
- Abbreviations: C3, complement 3; C4, complement 4; CAT, catalase; GSH, glutathione; LZM, lysozyme; MDA, malondialdehyde; SOD, superoxide dismutase; T-AOC, total antioxidant capacity.
- ∗ indicates a significant difference between groups (p < 0.05). ∗∗ indicates a significant difference between groups (p < 0.01).
3.3. Muscle Compositions
The results of specific amino acids and fatty acids contents in the muscle of fish are shown in Tables 3 and 4, respectively. For the amino acids, the glutamic acid (Glu), asparagine (Asn), threonine (Thr), alanine (Ala), Tyr, methionine (Met), and total amino acids (TAAs) in the muscle of cold group fish were higher than those in the control group (p < 0.05). For the fatty acids, the level of C16:0 in the muscle of cold group fish was significantly higher than those in the control group (p < 0.05). There was no significant difference in the content of other indicators (p > 0.05).
| Amino acid | Cold | Control | Significance |
|---|---|---|---|
| UAA | |||
| Asp | 0.16 ± 0.01 | 0.14 ± 0.02 | — |
| Glu | 0.32 ± 0.01 | 0.24 ± 0.01 | ∗∗ |
| SAA | |||
| Thr1 | 0.29 ± 0.02 | 0.14 ± 0.02 | ∗∗ |
| Ser | 0.15 ± 0.01 | 0.21 ± 0.03 | — |
| Gly | 5.79 ± 0.08 | 5.47 ± 0.16 | — |
| Ala | 0.85 ± 0.04 | 0.60 ± 0.02 | ∗∗ |
| Pro | 0.87 ± 0.15 | 0.89 ± 0.07 | — |
| BAA | |||
| Val1 | 0.07 ± 0.01 | 0.06 ± 0.00 | — |
| Met1 | 0.03 ± 0.00 | 0.02 ± 0.00 | ∗∗ |
| Ile1 | 0.04 ± 0.00 | 0.03 ± 0.00 | — |
| Leu1 | 0.09 ± 0.01 | 0.06 ± 0.01 | — |
| Tyr | 0.06 ± 0.00 | 0.04 ± 0.00 | ∗∗ |
| Phe1 | 0.04 ± 0.00 | 0.04 ± 0.00 | — |
| Lys1 | 0.11 ± 0.02 | 0.09 ± 0.01 | — |
| His2 | 1.10 ± 0.04 | 1.12 ± 0.06 | — |
| Arg2 | 0.03 ± 0.00 | 0.04 ± 0.01 | — |
| ∑UAAs | 0.48 ± 0.01 | 0.38 ± 0.02 | ∗ |
| ∑SAAs | 7.96 ± 0.24 | 7.32 ± 0.13 | — |
| ∑BAAs | 1.56 ± 0.08 | 1.50 ± 0.05 | — |
| Flavor amino (UAAs+SAAs) | 8.43 ± 0.25 | 7.70 ± 0.11 | — |
| Asn | 0.71 ± 0.04 | 0.42 ± 0.03 | ∗∗ |
| Gln | 1.37 ± 0.05 | 1.41 ± 0.07 | — |
| Trp | 0.73 ± 0.09 | 0.68 ± 0.04 | — |
| ∑AAs3 | 12.8 ± 0.18 | 11.71 ± 0.15 | ∗∗ |
- Abbreviations: Ala, alanine; Asn, asparagine; BAA, bitterness amino acid; Glu, glutamic acid; Met, methionine; SAA, sweet amino acid; Thr, threonine; Tyr, tyrosine; UAA, umami amino acid.
- 1Essential amino acid.
- 2Semi-essential amino acid.
- 3Total amino acid (AA).
- ∗ indicates a significant difference between groups (p < 0.05). ∗∗ indicates a significant difference between groups (p < 0.01).
| Fatty acid | Cold | Control | Significance |
|---|---|---|---|
| C14 : 0 | 1.34 ± 0.08 | 1.08 ± 0.10 | — |
| C15 : 0 | 0.16 ± 0.00 | 0.18 ± 0.01 | — |
| C16 : 0 | 22.09 ± 0.17 | 21.44 ± 0.15 | ∗ |
| C17 : 0 | 0.26 ± 0.01 | 0.26 ± 0.02 | — |
| C18 : 0 | 9.30 ± 0.28 | 9.65 ± 0.27 | — |
| C20 : 0 | 0.26 ± 0.01 | 0.301 ± 0.02 | — |
| C16 : 1 | 2.84 ± 0.07 | 2.54 ± 0.25 | — |
| C17 : 1 | 1.47 ± 0.06 | 1.52 ± 0.11 | — |
| C18 : 1n9t | 0.37 ± 0.01 | 0.39 ± 0.03 | — |
| C18 : 1n9c | 21.90 ± 1.09 | 22.25 ± 1.50 | — |
| C20 : 1 | 1.05 ± 0.05 | 1.02 ± 0.05 | — |
| C18 : 2n6c | 17.70 ± 0.16 | 17.71 ± 0.13 | — |
| C20 : 2 | 0.95 ± 0.06 | 1.00 ± 0.03 | — |
| C18 : 3n6 | 0.74 ± 0.06 | 0.76 ± 0.03 | — |
| C18 : 3n3 | 1.11 ± 0.03 | 1.12 ± 0.05 | — |
| C20 : 3n6 | 1.34 ± 0.04 | 1.28 ± 0.06 | — |
| C20 : 4n6 | 5.43 ± 0.27 | 5.73 ± 0.59 | — |
| C20 : 5 | 0.67 ± 0.02 | 0.64 ± 0.07 | — |
| C22 : 6n3 | 11.04 ± 0.56 | 11.13 ± 0.98 | — |
| SFAs | 33.41 ± 0.35 | 32.92 ± 0.18 | — |
| UFAs | 66.59 ± 0.35 | 67.09 ± 0.18 | — |
| MUFAs | 27.63 ± 1.13 | 27.72 ± 1.72 | — |
| PUFAs | 38.96 ± 0.84 | 39.37 ± 1.68 | — |
| ∑n−3 | 12.14 ± 0.54 | 12.25 ± 0.94 | — |
| ∑n−6 | 25.20 ± 0.26 | 25.48 ± 0.68 | — |
| PUFA/SFA | 1.17 ± 0.02 | 1.20 ± 0.05 | — |
| n−3/n−6 | 0.48 ± 0.02 | 0.48 ± 0.03 | — |
- Abbreviations: MUFAs, monounsaturated fatty acids; PUFAs, polyunsaturated fatty acids; SFAs, saturated fatty acis; UFAs, unsaturated fatty acids.
- ∗ indicates a significant difference between groups (p < 0.05).
3.4. Intestinal Microbial Diversity Analysis
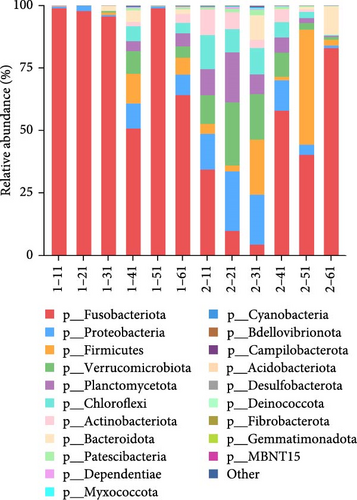
The red tilapia in the cold group exhibited a significantly lower number of amplicon sequence variants (ASVs) compared to the control group. Additionally, the Shannon, Simpson, Chao1, and Ace indices were significantly lower in the cold group than in the control group (p < 0.05; Table 5). The Fusobacteriota was the dominant phylum (84.5%), followed by Proteobacteria (3.7%) and Verrucomicrobiota (2.4%) in the intestinal contents of the cold group fish. In the intestinal contents of the control group fish, the three dominant phyla were Fusobacteriota (38.4%), Proteobacteria (12.6%), and Verrucomicrobiota (11.4%). Figure 1A shows the analysis of intestinal flora composition at the phylum level. The relative abundance of the two groups was significantly different at the phylum level (p < 0.05).
| Parameters | Cold | Control | Significance |
|---|---|---|---|
| Shannon | 6.91 ± 0.15 | 7.84 ± 0.18 | ∗∗ |
| Simpson | 0.98 ± 0.00 | 0.84 ± 0.15 | ∗ |
| ACE | 325.06 ± 35.23 | 505.35 ± 39.19 | ∗∗ |
| Chao1 | 325.01 ± 35.19 | 505.14 ± 39.19 | ∗∗ |
- ∗ indicates a significant difference between groups (p < 0.05). ∗∗ indicates a significant difference between groups (p < 0.01).
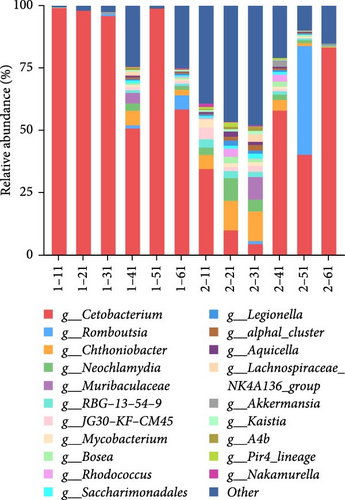
The analysis of the intestinal flora composition at the genus level (Figure 1B) revealed that in the intestinal contents of the cold group fish, Cetobacterium was the dominant genus (83.9%), followed by Chthoniobacter (1.4%) and Neochlamydia (0.7%). In the intestinal contents of the control group fish, Cetobacterium was also the dominant genus (38.6%), followed by Chthoniobacter (6.0%) and Neochlamydia (3.5%). The relative abundance of the two groups was significantly different at the genus level (p < 0.05).
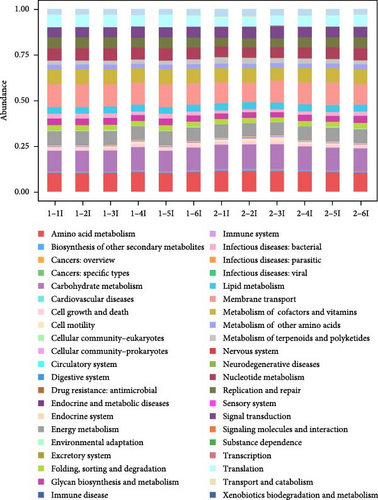
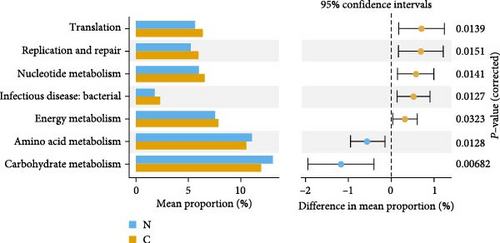
Prediction of intestinal flora function by analysis of effective reads with the Tax4Fun package, and the results are shown in Figure 2A. There were significant differences in the function of intestinal flora in each group (p < 0.05), mainly in translation, replication and repair, nucleotide metabolism, infectious diseases: bacterial, energy metabolism, amino acid metabolism, and carbohydrate metabolism (Figure 2B).
4. Discussion
The economic value of red tilapia is contingent upon its body color, which is influenced by a multitude of factors [22, 23]. In this study the ventral L∗ value of fish in the cold group was significantly lower than that in the control group, indicating that cold stress tends to darken the color of the ventral skin. This finding is consistent with the study results conducted by Pavlidis et al. [7]. Red porgy showed a biphasic response, with a darker dorsal skin area at low (15°C) and high (23°C) WTs and lighter skin at 19°C [7]. The observed difference in skin lightness may be due to increased melanin synthesis (at 15°C) and differences in the motility of the melanophores [7]. Wang et al. [8] compared the effects of different temperatures (16, 20, 25, and 30°C) on apparent color, tyrosinase activity and skin pigment cells of Malaysian red tilapia during the overwintering period and indicated that the color variation may be related to the changes of skin melanocytes and Tyr activity. The synthesis of melanin is a complex process that is regulated by multiple genes. The specific metabolic pathways involved in this process were investigated by Zhu et al. [20]. Further study is required to elucidate the molecular mechanism underlying melanin synthesis in the skin of red tilapia with cold stress during overwintering.
In this study, the cold group demonstrated elevated levels of SOD, MDA, GSH, CAT, and T-AOC in the liver, exhibiting a similar trend in the gill, where SOD, MDA, and GSH were elevated. Antioxidant enzymes such as SOD, CAT, and GSH eliminate reactive oxygen species and maintain their normal levels in cells [25]. Fish increase antioxidant enzyme activity to maintain their antioxidant levels in response to adverse environments [25]. Meanwhile, the concentration of MDA significantly increased, indicating that the organisms were unable to effectively scavenge large amounts of ROS, which resulted in oxidative stress [26, 27]. Differences in liver and gill results may be attributed to varying sensitivities with different tissues to cold stress. In this study, the levels of C3 and C4 were found to be significantly reduced in response to cold stress, indicating that these complement components may play a pivotal role in the immune response [28]. The results implied that acute cold stress may enhance the antioxidant capacity of red tilapia, but impair its immune function for a brief period.
Intestinal microbes play a crucial role in maintaining the overall health of fish by contributing to their growth and immune processes [29]. The composition of intestinal microbes varies depending on the host’s feeding conditions and environmental factors [30]. Our study revealed that the intestinal microbial ASVs of red tilapia in the control group were significantly higher than those in the cold group. This observation may be attributed to the fact that microbial communities tend to thrive in environments with higher WTs [31]. The intestinal microbial composition of tilapia varies seasonally, and low temperature is highly selective for microbiota [32, 33]. The composition of intestinal microbiota in red tilapia is also influenced by food [34]. Therefore, the reduced abundance of intestinal microbes in red tilapia from the cold group may also be caused by the decrease in feeding due to the low temperature.
In this study, there was an elevation in the proportion of the microbial population belonging to the Cetobacterium spp. within the intestinal tract of the cold group fish. Cetobacterium, as a dominant species in the intestines of freshwater fish, is considered a core member of the intestinal microflora of fish such as Nile tilapia, largemouth bass (Micropterus salmoides), and common carp (Cyprinus carpio) [35–37]. Studies have shown that certain species of Cetobacterium microorganisms produce significant amounts of vitamin B12 in specific environments to inhibit harmful bacteria [38]. The fermentation products of Cetobacterium had a protective effect on the organs of carp by reducing fat accumulation in the liver and improving intestinal health [39]. Furthermore, both Cetobacterium and its metabolite, acetic acid, could enhance insulin expression through the stimulation of the parasympathetic nervous system, thereby, leading to an increment in carbohydrate utilization in zebrafish [40]. Xie et al. [39] found that the addition of the fermentation product of Cetobacterium somerae significantly reduced the expression of genes associated with intestinal and hepatic inflammation in common carp. Furthermore, C. somerae was found to enhance zebrafish’s resistance to spring virus of carp (SVCV) infection [41]. These findings underscore the significance of the intestinal microbiota and its metabolites in promoting immune function. The increased relative abundance of Cetobacterium spp. in the gut of red tilapia may be an adaptive strategy to cope with cold stress, thereby, enhancing fish innate immunity and replenishing fish energy overconsumption. The relationship between fish intestinal gut microbiota and immunity is worthy of further study.
Amino acid content is a crucial indicator of flesh quality in fish. It directly affects taste and indirectly contributes to flavor development. It was discovered that overwintering at low temperatures significantly increased the total amount of sweet amino acids (SAA) and umami amino acids (UAAs) in crustacean tissues, and the high concentration of UAAs in the muscle enhances the flavor during overwintering [42]. In this study, the muscle contents of Glu (representing the fresh flavor amino acid), Ala, Thr (representing the sweet flavor amino acid), Met, and Tyr (representing the bitter flavor amino acid) increased in the cold group fish than those in the control fish. This indicates that cold stress may influence the flavor of red tilapia muscle. Meanwhile, the TAA in the muscle of red tilapia in the cold group was also increased in this study. It has been demonstrated that the overwintering of crustaceans at low temperatures results in an elevation of the amino acid content of their tissues [42]. This may be due to replenishment of the free amino acid pool from protein breakdown or reduction in protein synthesis, exceeding the amino acid utilization for development, protein synthesis, and energetic pathways [43–45]. In this study, the TAA elevation indicated that amino acids may serve a pivotal function as energy sources in the muscle of red tilapia during the process of adaptation to lower temperatures.
5. Conclusions
Cold stress affected the skin color, physiological functions, muscle composition, and intestinal microbial composition of red tilapia during overwintering. The L∗ value of fish ventral skin in the cold group decreased. Cold stress changed the immune antioxidant function of the liver and gill tissue of red tilapia. Cold stress also increases the contents of TAAs in fish muscle. Furthermore, cold stress resulted in a decrease in intestinal microbial diversity and changes in the relative abundance of dominant microbiota in the intestine of red tilapia. Further studies are needed to understand the molecular regulatory mechanism of cold stress in red tilapia. The findings of this study will provide a valuable understanding of fish cold stress during overwintering, which will facilitate the breeding of new cold-resistant varieties of red tilapia in the future.
Conflicts of Interest
The authors declare no conflicts of interest.
Funding
This research was funded by Natural Science Foundation of Jiangsu Province (BK20221208) and the Central Public-interest Scientific Institution Basal Research Fund, Chinese Academy of Fishery Sciences (2023TD39 and 2023TD40).
Acknowledgments
This research was funded by Natural Science Foundation of Jiangsu Province (BK20221208) and the Central Public-interest Scientific Institution Basal Research Fund, Chinese Academy of Fishery Sciences (2023TD39 and 2023TD40).
Open Research
Data Availability Statement
The raw data involved in this study are available from the corresponding authors upon reasonable request. Some of the processed data have been presented in the graphs and related analytical content of the paper.


