The Effects of Different Dietary Protein Levels and Feeding Rations on Water Quality and Growth Performance of Pacific White Shrimp (Litopenaeus vannamei) Reared in Individual Biofloc Culture Systems
Abstract
Dietary protein is one of the most expensive feed components and an important determinant in the growth of the Pacific white shrimp (Litopenaeus vannamei). Therefore, understanding the interaction between dietary protein levels and daily protein intake, which drives the shrimp’s growth, is crucial. An 8-week growth trial was conducted to examine the effect of dietary protein levels offered at different percentages of standard ration on water quality and growth response of L. vannamei reared in individual biofloc systems, each containing 800 L of culture water stocked at 88 shrimp/m3. Four diets with crude protein (CP) levels of 25%, 30%, 35%, and 40% fed at the standard feeding rate (100%) were used for this experiment. Additionally, 25% CP and 30% CP diets were also fed at 140% and 116.7%, respectively, of the standard feeding rate (equivalent to 35% CP) as the other two treatments. This resulted in six treatments with four replicates per treatment, which were randomly assigned to the tanks. At the end of the trial, significant differences (p < 0.05) in growth and feed conversion ratio (FCR) were observed. Results showed that the increase in CP content of the feed resulted in an increased final mean weight and weight gain. The shrimp fed with a 40% CP diet at 100% standard ration had the highest final mean weight (15.38 g), weight gain/week (1.61 g/week), weight gain percentage (523.63%), and the lowest FCR (1.26). Whereas feeding lower protein diets at higher rations (25% and 30% CP at 140% and 116.7% of the standard ration, respectively) did not lead to significant growth improvements but resulted in a higher FCR, indicating potential overfeeding. This trial demonstrated that shrimp raised in the biofloc system performed better in terms of growth and feed utilization as protein intake increased.
1. Introduction
Pacific white shrimp (Litopenaeus vannamei) aquaculture has seen significant growth as a major contributor to the global seafood market, with 6.8 million tons of production in 2022 [1]. This species is known for several desirable traits: rapid growth rate, shorter time to market size, tolerance to high stocking densities, adaptability to various environmental conditions (wide range of salinities and temperatures), and robustness against diseases, making it a preferred choice among shrimp farmers [2–4]. However, the sustainability and efficiency of shrimp farming are paramount concerns. In recent years, biofloc technology has gained attention as an environmentally friendly and economically viable approach to shrimp cultivation [5, 6]. This technology, characterized by the development of microbial communities within aquaculture systems, has the potential to maintain suitable water quality, reduce disease risk, and improve nutrient utilization efficiency [7]. Additionally, the consumption of biofloc by shrimp can provide a supplementary nutritional source, further enhancing growth and feed efficiency [8].
Central to the success of shrimp farming is optimizing dietary protein levels, which can influence shrimp growth and nutrient loading to the culture system. Inadequate protein intake (too high or too low) may lead to reduced growth rates and compromised feed conversion efficiency. It can also contribute to the loading of nitrogenous waste compounds (at higher protein levels), such as ammonia and nitrite, which can deteriorate water quality and jeopardize system stability [7, 9]. Biofloc systems utilize organic carbon sources (e.g., molasses, feed residues, and microbial biomass) to promote bacterial growth, which aids in ammonia removal and nutrient cycling [10]. Inorganic carbon sources (e.g., bicarbonates and lime) play a crucial role in buffering pH and supporting microbial processes, ensuring a stable environment for biofloc development [11]. Effective carbon management in biofloc systems involves balancing both carbon inputs with nitrogen levels to optimize microbial composition and maintain stable water parameters [12]. The absence of a clear understanding of the effects of different levels of dietary protein on Pacific white shrimp growth and water quality in biofloc systems poses significant challenges for shrimp farmers seeking to optimize production while minimizing environmental impacts. Addressing this knowledge gap is crucial to developing precise feeding strategies that enhance shrimp growth, maximize resource utilization, and maintain sustainable water quality within biofloc-based aquaculture systems.
Dietary protein is a fundamental factor influencing shrimp growth, health, and overall production efficiency. The level of dietary protein in shrimp feed has traditionally been an essential consideration in aquaculture management. However, in the context of biofloc systems, the interaction between dietary protein levels, feed input, shrimp growth, and water quality is a complex and dynamic process that warrants in-depth investigation [13]. Protein constitutes a substantial proportion of feed production costs, often exceeding 50% [14]. This expense not only impacts the economic sustainability of shrimp farming but also raises environmental concerns depending on the sourcing of protein sources, which vary in terms of land, water, and energy use [15, 16] and may contribute to overfishing and deforestation [17].
In commercial shrimp farming, providing an appropriate protein-to-energy ratio in the diet is essential to achieve optimal growth rates and minimize feed conversion ratios (FCRs)[18]. Failure to meet the protein requirement can result in stunted growth, reduced survival, and increased susceptibility to diseases, ultimately compromising the economic viability of shrimp farming operations [19, 20]. Numerous studies have explored the dietary protein requirements of Pacific white shrimp, particularly in traditional culture systems [21–23]. These studies have provided valuable insights into the protein needs of the species at different life stages. However, as biofloc technology presents a unique culture environment characterized by the presence of microbial flocs that serve as both a food source and a water quality management tool [24], it is crucial to investigate how varying dietary protein levels affect shrimp growth and water quality within this context.
Shrimp perform better as slow and continuous feeders when fed several small meals throughout the day [25–27]. More frequent feeding reduces nutrient loss due to leaching, as the division of the feed into more portions results in less waste [28]. In addition to the feeding frequency, feeding rates, that is, how much feed is provided, are also important. One often overlooked component is the interaction between dietary nutrient profile and feeding rates. Previous studies have shown feeding rates can significantly affect the growth performance of many aquatic species, even when using the same diet formulation [26, 29, 30].
Given the various factors that can influence shrimp’s ability to utilize nutrients from feed effectively, the objective of this study was to evaluate the influence of different levels of crude protein (CP) when offered at different feeding rates on shrimp growth, feed utilization, and its concurrent impact on water quality within an indoor static biofloc system.
2. Methods
2.1. Experimental Setup
An 8-week growth trial was conducted at E. W. Shell Fisheries Research Center, Auburn University, Auburn, AL, USA. Twenty-four blue polyethylene tanks (800 L working volume; 0.8 m flat bottom surface) were used in the experiment. Each tank was filled with dechlorinated freshwater; manufactured sea salt (Crystal Sea Marinemix, Baltimore, MD, USA) was then dissolved into the water to maintain the salinity at 13 ppt. Dissolved oxygen (DO) was maintained near saturation (>5 mg/L) using four air stones (7.62 cm, 0.35 cubic feet per minute) in each culture tank connected to a common airline and a regenerative blower (Gast Regenerative Blowers, T063ZZDER1692, 1.5 HP each). Once the system was stabilized, it was inoculated (15%–20% of total system volume) with a biofloc culture from an ongoing system (used to culture Pacific white shrimp at 10 ppt salinity running for 6 weeks. No water exchange was performed throughout the trial, but water lost in each tank due to evaporation was replaced periodically with dechlorinated fresh water. Efforts were made to maintain pH above 7 and alkalinity above 100 mg/L. When pH and alkalinity dropped below these values, hydrated lime was added to the tanks to raise their values.
Postlarvae (PL16; 0.008 g) of the Pacific white shrimp were obtained from Homegrown shrimp (Indiantown, FL, USA) and temporarily maintained in an indoor biofloc nursery system (volume of 3750 L). Post-larvae were acclimatized slowly (5–6 h acclimation time) to the biofloc nursery, ensuring no abrupt changes in temperature, pH, and salinity. Post-larvae were fed with Zeigler PL Raceway Plus (Zeigler Bros. Inc. Gardners, PA, USA; protein ≥50%, fat ≥15%, fiber ≤1%) initially and then transitioned to 1.5-mm crumbled Zeigler PL Raceway (Zeigler Bros. Inc., Gardner, PA, USA; protein ≥40%, fat ≥9%, fiber ≤3%) until they reached an appropriate size (2.46 g) for stocking. Each of the 24 tanks was stocked at a density of 88 shrimp/m3 or 70 shrimp per tank. After stocking, the water was recirculated using a common fiberglass sump tank and circulation pump for 7 days to allow consistent mixing. Then, the circulation was closed, and the tanks were managed as static systems.
Diets were formulated by incorporating soybean meal and poultry by-product meal as the main protein sources [22], resulting in the development of four practical diets featuring distinct CP contents (25%, 30%, 35%, and 40%). These diets were manufactured by Ziegler, Inc. (Gardner, PA, USA) as extruded sinking feed (except 25% CP feed) and used throughout the 8-week growth trial. The proximate composition and amino acid profile of the four diets have been reported by Strebel et al. [22]. Diets with CP levels of 25%, 30%, 35%, and 40% fed at the standard feeding rate (100% ratio) were used as the standard diets for this experiment. The 25% CP and 30% CP diets were also fed at 140% and 116.7% of the standard ration, respectively, which is a delivered protein equivalent to 35% CP at 100% ration. This resulted in six treatments (Table 1) with four replicates per treatment. The daily feed amount (100% ration) was calculated by:
| Treatments | Crude protein (%) | Standard ration (%) | aProtein equivalence (%) |
|---|---|---|---|
| 25 (25/100) | 25 | 100 | 25 |
| 30 (30/100) | 30 | 100 | 30 |
| 35 (35/100) | 35 | 100 | 35 |
| 35 (25/140) | 25 | 140 | 35 |
| 35 (30/116.7) | 30 | 116.7 | 35 |
| 40 (40/100) | 40 | 100 | 40 |
- aProtein equivalence = crude protein (%) × standard ration (%).
An FCR of 1.2 [3, 31, 32] was used throughout the trial, with an assumption of 100% survival, and expected growth was determined by the weekly sub-sampling (group weight of 15 shrimp/tank) of one replicate tank per treatment (the same replicate tank from each treatment was sampled every week). When sampling, all treatments were treated the same way: the means of all sampling data were used to establish the average weekly growth, and predicted growth was estimated based on both historical and current results [32]. The allotted daily feed was offered in the morning via handfeeding and the rest of the day through 24-h belt feeders, as shrimp are slow, continuous feeders and benefit from being fed multiple small feedings throughout the day [25–27].
2.2. Determination of Water Quality Parameters
Temperature (⁰C), DO (mg/L), and salinity (ppt) were recorded in each tank twice daily, morning (0800–0815) and afternoon (1600–1615) throughout the experimental period using YSI Pro2030 (Yellow Springs, OH, USA). Likewise, pH was measured twice weekly using a YSI pH 10A (Yellow Springs, OH, USA). For weekly measurements of TAN (mg/L), nitrite (mg/L), and alkalinity (mg/L), water samples were collected from each tank and filtered through 47 mm filter paper (Cytiva Whatman 42, CAT No. 1442–047). Reagents were added to filtered water and read using a YSI photometer 9500 kit (YSI, Yellow Springs, OH, USA) according to the manufacturer’s instructions. To measure total solids (g/L), 20 mL water samples were collected from each tank and vacuum filtered through 47 mm filter paper (Cytiva Whatman 42, CAT No. 1442–047). The filtered paper was then dried in an oven at 60 ⁰C for 24 h. Then, the filter paper was weighed to determine the levels of total solids present in each tank [32].
2.3. Growth Performance
2.4. Statistical Analysis
The statistical analyses were performed using SAS (V9.4, SAS Institute, Cary, NC, USA) using individual tanks as replicates. Growth performance data were analyzed using one-way ANOVA, with all assumptions met, to determine statistically significant differences (p < 0.05) among treatments, followed by Tukey’s multiple comparison tests to evaluate significant differences between treatment means. All water quality data were analyzed using time series analysis, with all assumptions met.
3. Results
3.1. Growth Performance
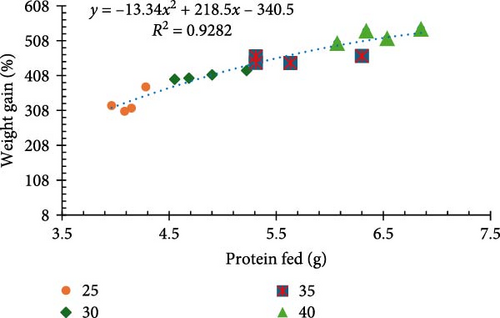
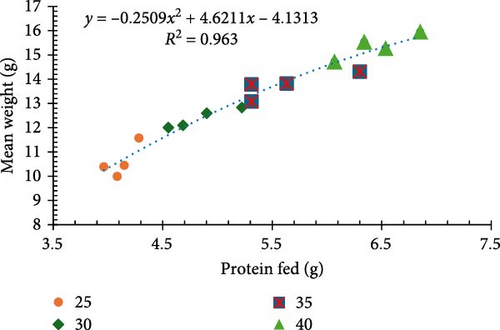
Results for final biomass, final mean weight, survival, weight gain, weight gain/week, FCR, and feed cost/kg of shrimp are presented in Table 2. Survival rates exhibited no significant differences (p > 0.05) among treatments, staying within a favorable range of 94%–98%. All other performance parameters were significantly different between treatments (p < 0.05). Shrimp raised on a diet comprised of 40% CP at a standard ration demonstrated significantly better growth performance, evidenced by the highest recorded biomass (1013.9 g), mean weight (15.38 g) (Figure 1a), and weight gain (523.63%) (Figure 1b).
| Protein (feed rate) | Final biomass (g) | Final mean weight (g) | Survival (%) | Weight gain (%) | Weight gain/week (g) | FCR | Feed cost/kg of shrimp ($) | ANPR (%) | PR (%) |
|---|---|---|---|---|---|---|---|---|---|
| 25 (25/100) | 682.88d | 10.60d | 92.14 | 329.29d | 1.02d | 2.09b | 2.37b | 37.12bc | 13.37bc |
| 30 (30/100) | 816.07c | 12.38c | 94.29 | 407.73c | 1.24c | 1.65c | 2.06c | 41.95ab | 16.95b |
| 35 (35/100) | 909.33b | 13.75b | 94.65 | 453.99b | 1.41b | 1.45cd | 1.94cd | 46.22a | 21.84a |
| 35 (25/140) | 745.23cd | 10.91d | 97.62 | 337.11d | 1.05d | 2.57a | 2.99a | 25.37d | 12.43c |
| 35 (30/116.7) | 811.63c | 12.18c | 95.36 | 403.12c | 1.22c | 1.93b | 2.41b | 33.79c | 16.48b |
| 40 (40/100) | 1013.90a | 15.38a | 94.29 | 523.63a | 1.61a | 1.26b | 1.82d | 41.51ab | 23.20a |
| PSE | 16.05 | 0.25 | 2.73 | 9.06 | 0.03 | 0.05 | 0.04 | 1.33 | 0.78 |
| p-Value1 | <0.0001 | <0.0001 | 0.8655 | <0.0001 | <0.0001 | <0.0001 | <0.0001 | <0.0001 | <0.0001 |
- Note: Values represent the means of four replicates.
- Abbreviations: ANPR, apparent net protein retention; FCR, feed conversion ratio; PR, phosphorous retention; PSE, pooled standard error.
- 1One-way ANOVA, followed by Tukey’s multiple comparison tests to evaluate significant differences between treatment means. Superscript letters denote a significant statistical difference between treatments.
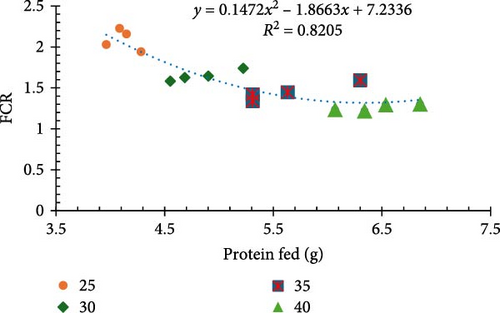
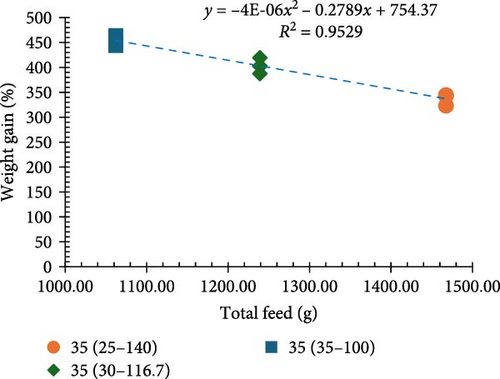
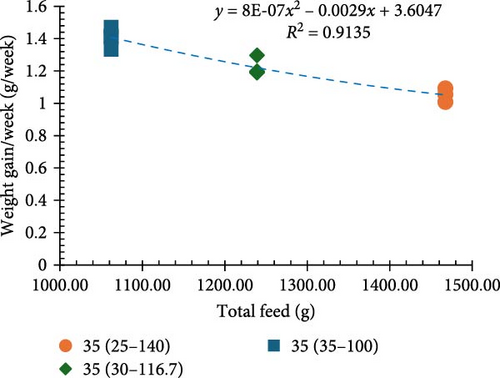
Incremental increases in protein content (25%–40% CP at 100% ration) led to proportional improvements in growth metrics (final biomass, final mean weight, weight gain percentage, and weight gain/week). However, when 25% CP was fed at a 140% ration and 30% CP was fed at a 116.7% ration (equivalent to 35% CP), the values for these growth metrics were not equivalent and resulted in poor growth performance (Figure 2a,b). Notably, a significant inverse relationship was noted between protein levels and the FCR in that higher protein content resulted in more significant efficient utilization of the provided feed (p < 0.05; Figure 1c).
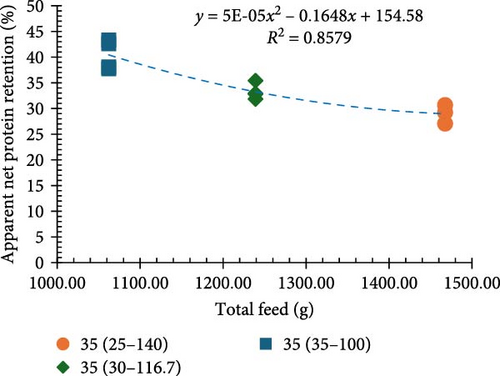
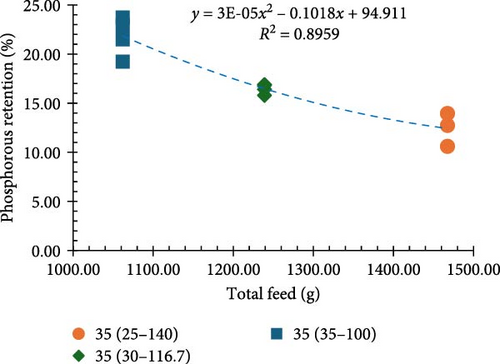
Among all the treatments, higher apparent net protein retention (ANPR) was observed at 30%, 35%, and 40% CP treatments fed at a 100% ration (38.99%, 40.44%, and 38.74%, respectively). Lower values of ANPR were observed at 25% CP fed at 140% ration (27.68%) (Figure 2c). As the feed ration went up from 100% to 140%, there was a significant decline in the phosphorous retention (PR), with higher values observed at 30%, 35%, and 40% CP treatments fed at 100% ration (18.52%, 20.40%, and 23.29%, respectively) and lower observed at 25% CP fed at 140% ration (11.46%) (Figure 2d).
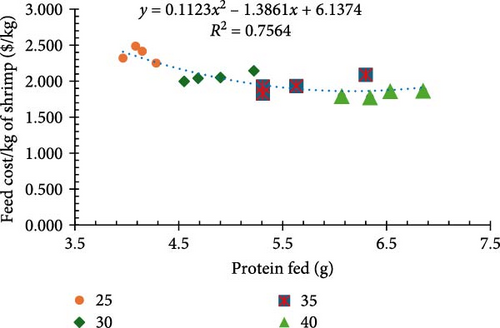
The feed cost per kilogram of shrimp varied significantly between treatments (p < 0.05) and highlighted the economic considerations of protein intake and feed rate (Figure 1d). The 25% protein diet at the 140% feeding rate resulted in the highest cost ($2.99/kg of shrimp), while the 40% protein diet at the standard rate achieved the lowest cost ($1.82/kg of shrimp). Conversely, the alternative feeding strategies, 30% CP fed at 116.7% ration with 35% protein equivalence, incurred higher feed costs per kilogram ($2.41/kg of shrimp).
3.2. Water Quality
Table 3 displays the results for water temperature, morning and afternoon DO, salinity, pH, ammonia (TAN), nitrite, total solids, and alkalinity. Significant differences among treatments were noted for morning DO, temperature, and pH (p < 0.05). The highest morning DO levels were observed in the 25% CP treatment at 100% ration, while the 25% CP treatment at 140% ration had the lowest morning DO. Treatments with higher protein levels and feeding rates exhibited slightly lower pH values.
| Treatments (protein/feed rate) | Morning DO (mg/L) | Afternoon DO (mg/L) | Temperature (⁰C) | Salinity (ppt) | pH | TAN (mg/L) | Nitrite (mg/L) | Total solids (g/L) | Alkalinity |
|---|---|---|---|---|---|---|---|---|---|
| 25 (25/100) |
|
|
|
|
|
|
|
|
|
| 30 (30/100) |
|
|
|
|
|
|
|
|
|
| 35 (35/100) |
|
|
|
|
|
|
|
|
|
| 35 (25/140) |
|
|
|
|
|
|
|
|
|
| 35 (30/116.7) |
|
|
|
|
|
|
|
|
|
| 40 (40/100) |
|
|
|
|
|
|
|
|
|
| PSE | 0.15 | 0.14 | 0.55 | 0.85 | 0.11 | 0.10 | 0.25 | 0.12 | 14.32 |
| 1Type-III p-Value | <0.0001 | 0.2710 | <0.0001 | 0.086 | <0.0001 | 0.326 | 0.8675 | <0.0001 | 0.0007 |
- Note: Values are shown as the mean ± standard error and represent the means of four replicates. The range (minimum–maximum value) for each parameter is shown in parentheses.
- Abbreviations: DO, dissolved oxygen; PSE, pooled standard error; TAN, total ammonia nitrogen.
- 1Repeated measures mixed-effects ANOVA, followed by Tukey’s multiple comparison tests to evaluate significant differences between treatment means. Superscript letters denote a significant statistical difference between treatments.
No significant differences were observed for afternoon DO, salinity, ammonia (TAN), and nitrite (p > 0.05). Total solids and alkalinity values exhibited significant differences between treatments (p < 0.05). The treatment with 40% CP exhibited the lowest total solids levels, while the 25% CP treatment at 140% ration showed the highest levels. The highest alkalinity was observed in the 30% CP treatment at a 100% ration, while the 40% CP treatment and 30% CP treatment at a 116.7% ration had the lowest alkalinity.
3.3. Proximate Composition
Table 4 displays the treatment means for all values in the proximate composition analysis of the shrimp’s whole body. Aside from protein, sulfur (S), and copper (Cu), all whole-body composition variables, including moisture, fiber, ash, potassium (K), magnesium (Mg), calcium (Ca), sodium (Na), iron (Fe), manganese (Mn), and zinc (Zn) showed no significant difference between treatments (Table 4). The shrimp whole body with 25% CP treatment fed at a 100% ration had the lowest protein content, and the shrimp whole body with 40% CP treatment fed at a 100% ration had the highest protein content. The shrimp whole body with 40% CP treatment fed at 100% ration showed the highest S percentage at 0.82%, while the shrimp whole body with 25% CP treatment fed at 140% ration displayed the lowest S content at 0.69%. The shrimp whole body with 40% CP treatment fed at 100% ration exhibited the highest Cu concentration, while the shrimp whole body with 30% CP treatment fed at 116.7% ration had the lowest.
| Treatments (protein/feed rate) | Moisture (%1) |
Protein (%) | Fat (%) | Ash (%) | S (%) | P (%) | K (%) | Mg (%) | Ca (%) | Na (%) | Fe (ppm) | Mn (ppm) | Cu (ppm) | Zn (ppm) |
|---|---|---|---|---|---|---|---|---|---|---|---|---|---|---|
| 25 (25/100) | 76.20 | 76.67b | 3.25 | 13.33 | 0.68b | 1.32 | 1.33 | 0.27 | 3.54 | 0.95 | 19.33 | 3.25 | 142.00ab | 68.10 |
| 30 (30/100) | 75.69 | 78.93ab | 2.63 | 13.53 | 0.72b | 1.31 | 1.40 | 0.27 | 3.36 | 0.99 | 20.00 | 2.98 | 137.00ab | 69.70 |
| 35 (35/100) | 75.55 | 79.72ab | 2.80 | 13.23 | 0.76ab | 1.29 | 1.39 | 0.27 | 3.59 | 1.01 | 19.55 | 3.15 | 138.75ab | 71.50 |
| 35 (25/140) | 75.17 | 78.07ab | 2.27 | 13.00 | 0.69b | 1.29 | 1.34 | 0.26 | 3.35 | 0.93 | 19.33 | 2.97 | 124.00ab | 68.57 |
| 35 (30/116.67) | 75.35 | 78.00ab | 2.55 | 13.35 | 0.69b | 1.30 | 1.37 | 0.27 | 3.55 | 0.93 | 17.68 | 2.80 | 122.00b | 67.55 |
| 40 (40/100) | 76.01 | 79.82a | 2.70 | 13.13 | 0.82a | 1.33 | 1.40 | 0.28 | 3.67 | 1.04 | 26.10 | 4.05 | 157.50a | 74.40 |
| PSE2 | 0.43 | 0.66 | 0.345 | 0.295 | 0.02 | 0.03 | 0.04 | 0.01 | 0.141 | 0.035 | 3.61 | 0.335 | 7.36 | 2.095 |
| p-Value3 | 0.5866 | 0.0330 | 0.5559 | 0.8754 | 0.0009 | 0.9316 | 0.6923 | 0.5338 | 0.5911 | 0.2347 | 0.6610 | 0.1802 | 0.0427 | 0.2432 |
- Note: Values represent the means of four replicates.
- 1Expressed on as is basis.
- 2Pooled standard error.
- 3One-way ANOVA, followed by Tukey’s multiple comparison tests to evaluate significant differences between treatment means. Superscript letters denote a significant statistical difference between treatments.
4. Discussion
Understanding the relationship between dietary protein levels and feeding rates is essential for optimizing shrimp growth and feed efficiency. To ensure nutrient requirements are met, it is essential to maintain an adequate daily intake of the nutrient. Therefore, a clear relationship exists between nutrient density and feed management or daily intake. In marine shrimp farming, providing the correct daily amount of protein is essential for an effective feed management plan. It is a key factor in promoting optimal growth and efficient feed use [33, 34]. In this study, the authors explored how different levels of CP and feed ration influenced shrimp performance in indoor static biofloc systems. Feed input was carefully controlled, with rations standardized at either 100% or adjusted to provide equivalent protein intake to that of the 35% diet at 100% ration.
Simply comparing the results of shrimp offered the 100% ration, the authors observed a progressive elevation in both final biomass and final mean weight as dietary protein levels increased, reaching up to 40% CP. Increasing protein levels in this research demonstrated a corresponding rise in weight gain, underscoring the significance of protein in facilitating growth. This observation is consistent with prior research that emphasized the positive influence of protein on shrimp growth, as documented by Talukdar et al. [35]. These authors evaluated the effect of 24%, 26%, 28%, 30%, 32%, and 34% CP levels of diet at 100% ration on the growth of Pacific white shrimp reared in tanks filled with inland saline water (8 ppt). They found that final body weight increased with increased CP levels, with the highest final body weight (11.33 g) recorded at 32% CP and the lowest (8.17 g) at 24% CP. Also, weight gain (%) was highest (148.10%) at higher protein levels (34% CP) and lowest (76.99%) at lower protein levels (24% CP). Elsayed et al. [36] similarly identified an optimal protein level for maximizing shrimp growth in tanks filled with seawater (20 ppt). This affirms the well-established principle that protein serves as a vital component for tissue synthesis and metabolic processes, thereby playing a crucial role in driving growth and development in shrimp, as outlined by De Silva and Anderson [37].
However, for the observed results of this trial, when lower protein diets were used, and the ration was adjusted (25/140%, 30/116.7%, and 35/100%) to deliver an equivalent protein level (35% CP), shrimp responded negatively to the increased feed inputs. In fact, comparing the final weight for shrimp offered the 25% and 30% protein diets at higher feed inputs, there was no significant increase in growth when feed was increased. Additionally, the increased ration resulted in increased FCR. These results suggest that there may be a problem with potential overfeeding. This response differed from what was expected and observed in other feeding trials [23, 38, 39], where the authors produced the same results across a range of proteins when protein intake was standardized. However, in this trial, FCR and ANPR values were considerably poorer than in the aforementioned studies. It is assumed that, in this case, the shrimp were not capable of consuming all of the feed, which reduced nutrient intake, and most likely, the leftover feed degraded water quality, evidenced by the significantly higher levels of total solids in these treatments. This resulted in poorer performance as protein was reduced and ration increased. Overfeeding can be a serious problem since it can cause feed waste, which diminishes water quality and consequently causes shrimp to grow poorly [25]. These results demonstrate the need to balance nutrient levels of the diet and feed inputs.
This study reported no significant differences in survival across treatments, suggesting that the diverse protein levels and feeding rates did not have an adverse effect on shrimp survival throughout the 8-week trial. These findings are similar to those obtained by Lee and Lee [20], Strebel et al. [22], Araujo et al. [23], and Talukdar et al. [35], who found no significant effects of varying protein levels on survival.
In this work, the authors noted a significant decline in FCR as protein levels increased, which was expected and is consistent with other studies such as Araujo et al. [23] and Xia et al. [40]. The lower FCR values associated with higher protein levels (40% CP at 100% ration) suggest that increasing protein content in the diet can lead to more efficient feed utilization and better growth. This illustrates that diets with higher protein content enhance feed utilization efficiency, which may lead to reduced feed costs per kilogram of shrimp produced. A similar trend in FCR was observed by Talukdar et al. [35], where they conducted a growth trial with Pacific white shrimp (4.5 ± 0.4 g). They evaluated the growth performance of shrimp at 24%, 26%, 28%, 30%, 32%, and 34% CP fed at standard ration (100%) and found that the shrimp had the lowest FCR of 1.71 at 34% CP and the highest FCR of 2.76 at 24% CP.
The findings of the feed cost per kilogram of shrimp in this trial align with the findings of Elsayed et al. [36], who observed a decrease in the feed cost per kilogram of shrimp with escalating protein levels until reaching a point of diminishing returns. However, some studies suggest that the economic benefits of higher protein diets may be offset by higher feed costs [9]. While the 40% CP diet at the standard feeding rate resulted in the lowest feed cost per kilogram of shrimp despite potentially higher feed costs, alternative feeding strategies (feeding 25% CP at a 140% ration and 30% CP at a 116.7% ration) incurred higher costs. This suggests that, despite potentially higher costs associated with the feed itself, the efficient feed utilization and substantial growth achieved with the 40% CP diet at a 100% ration resulted in more economical production of shrimp biomass.
The proximate composition data showed that protein levels had a considerable influence on both ANPR and PR. Shrimp fed diets with 30%, 35%, and 40% protein at a 100% ration displayed higher ANPR and PR compared to those offered diets with 25% protein at a 100% ration. This indicates a positive relationship between higher protein levels and improved nutrition retention, implying increased growth potential. The 25% protein diet limited the amount of protein and energy available for shrimp consumption, as the shrimp would need to eat a higher amount of this lower-protein feed to achieve the same protein intake as those fed diets with 30%, 35%, or 40% protein [41]. Conversely, shrimp fed 25% and 30% CP diets at 140% and 116.7% of the standard ration, respectively (matching the protein intake of a 35% CP diet), had notably lower ANPR and PR, as growth could have been impacted by overfeeding of shrimp in these treatments. Overfeeding can lead to nutrient waste and increased excretion of nitrogenous and phosphorus compounds, which in turn reduces the efficiency of feed utilization and growth performance [42, 43]. These findings suggest that overly high rations of lower CP diets leading to higher nutrient loading may reduce nutrient utilization, reinforcing the idea that the balance between protein levels and ration is critical for optimum growth performance [44, 45].
Water quality parameters were within the suitable ranges for shrimp growth throughout this trial [46, 47]. Higher protein levels and feeding rates were associated with slightly lower pH and alkalinity values. Higher protein content in the feed may stimulate microbial growth and activity in biofloc systems [48, 49]. Microbial metabolism can consume alkalinity as they utilize carbon sources and produce organic acids, which can decrease alkalinity and pH. As different CP content diets were being offered, yielding different nitrogen loading for each treatment, fluctuations in alkalinity consumed for assimilation of nitrogenous waste, and ultimately, fluctuations in pH were observed between the treatments. While all treatments maintained DO within acceptable ranges, minor fluctuations were detected, with lower DO levels linked to higher protein levels and feeding rates. Lower DO levels in treatments with higher protein intake could be potentially attributed to heightened shrimp metabolic activity, heightened nitrification of ammonia, and increased oxygen consumption by both shrimp and bacteria [50]. The authors observed no significant differences in ammonia (TAN) and nitrite levels across treatments. Based on these water quality results, the biofloc system effectively managed nutrient loading and nitrogenous waste products in the experiment [7, 50].
Altering protein content in the diet and shifting feed rates may impact the proximate composition of the shrimp. The difference in protein content between treatments, as determined by shrimp whole-body compositions, was likely due to protein comprising the main building block of muscle tissue. Shrimp fed a higher protein diet could have had more muscle growth, as supported by the findings of the final biomass of this study. Additionally, the role of essential trace elements such as Cu and S must also be considered when evaluating the overall nutritional status of the shrimp. Cu is a trace element essential for numerous physiological processes in animals, including mitochondrial respiration, regular cell growth and development, antioxidant defense, as well as the biosynthesis of melanin and pigmentation [2]. S is an essential component of certain amino acids, vitamins, and coenzymes in aquatic organisms [51]. The variations in Cu and S levels between treatments suggest that the different protein intake levels may have influenced the body composition of juvenile shrimp [52], impacting their overall nutritional status and potentially affecting growth and metabolic processes.
5. Conclusion
The findings of this study emphasize the crucial role of balancing protein levels and feeding rates to optimize growth performance and feed efficiency in juvenile shrimp cultured in static biofloc systems. Increasing protein content up to 40% CP significantly enhanced growth and improved nutrient utilization (ANPR and PR). Alternative feeding strategies that involved higher rations (25% and 30% CP at 140% and 116.7% of the standard ration, respectively) failed to achieve the same growth performance as 30%, 35%, and 40% CP fed at 100% ration. This could be because overfeeding resulted in inefficient feed and nutrient utilization. The findings of this study suggest that shrimp diets that incorporate protein levels within the 35%–40% CP range offer a well-balanced solution for commercial producers, effectively addressing both performance and cost considerations. Ultimately, the ideal approach necessitates considering all growth parameters, economic factors, and potential environmental implications to fine-tune protein and feeding regimes to optimize commercial shrimp aquaculture practices.
Ethics Statement
The experiments comply with the Auburn University Animal Care and Use Committee.
Disclosure
The reference to trade names or commercial products in this study is solely for the purpose of providing specific details and should not be interpreted as an endorsement. This study was previously presented at the Aquaculture America 2023 conference (https://www.was.org/Meeting/Program/PaperDetail/160397).
Conflicts of Interest
The authors declare no conflicts of interest.
Funding
This work was supported by the United Soybean Board (USB) Project #2240-352-0501, the United States Department of Agriculture-Agriculture Research Service (USDA-ARS) Specific Cooperative Agreements #58-6010-0-007, as well as the Institute of Food and Agriculture Hatch Program (ALA016-08027 and ALA016-1-19053).
Acknowledgments
The authors would like to thank all students, staff, and faculty from Auburn University who helped make this project possible.
Open Research
Data Availability Statement
The data that support the findings of this study are available from the corresponding author upon reasonable request.


