Synbiotic Supplementation Boosts Growth, Gut Health, and Immunity in Asian Fossil Catfish (Heteropneustes fossilis)
Abstract
This study explores the effects of synbiotics on growth, intestinal health, and immunity in the Asian fossil catfish (Heteropneustes fossilis), a crucial species in Southeast Asian aquaculture. With the rising use of antibiotics in aquaculture, which poses risks to both the environment and consumer health, there is an urgent need for sustainable alternatives. This study investigates how synbiotics—combinations of probiotics and prebiotics—can enhance fish health and performance. Four dietary treatments with varying synbiotic concentrations (0%, 4%, 6%, and 8%) were tested over 45 days. Results indicated that synbiotic supplementation significantly improved growth metrics, including final weight and specific growth rate (SGR), with the highest benefits observed at 8% inclusion. Additionally, dietary synbiotics enhanced intestinal health by increasing villi height and width and crypt depth and positively affected hematological parameters, notably elevating hemoglobin (Hb) levels. Histological analysis revealed improved liver tissue organization and hepatocyte morphology with higher synbiotic concentrations. These findings suggest that synbiotics offer substantial benefits for fish growth, health, and immunity, positioning them as a viable, ecofriendly alternative to antibiotics in aquaculture. Further research should aim to refine synbiotic formulations and investigate their underlying mechanisms to optimize their application in sustainable aquaculture practices.
1. Introduction
The Asian fossil catfish (Heteropneustes fossilis) is a key species in aquaculture, extensively farmed throughout Southeast Asia, including Bangladesh. Intensification of aquaculture production is one strategy to improve efficiency, but it can also increase the vulnerability of cultured organisms due to deteriorating water quality and elevated stress levels. The intensive culture of catfish, for example, has been linked to disease outbreaks [1]. While catfish aquaculture has rapidly expanded, it faces several challenges, including widespread epizootics, poor feed efficiency, suboptimal growth, and high mortality rates, all of which contribute to the overall decline in aquaculture performance [2]. Among the most significant concerns in the industry are poor growth and the development of drug-resistant pathogens, which undermine efforts to enhance growth, survival rates, feed efficiency, and disease resistance in aquatic organisms. Traditionally, antibiotics have been incorporated into aquafeeds to prevent or treat bacterial infections in aquatic animals. Research has shown that antibiotics can improve growth and feed efficiency by disrupting intestinal microflora, thereby enhancing amino acid utilization in some animal species [3]. However, the use of antibiotics in aquaculture carries several risks, including the development of antibiotic-resistant bacterial strains, disruption of environmental microbial communities, immune suppression, and the potential for antibiotic residues to accumulate in cultured organisms, which poses a risk to human consumers [4]. Therefore, safe and ecofriendly alternatives are crucial to mitigate the adverse effects of antibiotics [5, 6].
In this context, dietary supplements such as probiotics, prebiotics, synbiotics, and immune stimulants have gained significant attention. Synbiotics, a relatively new concept in aquaculture, combine probiotics and prebiotics to improve growth performance by optimizing the use of carbohydrates, proteins, and energy [7]. These functional additives help reduce mortality by enhancing disease resistance, antagonizing pathogens, and promoting a healthy microbial balance in the gut [8]. Synbiotics are a combination of nondigestible food ingredients (prebiotics) and live microorganisms (probiotics), designed to form a symbiotic relationship that benefits the host organism. In aquaculture, synbiotics refer to nutritional supplements that combine both probiotics and prebiotics to enhance the health and performance of aquatic organisms. This innovative concept is still under investigation, with further research needed to fully understand its effects on aquatic species. Probiotics are live microorganisms, such as bacteria, yeast, or algae that provide health benefits to the host by improving its intestinal balance [9]. Prebiotics, on the other hand, are nondigestible food ingredients that selectively stimulate the growth and activity of beneficial bacteria in the colon [10]. Studies have shown that certain intestinal microbial species can positively influence fish growth [11] and that dietary composition can impact the intestinal microflora of fish [12–15].
Dietary supplements, including synbiotics, are typically added in small amounts to address nutritional deficiencies and promote growth, health, and welfare in farmed fish. The primary goal of using synbiotics is to enhance the health of the host and boost its growth rate. Research has demonstrated that synbiotics can offer a range of benefits in aquaculture, including improved growth performance, immune stimulation, gastrointestinal microbial balance, biological control of pathogens, and enhanced water quality management [5, 7, 16–19]. To address this, we evaluated the impact of synbiotic supplementation on growth performance and hematological, biochemical, and histological parameters of the intestine and liver in the Asian fossil catfish.
2. Materials and Methods
2.1. Preparation of Synbiotics
To prepare the synbiotics, a mixture of 500 mL milk, 5 g yeast, 7.5 g NaCl (to maintain osmotic balance and enhance palatability), 50 g molasses (a natural sugar source to promote microbial growth and fermentation), and 5 g wheat bran (a prebiotic source to stimulate beneficial gut bacteria) was added to a plastic container. Additionally, a total of 2.5 g of probiotics were sourced from a well-established commercial supplier (Aua-Life S, Naphavet Com. Ltd., Vietnam), ensuring the quality and viability of the strains. The probiotic blend included a variety of microorganisms: Lactobacillus acidophilus, Enterococcus sp., Bacillus sp., Rhodococcus sp., Bacillus subtilis, Bacillus coagulans, Bacillus pumilus, Bacillus licheniformis, Bacillus megaterium, Bacillus polymyxa, Bacillus mesentericus, and Saccharomyces cerevisiae, along with an enzyme complex. As for the preparation, the probiotics were obtained in a lyophilized form to maintain strain viability. Before supplementation, the lyophilized probiotics were rehydrated in a sterile saline solution, ensuring a viable concentration of live microorganisms was included in the feed. The mixture was filled with water up to 1 L, stirred thoroughly with a long spoon, and then sealed. It was kept at room temperature for 3 days with continuous aeration. After the incubation, suspensions were transferred into three airtight bottles using filter paper. Additionally, a small sample was taken for microbial counting. Bacterial colonies were counted on MRS agar plates (HiMedia M641) and recorded as colony-forming units (CFUs/mL). The synbiotic growth was measured at 3.09 × 10⁸ CFU/mL based on the bacterial count.
2.2. Experimental Diets
Four experimental diets were formulated based on the guidelines of Islam et al. [20]. A commercial basal fish feed (38% protein, Spectra Hexa Feeds Ltd.) was mixed with freshly cultured synbiotics at four different inclusion levels: T1 (control) without synbiotics, T2 with 4% synbiotics, T3 with 6% synbiotics, and T4 with 8% synbiotics. Each treatment was replicated three times. The basal diet comprised fish meal, soybean meal, wheat bran, rice bran, mustard oil cake, and a mineral–vitamin premix. Prepared feeds were air-dried at room temperature and stored in airtight plastic bags until further use.
2.3. Experimental Procedures
Juveniles of Asian fossil catfish (H. fossilis) were sourced from a local private hatchery in Mymensingh and housed in a concrete tank measuring 2.5 × 3.5 × 1.5 m. They were fed a basal diet with 38% protein twice daily for 2 weeks at a rate of 5% of their body weight (BW) to acclimate to the pelleted feed (0.5 mm). Following this acclimation period, fish averaging an initial weight of 5.7 ± 0.61 g were distributed into 12 plastic containers, each measuring 60 × 30 × 30 cm and containing 90 L of water, with 80 fish per container. The containers were grouped into four treatments: the first group served as the control, while the second, third, and fourth groups received diets supplemented with 4%, 6%, and 8% synbiotics, respectively. During the experiment, fish were fed at a rate of 5% of their BW. To monitor individual growth, fish were randomly selected from each replicate container and weighed twice a week. Based on these weight measurements, daily feed rations were adjusted to ensure optimal nutrient intake. Additionally, 10% of the water volume was exchanged daily, and each container was aerated. The care and use of fish in this study were carried out in accordance with the ethical principles and procedures as stipulated by the Animal Care Committee (ACC) of Bangladesh Agricultural University (Approval Number: BAU-FoF/2024/012).
Water quality parameters were assessed using various instruments: a thermometer for temperature, an oxygen meter (Smart Sensor, DO Meter AR8010, China) to measure dissolved oxygen levels, and a portable digital pH meter (Water Quality Tester, BLE-P-3, China) for monitoring pH. Additionally, a test kit (Model NI, Cat. No. 22669-00, Hach Co.) was used to determine the total amount of ammonia nitrogen.
2.4. Growth and Nutrient Utilization Parameters
The growth performance and feed utilization parameters were measured using the following formulas:
Weight gain (WG) = Mean final weight − mean initial weight,
Percent weight gain (% WG) = [(mean final weight − mean initial weight)/mean initial weight] × 100,
Specific growth rate (SGR) = ((ln [final weight] − ln [initial weight])/total culture period) × 100,
Carcass yield (CY) = (fish weight without viscera/total fish weight) × 100,
Hepatosomatic index (HSI) = (liver weight/total fish weight) × 100,
Viscerosomatic index (VSI) = (viscera weight/total fish weight) × 100.
2.5. Blood Sample and Hematological and Biochemical Analysis
To collect blood samples, Asian fossil catfish were gently netted and swiftly removed from the water. An anesthetic solution containing 4.5 mg/L clove oil, as recommended by Islam et al. [20], was used to minimize stress and ensure accurate blood sampling. Blood was extracted from the renal artery by amputating the tail peduncle. Blood glucose and hemoglobin (Hb) levels were measured using a digital blood glucose meter (GLUCOLAB Auto-coding) and Hb kits (EasyLife Hb), respectively. A drop of blood was applied to the test strips of the respective meters, and the results were recorded. Blood glucose and Hb values were reported in mmol/L and g/dL, respectively. For differential leukocyte counts, blood smears were fixed in methanol, stained with Giemsa, and examined under a light microscope (OPTICA B350, Italy).
2.6. Histological Observations
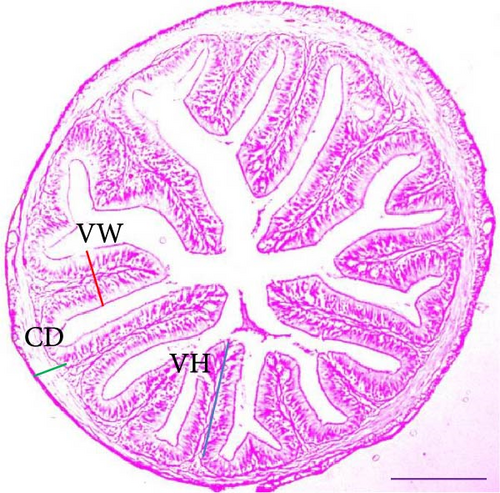
The liver and intestines were carefully dissected from three fish per container and weighed to the nearest gram. The tissue samples from the intestines and liver were preserved in Bouin’s fluid for 72 h, then fixed in 10% formalin for 48 h, and processed using the conventional paraffin embedding method. Sections 5 -μm-thick (three cross-sections from each sample) were cut with a microtome, mounted on slides, and stained routinely with hematoxylin and eosin. The slides were examined under a microscope equipped with a digital video camera (Sony DXC-930P, Sony Corporation, Tokyo, Japan). Image analysis was performed using stereological software, Cast Image System (Version 2.3.1.3, Visiopharm Albertslund, Hørsholm, Denmark). Measurements of mucosal thickness, villi height, and crypt depth were taken from nine randomly selected villi per fish group. Mucosal thickness was measured from the lamina propria to the villi apex, villi height from the villi apex to the villi–crypt junction, and crypt depth as the distance between adjacent villi invaginations. The villi–crypt ratio was then calculated by dividing the villi height by the crypt depth.
2.7. Statistical Analysis
The data were analyzed using R version 4.0.4 (R Core Team, 2020). The “car” package [21] was utilized to assess normality and homogeneity of variance through Shapiro–Wilk’s test and Levene’s test, respectively. The data were then subjected to one-way ANOVA. Differences between means were evaluated at the p < 0.05 level using Duncan’s post hoc test. All results are presented as mean ± SE (n = 5).
3. Results
3.1. Growth Parameters
The growth performance of Asian fossil catfish significantly improved with increasing levels of dietary synbiotics (Table 1). Fish fed the control diet showed the lowest final weight, while those receiving higher concentrations of synbiotics (4%, 6%, and 8%) exhibited progressively higher weights, with the 8% synbiotic group achieving the greatest growth. Weight gain (WG) also increased with higher synbiotic levels, with the 8% group showing the highest gain. Similarly, percent WG and specific growth rate (SGR) were notably higher in the 8% synbiotic diet compared to the control, indicating that synbiotics enhance both growth and feed efficiency in this species.
| Parameters | Dietary treatments | |||
|---|---|---|---|---|
| T1 (0%) | T2 (4%) | T3 (6%) | T4 (8%) | |
| Initial weight (g) | 1.86 ± 0.03 | 1.92 ± 0.02 | 1.91 ± 0.02 | 1.83 ± 0.03 |
| Weight at day 45 (g) | 4.25 ± 0.02a | 4.38 ± 0.01a,b | 4.5 ± 0.04a,b | 4.77 ± 0.09b |
| Weight gain (g) | 2.39 ± 1.33a | 2.46 ± 2.22a,b | 2.59 ± 2.19a,b | 2.93 ± 1.97b |
| % weight gain | 128.31 ± 1.83a | 127.85 ± 1.83a | 135.28 ± 1.9a,b | 160.04 ± 2.12b |
| SGR (%/day) | 1.83 ± 0.01a | 1.83 ± 0.01a | 1.9 ± 0.03a | 2.12 ± 0.01b |
- Note: Mean ± SE in the same row with different letters differ significantly (p < 0.05).
- Abbreviation: SGR, specific growth rate.
3.2. Body Indices
The supplementation of dietary synbiotics led to significant improvements in the hepatosomatic index (HSI) and viscerosomatic index (VSI) of Asian fossil catfish. By the end of the study, fish receiving higher levels of synbiotics, particularly at 8%, exhibited the highest HSI and VSI values, indicating enhanced liver and visceral development. Although the carcass yield (CY) percentage showed a slight increase across all synbiotic treatments, the differences were less pronounced (Table 2). Overall, synbiotic supplementation effectively promoted liver and visceral growth, supporting the benefits of these additives for improving fish health and development.
| Parameters | Dietary treatments | |||
|---|---|---|---|---|
| T1 (0%) | T2 (4%) | T3 (6%) | T4 (8%) | |
| Initial HSI | 0.59 ± 0.04 | 0.56 ± 0.08 | 0.54 ± 0.11 | 0.49 ± 0.02 |
| HSI at day 45 | 1.23 ± 0.08a | 1.4 ± 0.01a,b | 1.53 ± 0.01b | 1.61 ± 0.01b |
| Initial VSI | 3.12 ± 0.03 | 3.03 ± 0.10 | 3.07 ± 0.04 | 3.17 ± 0.11 |
| VSI at day 45 | 5.04 ± 0.17a | 5.56 ± 0.07a,b | 5.99 ± 0.05a,b | 6.5 ± 0.02b |
| Initial CY (%) | 96.88 ± 0.09 | 96.97 ± 0.11 | 96.93 ± 0.08 | 96.83 ± 0.12 |
| CY at day 45 | 93.5 ± 0.12 | 94.01 ± 0.17 | 94.44 ± 0.14 | 94.96 ± 0.16 |
- Note: Mean ± SE in the same row with different letters differ significantly (p < 0.05).
- Abbreviations: CY, carcass yield; HSI, hepatosomatic index; VSI, viscerosomatic index.
3.3. Hematological and Biochemical Parameters
The dietary supplementation of synbiotics had a notable impact on the Hb and blood glucose levels of the Asian fossil catfish. After 45 days, all synbiotic treatments led to significant increases in Hb levels compared to the initial measurements, with the 8% synbiotic group achieving the highest level. This increase was progressively higher with the amount of synbiotics administered. In contrast, blood glucose levels exhibited more variability among the different treatments. While initial glucose levels were relatively consistent across all groups, the 8% synbiotic group showed the lowest glucose levels by the end of the study, although these differences were not statistically significant (Table 3). Overall, the results suggest that while synbiotics improve Hb levels significantly, their effect on blood glucose levels is less clear.
| Parameters | Dietary treatments | |||
|---|---|---|---|---|
| T1 (0%) | T2 (4%) | T3 (6%) | T4 (8%) | |
| Initial hemoglobin (g/dL) | 8.03 ± 0.25 | 9.00 ± 0.56 | 8.43 ± 0.25 | 8.83 ± 0.29 |
| Hemoglobin at day 45 (g/dL) | 12.63 ± 0.47a | 13.27 ± 1.17a,b | 13.87 ± 1.27a,b | 14.90 ± 0.82b |
| Initial blood glucose (mmol/L) | 4.23 ± 0.26 | 4.50 ± 0.37 | 4.47 ± 0.19 | 4.27 ± 0.20 |
| Blood glucose at day 45 (mmol/L) | 4.93 ± 0.41 | 4.73 ± 0.14 | 4.17 ± 0.50 | 4.03 ± 1.51 |
- Note: Mean ± SE in the same row with different letters differ significantly (p < 0.05).
The supplementation with synbiotics also impacted the differential white blood cell counts (Table 4). After 45 days, several notable changes in white blood cell types were observed. Monocyte levels increased across all treatment groups, with the highest counts recorded in the 6% and 8% synbiotic groups. Lymphocyte counts also rose significantly, particularly in the 6% and 8% synbiotic groups, which showed the highest values by the end of the study. Although basophil counts increased slightly across all treatments, these changes were not statistically significant. Eosinophil levels exhibited modest increases in all groups, with the 6% synbiotic group showing the highest count. Neutrophil levels were significantly higher in the 6% and 8% synbiotic groups compared to the other groups. Additionally, the total white blood cell counts at day 45 were significantly higher in the 6% and 8% synbiotic groups compared to the 0% and 4% groups (Table 4). Overall, synbiotic supplementation appeared to enhance various aspects of the differential white blood cell counts, especially at higher concentrations.
| Differential white blood cells (%) | Treatments | ||||
|---|---|---|---|---|---|
| T1 (0%) | T2 (4%) | T3 (6%) | T4 (8%) | ||
Monocyte |
Initial | 1.93 ± 0.03 | 2.07 ± 0.03 | 2.20 ± 0.12 | 2.37 ± 0.17 |
| At day 45 | 3.80 ± 0.65a | 4.34 ± 0.03a | 5.86 ± 0.01b | 5.31 ± 0.06b | |
Lymphocytes |
Initial | 23.47 ± 1.06 | 24.55 ± 1.15 | 25.53 ± 0.29 | 26.5 ± 0.28 |
| At day 45 | 25.07 ± 0.52a | 27.3 ± 0.81a | 31.41 ± 2.498b | 32.97 ± 0.71b | |
Basophil |
Initial | 0.14 ± 0.10 | 0.15 ± 0.01 | 0.21 ± 0.01 | 0.19 ± 0.01 |
| At day 45 | 0.34 ± 0.02 | 0.36 ± 0.03 | 0.41 ± 0.07 | 0.51 ± 0.10 | |
Eosinophil |
Initial | 1.80 ± 0.08 | 1.59 ± 0.10 | 2.42 ± 0.21 | 2.16 ± 0.21 |
| At day 45 | 2.42 ± 0.10 | 2.68 ± 0.14 | 2.88 ± 0.07 | 2.73 ± 0.11 | |
Neutrophil |
Initial | 18.27 ± 5.11 | 20.30 ± 3.76 | 19.70 ± 2.11 | 17.6 ± 1.09 |
| At day 45 | 20.57 ± 2.68a | 22.83 ± 0.59a | 25.47 ± 5.58b | 26.71 ± 0.73b | |
| Total white blood cell counts at day 45 | — | 52.2 ± 1.13a | 57.51 ± 1.32ab | 66.03 ± 1.22b | 68.23 ± 1.56b |
- Note: Mean ± SE in the same row with different letters differ significantly (p < 0.05). Representative images including arrowheads of differential WBC cells are shown in the respective columns.
3.4. Intestinal Morphological Indices
Dietary synbiotic supplementation significantly influenced the intestinal morphometric indices of the Asian fossil catfish. Over 45 days, increases in intestinal villi height were observed, with the most pronounced growth in the 8% synbiotic group. Villi width also expanded, notably in the 6% and 8% synbiotic groups. Although crypt depth was similar across treatments initially, it increased significantly in all groups by the study’s end, with the deepest crypts in the 8% synbiotic group. Goblet cell density, which was initially uniform across treatments, saw a substantial rise with synbiotic supplementation, particularly in the 8% group. Furthermore, the ratio of villi height to crypt depth improved with higher synbiotic concentrations, reflecting enhanced intestinal morphology (Table 5).
| Parameters | Treatments | |||
|---|---|---|---|---|
| T1 (0%) | T2 (4%) | T3 (6%) | T4 (8%) | |
| Villi height (μm) | ||||
| Initial | 71.49 ± 2.22 | 72.31 ± 0.32 | 73.11 ± 1.22 | 72.29 ± 5.08 |
| At day 45 | 107.68 ± 6.31a | 135.53 ± 8.17a,b | 158.74 ± 7.08a,b | 208.89 ± 6.82b |
| Villi width (μm) | ||||
| Initial | 30.36 ± 0.60 | 31.46 ± 3.09 | 27.8 ± 1.96 | 29.96 ± 0.48 |
| At day 45 | 26.42 ± 2.18a | 35.62 ± 1.75a,b | 40.35 ± 0.95b | 44.19 ± 2.30b |
| Crypt depth (μm) | ||||
| Initial | 10.79 ± 0.25 | 10.84 ± 0.97 | 10.66 ± 0.40 | 10.67 ± 0.34 |
| At day 45 | 14.11 ± 2.53a | 17.52 ± 1.39b | 18.23 ± 1.63b | 19.58 ± 1.88b |
| Goblet cells (mm)2 | ||||
| Initial | 17.33 ± 3.18 | 18 ± 5.19 | 17 ± 4.93 | 18 ± 5.13 |
| At day 45 | 24.33 ± 3.71a | 35.33 ± 3.81b | 32 ± 2.01b | 38 ± 3.21c |
| Villi height: crypt depth | ||||
| Initial | 6.62 | 6.67 | 6.85 | 6.77 |
| At day 45 | 7.63a | 7.73a | 8.70a,b | 10.67b |
- Note: Mean ± SE in the same row with different letters differ significantly (p < 0.05).
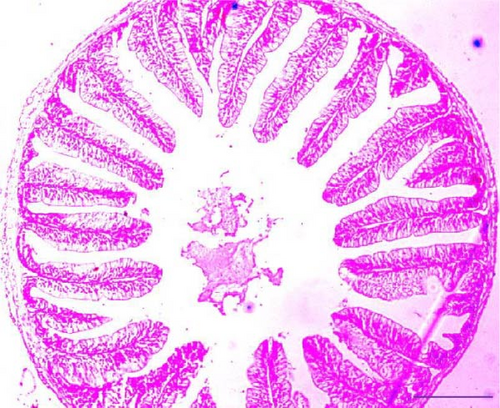
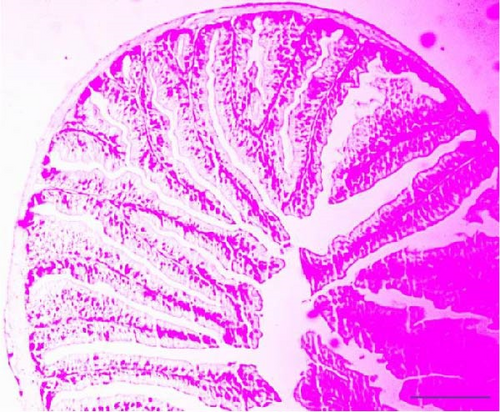
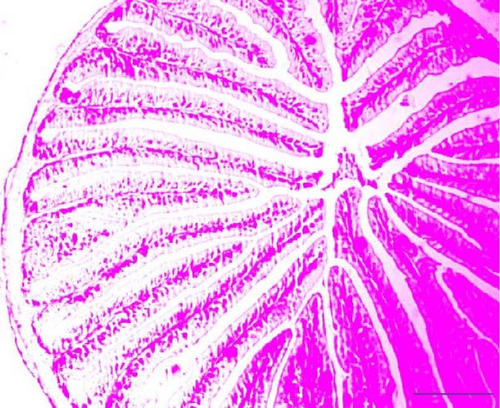
Histological analysis of the intestinal sections from the Asian fossil catfish revealed notable changes due to synbiotic supplementation. In the control group (0% synbiotics), villus height, villus width, and crypt depth were comparatively lower. With the addition of 4% synbiotics, improvements in these intestinal metrics were observed, though less pronounced. The 6% synbiotic group showed further enhancements, with increased villus height and width, as well as greater crypt depth. The most significant changes were noted in the 8% synbiotic group, where the villi were notably taller and wider and the crypts deeper, indicating a pronounced positive effect of higher synbiotic concentrations on intestinal morphology (Figure 1).
3.5. Histopathology of the Liver
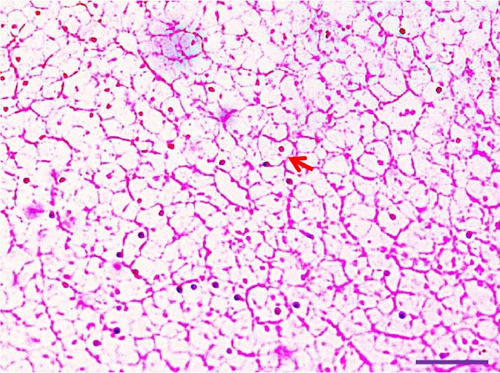
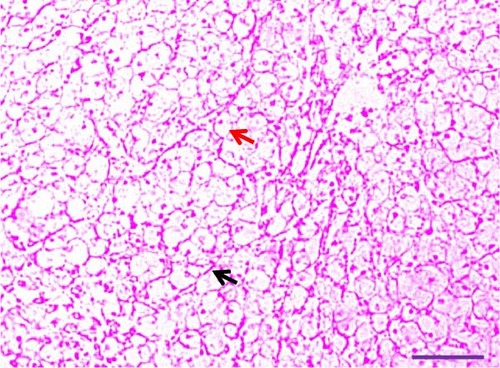
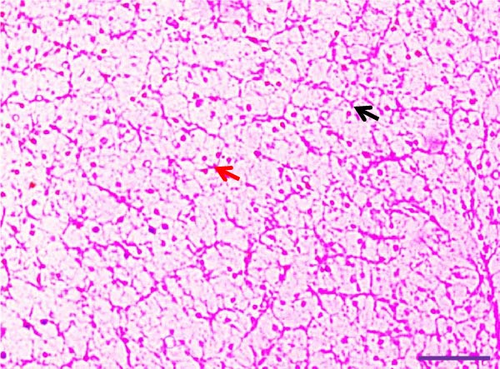
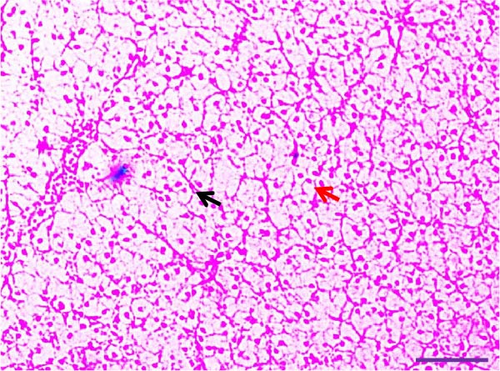
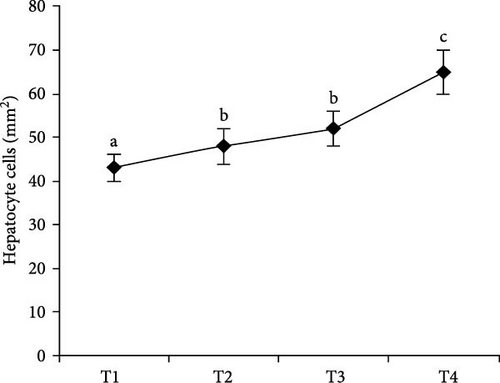
Histological examination of liver tissues from Asian fossil catfish revealed significant improvements due to synbiotic supplementation. The control group (0% synbiotics) exhibited normal hepatocytes with distinct, circular nuclei and flattened von Kupffer cells within the hepatic parenchyma. The 4% synbiotic group showed some improvement in liver tissue organization and hepatocyte arrangement. Further enhancements were observed in the 6% synbiotic group, with more organized liver tissue, increased hepatocyte density, and clearer cellular boundaries. The most pronounced benefits were seen in the 8% synbiotic group. This group displayed a marked increase in hepatocyte abundance and a significant improvement in the regularity of their nuclei. Additionally, numerous flattened von Kupffer cells were observed (Figure 2). These findings indicate that higher synbiotic concentrations have a substantial positive impact on liver health, with the 8% group demonstrating the most significant improvements.
4. Discussion
The current findings provide a thorough understanding of how multistrain synbiotic supplementation affects growth performance, intestinal structure, and immunity in Asian fossil catfish. The study revealed that synbiotic supplementation positively influenced all growth metrics. Notably, the 8% synbiotic diet led to the highest increases in BW, WG, and SGR compared to other treatments. These results are consistent with improvements observed in other species, including Thai pangus [22], Nile tilapia [23, 24], rainbow trout [25], and Litopenaeus vannamei [26] when supplemented with synbiotics. The observed enhancements in growth performance and body indices are likely attributed to various synbiotic effects, such as the support of beneficial microbial populations [8], improved feed intake and digestion [2], and alterations in bacterial metabolism [13, 14].
The three body indices—HSI, VSI, and CY—are key indicators of fish health. The liver, which plays a crucial role in nutrient metabolism, serves as a significant health marker [27]. In this study, both the HSI and VSI increased with higher levels of synbiotic supplementation, indicating that the fish effectively utilized the synbiotic-enriched feed to enhance liver and visceral development. Rahmi et al. [28] similarly observed a significant increase in HSI in Nile tilapia-fed synbiotics. The HSI measures the liver’s relative weight to total BW; an elevated HSI often signifies increased liver fat [29]. In parallel, the VSI was notably higher in the 8% synbiotic group compared to the control group at day 45, suggesting increased visceral fat production in the synbiotic-fed fish. A higher VSI typically indicates greater visceral fat accumulation [30]. Conversely, CY did not show significant differences across the treatment groups. Peterson, Bosworth, and Li [31] also reported no notable effect of prebiotics, probiotics, or synbiotics on CY in hybrid catfish.
Hematology is essential for evaluating fish feed quality, with Hb and glucose levels serving as critical indicators of the impact of food additives, medications, or toxins on fish health. Ioannis et al. [32] have highlighted that synbiotics can influence common blood variables such as hematocrit (Ht) and Hb levels. Our study found significantly higher Hb levels in fish fed a diet with 8% synbiotics (T4 group) compared to both the control group and the normal range (9.1–11.7 g/dL [33]) for H. fossilis. The positive effects of prebiotics and probiotics—both individually and in combination with synbiotics—on hematological parameters have been well-documented in various animals, including tilapia [34]. Elevated Hb levels suggest an increased oxygen supply to body cells, potentially boosting immune function [35]. Similar enhancements in Hb levels have been reported in Cyprinus carpio [36], Oncorhynchus mykiss [37], and humpback grouper [38].
Blood glucose levels in H. fossilis were generally lower in fish-fed synbiotic diets compared to a control diet. While these differences were not statistically significant, they align with previous studies by Mehrabi, Firouzbakhsh, and Jafarpour [39]; Marlida, Suprayudi, and Harris [38]; and Boonanuntanasarn et al. [26]. The observed reduction in blood glucose, which typically ranges from 3.45 to 4.5 mmol/L [40], may be attributed to the potential stress-reducing effects of synbiotics on the fish [41]. The observed fluctuations in blood glucose levels following synbiotic supplementation can be attributed to several interconnected mechanisms [4]. Firstly, synbiotics can significantly influence gut microbiota composition, leading to improved digestion and nutrient absorption. This, in turn, can affect glucose metabolism. Beneficial gut bacteria, such as Lactobacillus and Bacillus, promoted by synbiotics, produce short-chain fatty acids (SCFAs). These SCFAs have been shown to enhance insulin sensitivity and regulate glucose levels. Secondly, synbiotics may impact the secretion of hormones involved in glucose regulation, such as insulin and glucagon. Improved gut health, reduced gut inflammation, and oxidative stress can support better hormone balance, contributing to more stable blood glucose levels. Lastly, by enhancing overall gut function and immune response, synbiotics may reduce stress in the fish. Stress can influence metabolic pathways, including glucose metabolism. Therefore, by mitigating stress, synbiotics can indirectly contribute to blood glucose regulation.
Differential white blood cell counts are key indicators of fish health and offer insights into immune system status. Our results revealed significant differences in white blood cell counts between the treatment groups and the control group, underscoring the immunostimulatory and anti-infective effects of synbiotics. Synbiotics not only boost leukocyte counts but also enhance granulocytes and macrophages in fish, similar to the effects seen in higher vertebrates [42]. These findings are consistent with previous research by Salma and Sanaa [43] and Raissa et al. [44], who observed notable changes in white blood cell counts in C. carpio and Nile tilapia, respectively, following synbiotic supplementation. Furthermore, Cristian et al. [45] found that yeast glucan administration significantly increased both total blood leukocytes and the proportions of neutrophils and monocytes in common carp.
Increased villi height and crypt depth are important indicators of gut health and functionality. Villi are finger-like projections in the intestinal lining that increase the surface area available for nutrient absorption. Crypts, located at the base of the villi, are responsible for the regeneration of intestinal epithelial cells. A deeper crypt suggests enhanced cell turnover and tissue repair, which can support better gut function and overall health. Our results demonstrated that synbiotic supplementation significantly improved the intestinal structure in catfish. Both morphological and quantitative analyses revealed that synbiotic-enriched diets led to increased villi height, width, and crypt depth, which enhanced the villi surface area and nutrient absorption. These improvements in intestinal morphology align with findings from studies using various additives, such as L. acidophilus in O. niloticus [46], β-glucan [47], MOS [48], B. subtilis [49], and S. faecium [50]. The villus–crypt unit serves as a site for villus renewal, with deeper crypts reflecting increased tissue turnover due to normal sloughing or responses to pathogens or toxins [51]. Shortened villi and deeper crypts can impair nutrient absorption, increase gastrointestinal secretions, and reduce performance [52]. In contrast, longer villi are linked to enhanced mitosis and improved epithelial cell turnover, as evidenced by increases in villus height and the villus height-to-depth ratio [12]. A healthy gut microbiota promotes the production of SCFAs such as acetate, propionate, and butyrate, which are known to stimulate epithelial cell proliferation and enhance the growth of villi. Butyrate, in particular, is a key energy source for colonocytes and has been shown to enhance gut barrier function and promote tissue repair, contributing to increased villi height and crypt depth [53, 54]. Additionally, synbiotics can reduce intestinal inflammation and oxidative stress, further supporting the integrity of the intestinal lining and improving nutrient absorption [4]. Moreover, synbiotic supplementation may stimulate mucin secretion on the intestinal mucosal surface, aiding in defense against pathogenic microorganisms [50]. Our study also observed an increase in goblet cells, which secrete mucins that bolster local intestinal immunity and digestion [15, 55].
Histological analysis of liver tissue showed that synbiotics positively affected hepatocyte number and morphology, including more regular nuclear shapes and reduced intracellular distances between liver cells. These findings suggest that synbiotic supplementation enhances the histoarchitecture and function of the liver. In line with Ruiz et al. [56], our results indicated that synbiotics promote hepatocyte regeneration and improve liver function. The fish liver plays a crucial role not only in metabolic processes but also in immune surveillance [57]. Recent studies have identified the liver as a vital immunological organ that actively responds to circulating antigens and endotoxins, particularly due to its abundance of innate immune cells [58]. The increased number of von Kupffer cells observed in the hepatic parenchyma of the treated specimens in this study provides evidence for the immunomodulatory effects of synbiotics in fish. Activation of von Kupffer cells triggers the chemokine-mediated infiltration of neutrophils, monocytes, natural killer cells, and natural killer T cells [59]. Morphological evidence of von Kupffer cell presence in fish upon challenge has been documented in various fish species, including trout [60].
5. Conclusion
In conclusion, the study underscores the significant benefits of synbiotic supplementation for Asian fossil catfish in aquaculture. Synbiotics markedly improved growth performance, with the 8% inclusion level achieving the highest BW and WG. Enhanced gut health was evident through improved intestinal morphology, including increased villi height and width, and deeper crypts. Supplementation also positively affected hematological parameters, such as elevated Hb levels, suggesting better oxygen transport and overall health. Moreover, synbiotics improve immune function and liver tissue organization. These findings highlight synbiotics as a promising, ecofriendly alternative to antibiotics, offering a sustainable solution for enhancing fish health and productivity. Future research should focus on optimizing synbiotic use and exploring their mechanisms to further advance sustainable aquaculture practices.
Conflicts of Interest
The authors declare no conflicts of interest.
Author Contributions
Sadia Salam Linda: writing–original draft, visualization, methodology, formal analysis, data curation. Md. Jobayer Islam: visualization, validation, methodology, data curation. Sadia Afrin Mou: visualization, validation, methodology, formal analysis, data curation. Md. Hamidul Islam: visualization, validation, methodology, formal analysis, data curation. Md. Shahjahan: writing–review and editing. M. Sadiqul Islam: writing–review and editing, supervision, project administration, funding acquisition, conceptualization. The authors alone are responsible for the content and writing of the paper.
Funding
This work was supported by a grant from the Bangladesh Agricultural University Research System (BAURES), Bangladesh Agricultural University, Mymensingh 2202, Bangladesh.
Acknowledgments
This work was supported by a grant from the Bangladesh Agricultural University Research System (BAURES), Bangladesh Agricultural University, Mymensingh 2202, Bangladesh.
Open Research
Data Availability Statement
All data underlying the results are available as part of the article, and no additional source data are required.


