Cloning and Characterization of Adiponectin Receptors in Rana amurensis During Aeromonas hydrophila Infection
Abstract
This study describes the cloning and characterization of adiponectin receptors (AdipoR1 and AdipoR2), as well as the analysis of their mRNA and protein expression in Rana amurensis at different time points after Aeromonas hydrophila (Ah) infection. The open reading frame (ORF) sequences of AdipoR1 (1137 bp) and AdipoR2 (1164 bp) were successfully identified. The deduced amino acid sequences of AdipoR1 and AdipoR2 exhibited a closer genetic affinity to amphibians such as Rana temporaria and Bufo gargarizans than to nonamphibian species like Mus musculus and Danio rerio. For uninfected, clinically healthy R. amurensis, the expression levels of AdipoR1 and AdipoR2 mRNA was significantly higher in the kidney, muscle, and stomach (p < 0.05). Under Ah stress, the relative expression levels of AdipoR1 mRNA in the liver, lung, muscle, and stomach peaked at 16 h postinfection; however, the AdipoR2 mRNA in the lung, muscle, and stomach reached the maximum at 72 h. Our study suggests that AdipoR1 and AdipoR2 were localized on the surface of the cell membrane; at the same time, the expression of AdipoR1 and AdipoR2 in R. amurensis varied across different time points and tissues during Ah infection. This study is the first to investigate the AdipoRs genes of R. amurensis in cold high-latitude areas of China. It highlights the importance of AdipoR1 and AdipoR2 immune function and provides valuable insights for the conservation and sustainable utilization of R. amurensis.
1. Introduction
Declines in amphibian populations have been widely documented globally in the last decades and are attributed to a multitude of factors that act synergistically [1]. This includes factors of anthropogenic trade and development, as well as infectious diseases caused by diverse types of pathogenic bacteria, for example, the Aeromonas hydrophila (Ah) [2]. Ah is widely distributed in nature and can infect humans, birds, amphibians, reptiles, fish, and other species. Ah is gram-negative and is also part of the normal flora of aquatic and terrestrial organisms [3–6]. The red-leg disease of frogs caused by Ah infection is widespread. Typical symptoms are red spots, erythema, and swelling on the skin of the head, abdomen, and inner legs [7]. It can also be seen that there are ascites in the abdominal cavity, enlargement of the spleen and kidneys, intestinal emptiness, hemorrhage, and inflammation [8], this condition may also lead to subcutaneous hemorrhage, epidermal–dermal separation, and hepatic cellular vacuolization, posing a severe threat to the organism’s survival. Because the living environment of frogs is highly conducive to the growth of Ah, it exhibits strong pathogenicity towards frogs.
Rana amurensis is a dominant amphibian mainly distributed in northeastern China. It is widely used in traditional Chinese medicine for conditioning and treating diseases and is considered an invaluable economic animal with high medical value [9, 10]. These products have been widely accepted by Chinese, positioning them as traditional Chinese medicines with vast potential for comprehensive development [11]. Notably, the oviduct and skin have evolved into numerous health products. The differentially expressed genes of the skin were abundant in numerous antimicrobial peptides. Thus, they were suitable as biological sources for the development and isolation of antimicrobial peptides [12]. In addition to its medicinal value, the study of the immune response mechanism of R. amurensis against Ah can provide a key theoretical basis for researchers to formulate amphibian-specific antidisease strategies and promote the sustainable development of the forest frog breeding industry in R. amurensis. In recent years, it has been classified as an important economic frog species in northeastern China, and the scale of artificial breeding continues to expand. Considering aquaculture has suffered significant financial losses as a result of the infection of zoonotic Ah [13], more studies are needed to evaluate how amphibians’ immune system responds to infections by Ah.
Adiponectin is an adipocytokine mainly secreted by mature adipocytes. It plays a dominant role in the regulation of feeding, energy homeostasis, reproduction, and immunity [14, 15]. In previous studies [16, 17], the reports on the relationship between AdipoRs and inflammatory infection mainly focused on mammals and fish. Many studies have shown that the regulation roles of adiponectin are mainly mediated through two distinct AdipoRs, AdipoR1 and AdipoR2, have been cloned and designated in human and mouse [18]. At present, the third nonsignaling receptor has been found to be T-cadherin, which has similar functions to AdipoRs, but has different modes of action [19, 20]. AdipoR1 and AdipoR2 contain seven transmembrane domains, which are conserved from yeast to humans [21, 22]. The protein structure of AdipoRs is opposite to that of G-protein-coupled receptors, with an extracellular carboxyl terminus and an intracellular amino terminus [18]. It is found that there are two conserved motifs (D(x)3LL and F(x)3F(x)3F(x)3F) in the amino acid sequences of AdipoRs in black carp [23]. Studies have revealed that human AdipoRs have a zinc-binding site and a putative adiponectin-binding surface. In particular, the zinc binding site is located in the intracellular layer of the membrane with a tetrahedral coordination [24]. The crystal structure of AdipoR2 is combined with the free fatty acid (FFA) molecule, indicating that AdipoR2 has intrinsic basic ceramidase activity that is enhanced by adiponectin [25]. In human and mice, AdipoR1 is mainly expressed in muscle tissue, whereas AdipoR2 is expressed in liver tissue. The binding of AdipoR1 to globular adiponectin has high affinity, while the binding to full-length adiponectin is weak. The binding force of AdipoR2 is equivalent to that of globular and full-length adiponectin [21].
Several studies have demonstrated that adiponectin and its receptors are expressed in various tissues and play roles in regulating functions like energy metabolism and inflammatory responses [26–28]. In addition, adiponectin is also known to have antiatherogenic, anti-inflammatory, anticardiovascular diseases, and antidiabetic properties [16, 29]. The AdipoRs are widely expressed in various tissues and have different functions in their downstream signaling pathways. AdipoR1 activates AMPK, while AdipoR2 activates proliferator-activated receptor (PPAR)α-mediated pathways [30–33]. Some evidence showed that AdipoR1 and AdipoR2 could activate the ceramide signal by mediating adiponectin, which contributes to the anti-inflammatory effect [34, 35]. The combination of adiponectin and its receptor can play the functions of insulin sensitization, anti-inflammatory, and antiapoptosis [17, 36]. Recently, AdipoRs have been reported to express in most tissues and cell lines, including immune cells, that is, monocytes, B cells, and NK cells [37]. Similarly, AdipoRs have been found to take the function of resisting inflammation in mammalian species [38–40]. However, the expression of AdipoRs in the amphibian species R. amurensis has not been investigated during infection. Rana amurensis, a species highly susceptible to Ah infections and economically critical for aquaculture in northeast China. Therefore, the objective of the work is first to clone and characterize the full-length cDNA sequence of AdipoRs from R. amurensis; second, to explore the expression pattern and location of AdipoRs in various tissues of R. amurensis during infection. Our results have provided valuable insights into the response of R. amurensis to Ah stress, which could be beneficial for enhancing the Ah stress resistance of frog in the aquaculture.
2. Materials and Methods
2.1. Animals and Bacterial Strain
Healthy R. amurensis individuals, weighing between 16–20 g (n = 42) and derived from artificial breeding, were sourced from the Tonghe Forestry Farm in Heilongjiang Province, China. They were subsequently housed in temperature-controlled tanks maintained at 18–20°C, with a humidity level of 70% and a 12:12 light–dark cycle. We provided crickets as a standardized diet. Three frogs were assigned at each time point for the study in both the control and the experimental group respectively (total n = 6/time), with 6 time points analyzed (total N = 42:21 control + 21 infected). Ah strain dw1701–1909 (Ah) was isolated and identified by our laboratory [41].
2.2. Experimental Infection of Rana amurensis With Ah
Ah strain stored in our laboratory were resuscitated and cultured by plate scribing. The single colonies were selected and planted in LB liquid medium and cultured in shaking table at 180 r/min and 28°C for 24 h [42]. Using the intraperitoneal injection method, the half lethal dose of 1.5 × 10⁷ CFU/mL was determined for R. amurensis by temporary incubation for 1 week. The concentration of the bacterial solution was determined by UV spectrophotometer and plate colony counting method to determine the attack concentration. Rana amurensis was randomly divided into the control and experimental groups, with 21 frogs in each group. Each R. amurensis in the experimental group was injected with 1 mL of Ah solution (1.5 × 10⁷ CFU/mL) by intraperitoneal injection. The control group was injected with autoclaving LB medium, matching the physicochemical parameters of the bacterial suspension. Control groups only received the same volume of sterile LB medium via intraperitoneal injection, following identical handling and euthanasia protocols as the experimental group.
2.3. Sample Collection, RNA Extraction, and cDNA Synthesis
Sample collection was conducted in accordance with the guidelines of the Committee for Animal Experimentation of Harbin Normal University (No. HNUARIA2021002). Euthanasia was administered using Pentobarbital sodium (Sigma–Aldrich Y0002194) at a dosage of 50 mg/kg, following the disinfection of the injection site with 70% ethanol to minimize discomfort and ensure a humane procedure. The major tissues, including the heart, liver, spleen, lungs, kidneys, skin, muscles, and stomach, were collected immediately after euthanasia. Samples were taken at 8, 16, 24, 36, 48, and 72 h postinfection with Ah, with three frogs used at each time point. The isolated tissues were immediately frozen in liquid nitrogen and stored at −80°C until total RNA extraction and protein preparation. Tissue was stored at −80°C for 2 days. Agarose gel electrophoresis was employed to evaluate the integrity of the extracted RNA. Animal experiments followed ARRIVE guidelines, with predefined humane endpoints to minimize distress.
Total RNA was extracted using Trizol Reagent (Vazyme, Nanjing, China) according to the manufacturer’s recommendations. Each homogenized sample was treated with 1 mL of Trizol reagent. Tissues were homogenized in Trizol using a Shanghai JingXin MY-20 homogenizer, operating at 6000 rpm for 10-s intervals over four cycles, with 30-s cooling periods in between. Subsequent extraction was carried out using 200 μL of chloroform. After the separation of the aqueous phase, RNA was precipitated with isopropanol and washed with 75% ethanol. The RNA pellet was retained and RNase-free water was added after drying. RNA integrity was confirmed using 1% agarose gel electrophoresis and an Ultraviolet spectrophotometer (Beckman, Brea, CA, USA). During the reverse transcription (RT) reaction, the HiScript II first-strand cDNA synthesis kit (Vazyme, Nanjing, China) was used according to the manufacturer’s proposal.
2.4. Cloning and Sequencing of AdipoR1 and AdipoR2
The open reading frame (ORF) for AdipoR1 and AdipoR2 were obtained by the polymerase chain reaction (PCR). Thermal PCR conditions were 5 min at 94°C, then 30 cycles of 94°C for 30 s, 54.5°C for 30 s, 72°C for 60 s, and final extension at 72°C for 10 min.
For the length difference, the PCR fragment was subjected to electrophoresis on a 1% agarose gel. PCR reactions included no-template controls (NTCs) to rule out contamination. NTCs showed no amplification, confirming the absence of exogenous DNA. The PCR products of the expected length were purified using the Agarose Gel DNA Fragment Recovery Kit (Vazyme, Nanjing, China) and ligated into the pMD-18T vector (Takara, Dalian, China) and then, transformed into the competent Escherichia coli DH5α cell with ampicillin-containing LB plates. Positive strains were screened by colony PCR and then sequenced in both directions with primers M13-F and M13-R for sequencing (Ruibo Xingke Bioengineering Co., Ltd.) and subjected to cluster analysis in NCBI.
2.5. Bioinformatic Analysis
The cDNA sequence and deduced amino acid sequence of AdipoRs were analyzed using the BLAST algorithm (http://www.ncbi.nlm.nih.gov/blast) and the Expert Protein Analysis System (http://www.expasy.org/). The homologous conserved domains were revealed using the SMART version (http://smart.embl.de/) and TMHMM-2.0 (https://services.healthtech.dtu.dk/service.php?TMHMM-2.0/). The protein structure was simulated and predicted by SWISS-MODEL software (http://www.expasy.ch/swissmod/SWISS-MODEL.html). A phylogenetic tree based on the amino acid sequences was constructed using the neighbor-joining (NJ) methods with the MEGA 7.0 program. The reliability of the branching was tested by bootstrap resampling (1000 pseudo-replicates).
2.6. Quantitative Real-Time PCR Tests
The distribution and expression levels of AdipoR1 and AdipoR2 mRNA were examined in heart, liver, spleen, lung, kidney, skin, muscle, and stomach. cDNA was obtained via a RT kit (Vazyme, Nanjing, China). qRT-PCR was performed using the SYBR Green PCR master mix kit (Vazyme, Nanjing, China). The reaction system includes 2×ChamQ SYBR qPCR Master Mix 10 μL, Primer1 (10 μmol/L) 0.4 μL, Primer 2 (10 μmol/L) 0.4 μL, ddH2O 8.2 μL, and cDNA 1 μL. PCR conditions for amplification of AdipoR1 and AdipoR2 were 40 cycles consisting of denaturing at 94°C for 30 s, specific annealing for 30 s, and extension at 72°C for 80s with an initial denaturing step at 94°C for 5 min and a final extension step at 72°C for 10 min. The annealing temperatures were 55°C. The data were analyzed by using the two-method. The R. amurensis β-actin gene was used for normalization as reference gene. Each qRT-PCR reaction was run in triplicate technical replicates to control for pipetting variability. The primers used for qRT-PCR are provided in the Table 1.
| Gene | Primer | Sequence of nucleotide (5′-3′) | Product length (bp) | References |
|---|---|---|---|---|
| AdipoR1 | F | 5′-AATAAGTGACAACCAGCAAA-3′ | 1269 | XP_040193767.1 |
| R | 5′-CAGATGAGTAATAAACCAGT-3′ | — | _ | |
| AdipoR2 | F | 5′-GTGGGACAATCCTCAATG-3′ | 1508 | XP_040201243.1 |
| R | 5′-CAAATCGGAAAGGGTAAA-3′ | — | _ | |
| AdipoR1-q | F | 5′-CAGTGTATTGCCATTCAGA-3′ | 165 | ON652852 |
| R | 5′-TTCCTAGCACGCAGACGA-3′ | — | _ | |
| AdipoR2-q | F | 5′-ATGTCGTTCATCGCTCCG-3′ | 117 | ON652854 |
| R | 5′-GCCCTCCGAATGGCAGTA-3′ | — | _ | |
| β-actin | F | 5′-AAGAATGAGGGCTGGAACA-3′ | 176 | Xue et al. [43] |
| R | 5′-GTGCGTGACATCAAGGAGAAGC-3′ | — | _ | |
2.7. Pathological Tissue Analysis and Immunohistochemistry (IHC)
The liver, stomach, kidneys, and skin tissues were fixed in formalin solution for 24 h and then transferred to 70% ethanol. After dehydrating the samples in a series of graded ethanol solutions up to absolute ethanol, they were embedded in paraffin. The paraffin-embedded tissues were sectioned into 6 μm thick and stained with hematoxylin–eosin (HE). Microphotographs were taken under a light microscope for histological observation (Leica, 2125 DM).
Tissue sections were dewaxed in xylene and rehydrated in a series of ethanol solutions; subsequently, citrate buffer (pH 6.0) was used for antigen retrieval. In order to block endogenous peroxidase, serial sections were placed in a 3% hydrogen peroxide (H2O2) solution and then incubated with 10% goat serum for 30 min at 37°C to reduce background staining. The sections were incubated with primary polyclonal antibodies against AdipoR1 (bs-0610R, Beijing Bioss Biotechnology Co., China) and AdipoR2 (bs-0611R, Beijing Bioss, Biotechnology Co., China) using 1:200 dilution overnight at 4°C. The sections were then incubated with HRP-conjugated goat anti-rabbit IgG (bs-40295 G-HRP, Beijing Bioss, China). Secondary antibodies was incubated for 40 min at 37°C. The chromogenic reaction was carried out using diaminobenzidine (DAB) and H2O2. Finally, sections were counterstained with hematoxylin and sealed with neutral gum. The slides were examined under a light microscope (Leica, Germany). The immunohistochemical images were analyzed using the IHC ToolBox plugin for ImageJ software. Three random fields of view were selected for each section to calculate the area, immunohistochemical optical density (IOD) and IOD/AREA ratio. At least three sections were examined for each region.
2.8. Western Blot Analysis
Tissue samples were ground with a grinder joined in 1 mL RIPA Lysis Buffer (Beyotime, Shanghai, China) containing 10 μL PMSF (100 mM). The mixture was lysed on ice for 30 min, then, sonicated for 3 min on ice and repeated four times. The supernatant was collected after centrifugation at 12,000 rpm for 5 min at 4°C. The protein samples’ concentrations were measured using a BCA (Beyotime, Shanghai, China) reagent after extraction from R. amurensis. The samples were loaded onto 10% polyacrylamide gels for SDS-PAGE. Subsequently, the separated proteins were transferred to PVDF membranes (Beyotime, Shanghai, China). PVDF membrane was blocked with TBST (containing 8% nonfat dry milk) for 1 h at room temperature, then, incubated overnight at 4°C with specific primary antibodies (same as antibodies of IHC) at 1:200. The secondary antibody was goat anti-rabbit IgG H&L (HRP; same as antibodies of IHC) was incubated at 37°C for 2 h. The membrane was incubated on visualization with the Chemiluminescent Kit (Tanon, Shanghai, China) in the SH-523 ECL Imager (Shenhua, Hangzhou, China). β-actin (bsm-33036M, Beijing Bioss Biotechnology Co., China) was used as endogenous control. Image J software was used for quantification and the protein bands were normalized using β-actin.
2.9. Statistical Analysis
All experimental data were presented as means ± standard error of the mean (SEM). Prior to statistical analysis, normality of distribution was verified using the Shapiro–Wilk test (p > 0.05) and homogeneity of variances was confirmed by Levene’s test (p > 0.1). For qRT-PCR data normalization, the 2−ΔΔCt method was applied using β-actin as the reference gene. Western blot band and film images of immunohistochemical intensities were normalized to β-actin protein levels via densitometric analysis in ImageJ. Statistical differences were assessed by a one-way analysis followed by Duncan’s multiple comparison test (SPSS 20.0). Differences were considered statistically significant at p < 0.05.
3. Results
3.1. Sequence Analysis of AdipoR1 and AdipoR2
AdipoR1 and AdipoR2 sequences of R. amurensis were deposited in the GenBank Data Library, respectively (Accession Number: ON652852 and ON652854). The cDNA of AdipoR1 possessed an ORF of 1137 nucleotides that encoded a polypeptide of 378 amino acids. Like other species, seven transmembrane domains were found among the amino acid sequences, namely, from 138 to 160, 175 to 197, 210 to 229, 239 to 258, 271 to 290, 300 to 322, and 335 to 357. Functional domain prediction of AdipoR1 protein showed the presence of hemolysin III super family at 132–355. Three-dimensional (3D) structural models predicted a strong consistency in tertiary structure between amphibian AdipoRs and human AdipoRs (Figure 1).
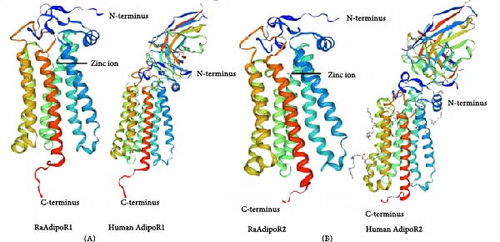
The ORF of AdipoR2 cDNA consisted of 1164 bp that encoded a protein with 387 amino acid residues. The predicted results showed that seven transmembrane domains were also found in amino acid residues from 147 to 169, 182 to 204, 219 to 241, 248 to 267, 277 to 299, 312 to 334, and 344 to 366. Functional domain prediction of AdipoR2 protein showed the presence of hemolysin III super family at 141–364. 3D structural modeling predicted the high conservation of AdipoR2 between R. amurensis and humans (Figure 1).
Multiple amino acid alignments of AdipoR1 and AdipoR2 were performed to compare structural similarity between R. amurensis and other representative species. The two conserved motifs (D(x)3LL and F(x)3F(x)3F; x stands any amino acid residue) were presented in both RaAdipoR1 and RaAdipoR2, respectively (Supporting Information: Figure S1 and Supporting Information: Figure S2).
3.2. AdipoR1 and AdipoR2 Phylogenetic Analysis
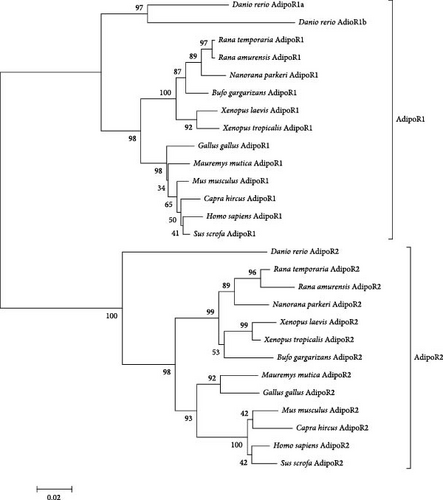
The NCBI blast homology analysis indicated that RaAdipoRs were closely matched between amphibians and other vertebrates. The overall percent identity among these sequences is shown in Table 2; the deduced amino acid sequence of R. amurensis AdipoR1 exhibits a high degree of identity with those of Rana temporaria (99%), Nanorana parkeri (96%), and Bufo gargarizans (94%) AdipoR1. Additionally, a comparison of the amino acid sequences of frog AdipoR2 cDNAs revealed that RaAdipoR2 shares significant sequence identity with R. temporaria (97%) AdipoR2 proteins, as depicted in Figure 2. The analysis of deduced amino acid sequences categorizes frog AdipoRs into two distinct subgroups: AdipoR1 and AdipoR2. RaAdipoR1 belonged to the amphibia AdipoR1 cluster. Similarly, RaAdipoR2 also showed the same results. The phylogenetic analysis indicated the AdipoRs derived from a common ancestor in evolution.
| Gene | Matched species | GenBank accession no. | Identity (%) |
|---|---|---|---|
| AdipoR1 | Rana temporaria | XP_040193767.1 | 99.2 |
| Nanorana parkeri | XP_018412413.1 | 96.6 | |
| Xenopus laevis | NP_001089438.1 | 90.4 | |
| Xenopus tropicalis | AAH80374.1 | 91.6 | |
| Bufo gargarizans | XP_044143219.1 | 94.2 | |
| Mauremys mutica | XP_044872057.1 | 89.1 | |
| Capra hircus | QBS16326.1 | 88.2 | |
| Gallus gallus | NP_001026198.2 | 87.5 | |
| Mus musculus | NP_001292998.1 | 89.1 | |
| Homo sapiens | NP_001277486.1 | 87.4 | |
| Sus scrofa | NP_001007194.1 | 87.6 | |
| AdipoR1a | Danio rerio | NP_001314683.1 | 85.67 |
| AdipoR1b | Danio rerio | NP_998665.1 | 76.94 |
| AdipoR2 | Rana temporaria | XP_040201243.1 | 97.2 |
| Nanorana parkeri | XP_018431960.1 | 93.4 | |
| Xenopus laevis | NP_001087571.1 | 87.3 | |
| Xenopus tropicalis | XP_031754472.1 | 89.7 | |
| Bufo gargarizans | XP_044137313.1 | 89.4 | |
| Mauremys mutica | XP_044847282.1 | 82.5 | |
| Capra hircus | QBS16327.1 | 78.3 | |
| Gallus gallus | NP_001007855.1 | 81.9 | |
| Mus musculus | NP_001342621.1 | 79.3 | |
| Homo sapiens | XP_006719081.1 | 79.3 | |
| Sus scrofa | NP_001007193.1 | 79.8 | |
| Danio rerio | AAI64853.1 | 86.9 | |
3.3. Expression Profile of AdipoR1 and AdipoR2 mRNA in Healthy Rana amurensis
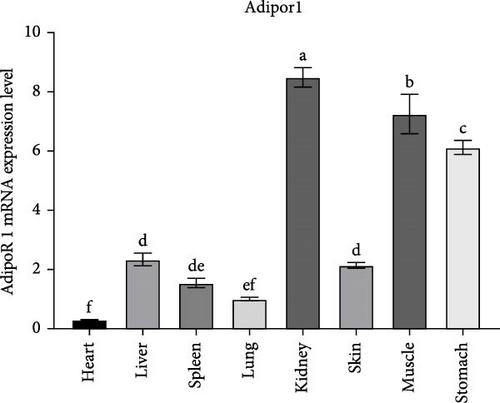
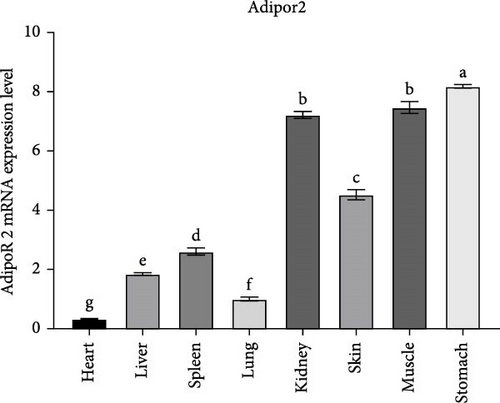
The tissue expression pattern of AdipoRs mRNA was analyzed by qRT-PCR and the expression level of RaAdipoRs mRNA were detected in all healthy R. amurensis tissues without any treatment (p < 0.05). The relative RaAdipoR1 mRNA expression was significantly higher in all selected tissues other than the heart and lung, which showed the tissue-specific variation of RaAdipoR1 (Figure 3A). The similar results were also shown in RaAdipoR2, there were higher expression levels of AdipoR2 in the stomach, muscle, kidney, and brain than that of other detected tissues (Figure 3B).
3.4. Histological Changes in Rana amurensis After Infection
Histological changes of the liver and skin in R. amurensis were observed after infection at 16, 36, and 72 h (Figure 4). Compared with the normal group (Figure 4A(A1)) and control group (Figure 4A(A2)), the liver tissue of infection group was significantly looser than that of the normal and control group. In addition, we also found that there was inflammatory infiltration and hepatic cell vacuolation in the experimental group. The pathological section of skin tissue showed that, compared with the skin structure of the normal group (Figure 4B(B1)) and control group (Figure 4B(B2)), the skin epidermis was separated from the dermis. At 36–72 h, the epidermis was damaged, the dermis became thinner, and melanocytes increased.


3.5. Expression Profile of AdipoR1 and AdipoR2 mRNA During Infection
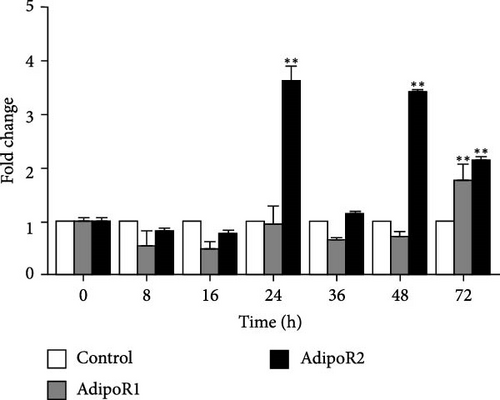
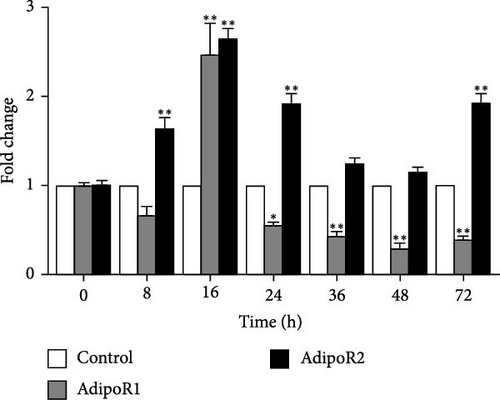
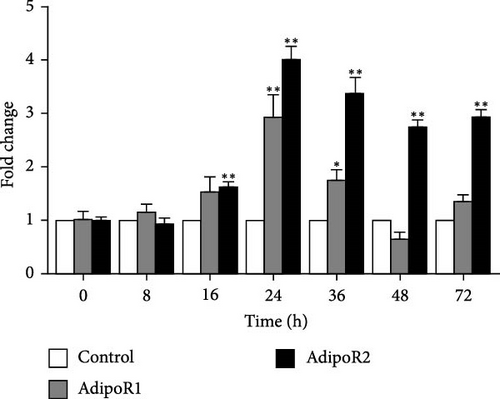
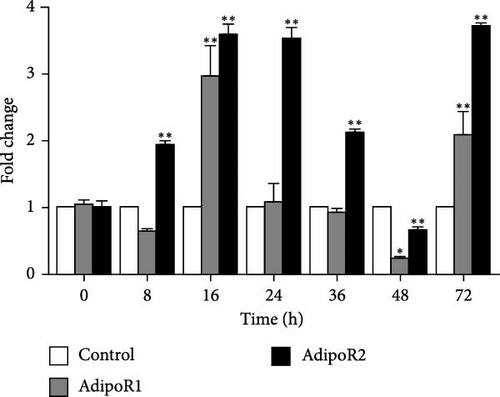
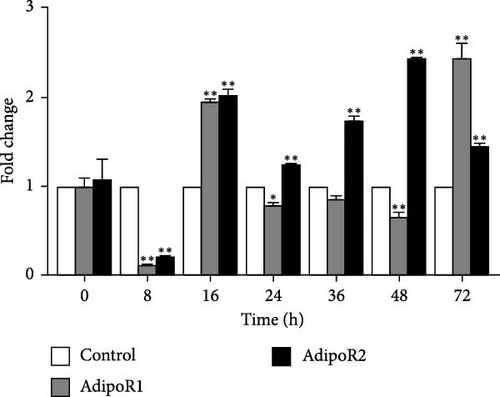
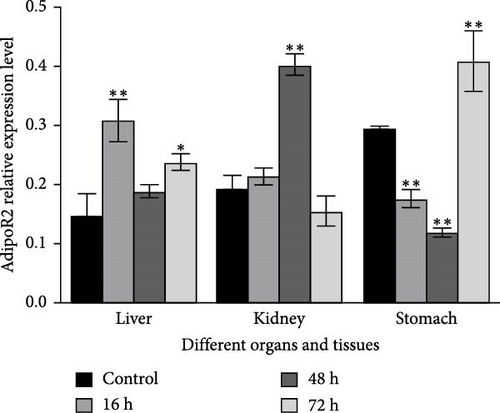
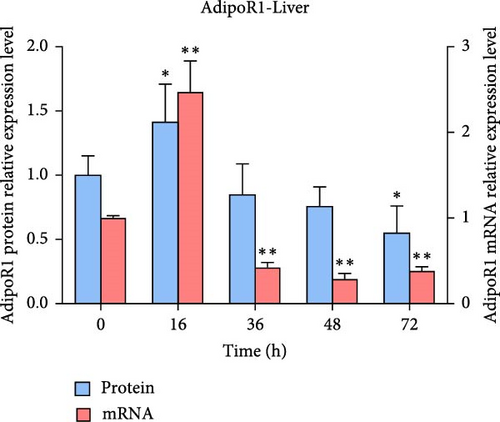
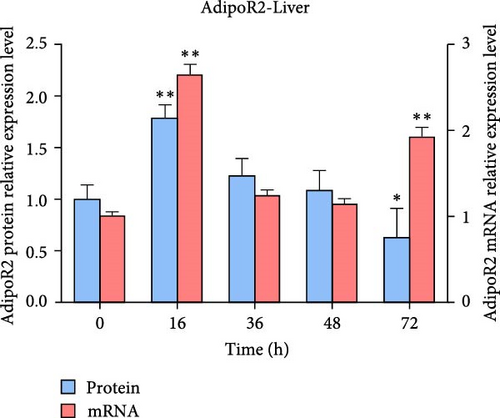
The mRNA levels of RaAdipoR1 and RaAdipoR2 under Ah stress were determined with qRT-PCR. As shown in Figure 5, there was no significant difference in mRNA expression of RaAdipoR1 and RaAdipoR2 in the eight tissues compared with the control group at 0 h. The expression of RaAdipoR1 mRNA in the heart reached its peak at 72 h, which was 1.76-fold that of the control group (p < 0.01). RaAdipoR2 mRNA level reached the maximum at 24 h and 3.63-fold higher than control (p < 0.01; Figure 5A). In the liver, the mRNA levels of AdipoR1 and AdipoR2 reached the maximum at 16 h and 2.47- and 2.71-fold higher than control (p < 0.01), at 48 h of infection, the expression of AdipoR1 and AdipoR2 mRNA decreased to the lowest level (p < 0.01; Figure 5B). In the spleen, AdipoR1 and AdipoR2 mRNA levels reached the maximum at 24 h and 2.96- and 4.02-fold than control (p < 0.01), the expression of AdipoR1 and AdipoR2 mRNA increased first and then decreased (Figure 5C). In the lung, AdipoR1 mRNA reached the maximum at 16 h and 2.95-fold higher than control (p < 0.01), AdipoR2 mRNA reached the maximum at 72 h and 3.72-fold higher than control (p < 0.01; Figure 5D).
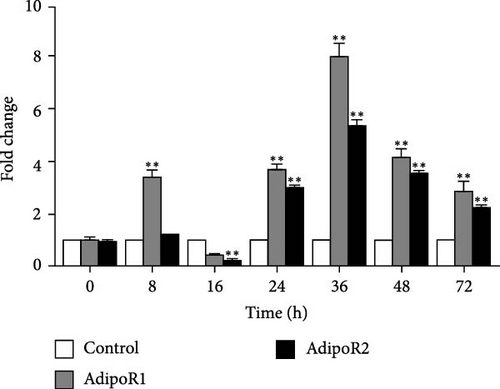
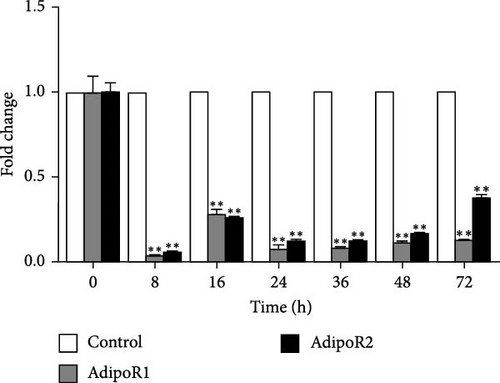
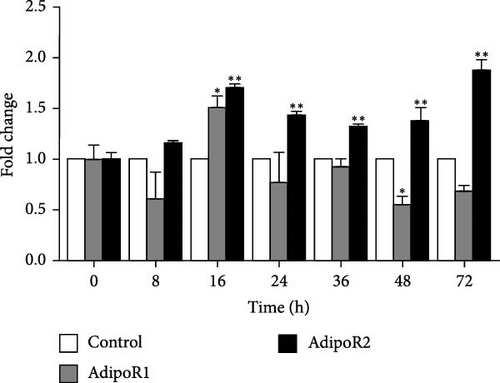
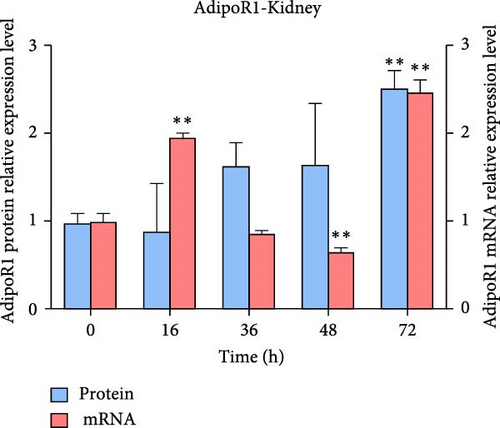
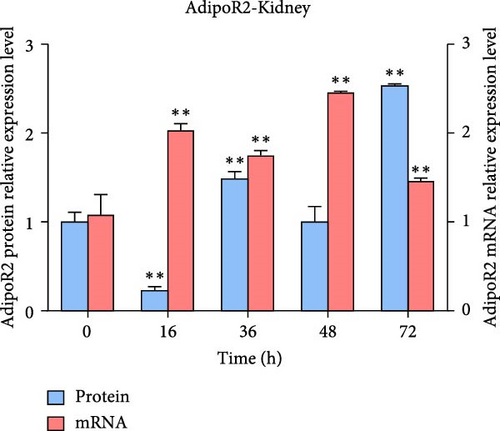
In the kidney, AdipoR1 mRNA reached the maximum at 72 h and 2.46-fold (p < 0.01). AdipoR2 mRNA reached the maximum at 48 h and 2.45-fold (p < 0.01; Figure 5E). In the skin, AdipoR1 and AdipoR2 mRNA levels were all firstly increased and reached the maximum in groups treated at 36 h and 8.11-fold and 5.44-fold (p < 0.01), and then AdipoRs mRNA levels decreased at 72 h (p < 0.01; Figure 5F). AdipoR1 mRNA in muscle exhibited a transient decrease, reaching its lowest level at 16 h (0.28-fold vs. control, p < 0.01), followed by gradual recovery. AdipoR2 mRNA reached the maximum at 48 h and 0.37-fold (p < 0.01) and the expression levels of both were lower than those of the control group (Figure 5G). In the stomach, AdipoR1 and AdipoR2 mRNA levels were also shown the maximum at 16 and 72 h, respectively, and 1.50-fold (p < 0.05) and 1.87-fold (p < 0.01; Figure 5H).
In R. amurensis, the expression trend of AdipoR1 gene in liver, spleen, skin, muscle, and stomach tissues first rises rapidly peaks, and then declines. In heart and kidney, its expression first increases, then decreases, and finally rises to a peak. Notably, the expression of AdipoR2 gene in heart, liver, spleen, and skin reaches a peak first, drops, and rises again. In lung, kidney, muscle, and stomach, its expression gradually peaks. Our study showed that the response time and level of AdipoR1 and AdipoR2 to inflammation are obvious different in different tissues.
3.6. Immunolocalization of AdipoR1 and AdipoR2 Proteins During Infection
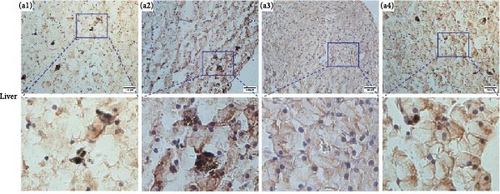
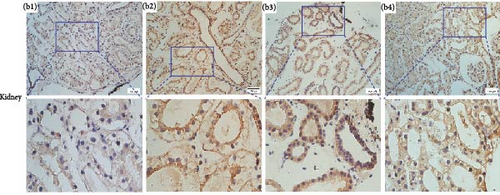
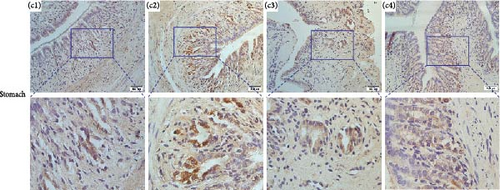
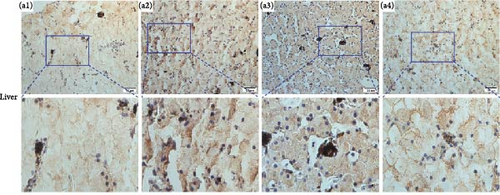
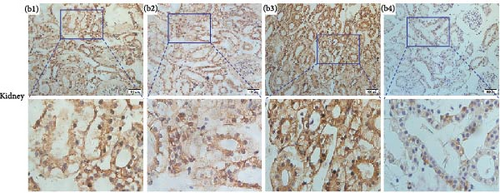
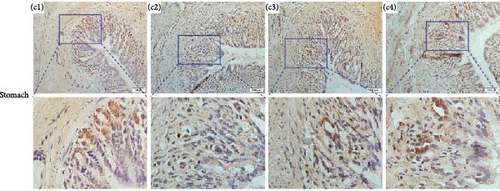
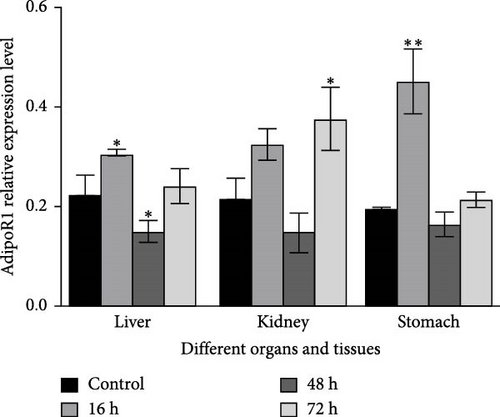
Immunolocalizations for AdipoR1 and AdipoR2 were detected in multiple tissues and organs of R. amurensis. The positive signal of AdipoRs was mainly localized on the cell membrane. In the liver, AdipoR1 and AdipoR2 reached their peak expression levels at 16 h and their expression levels began to decline (Figures 6A(A1–A4) and 7A1–A4). In the kidney, AdipoR1 and AdipoR2 first reached a high level at 16 h and then decreased, and finally AdipoR1 reached a peak at 72 h, and AdipoR2 decreased again after reaching a peak at 48 h. AdipoR1 and AdipoR2 were significatly up-regulated in liver and kidney tissues (Figures 6B(B1–B4) and 7B1–B4. In the stomach, the expression of AdipoR1 peaked at 16 h, and the expression of AdipoR2 peaked at 72 h (Figures 6C(C1–C4) and 7C1–C4). It further proved that the expression of AdipoR1 and AdipoR2 changed significantly after Ah infection, suggested that they could participate in the immune response (Figure 8).
3.7. Expression Profile of RaAdipoR1 and RaAdipoR2 Proteins in Different Tissues During Infectious Stages
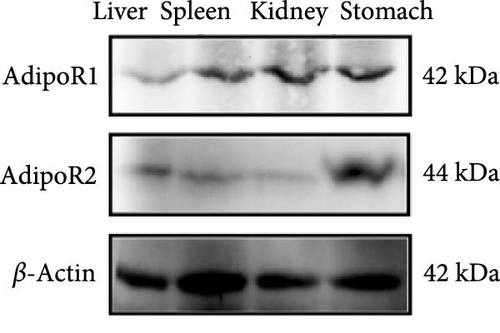
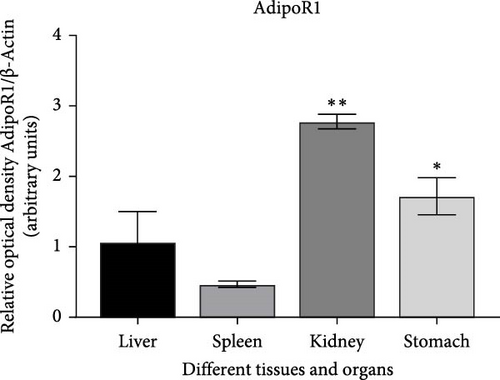
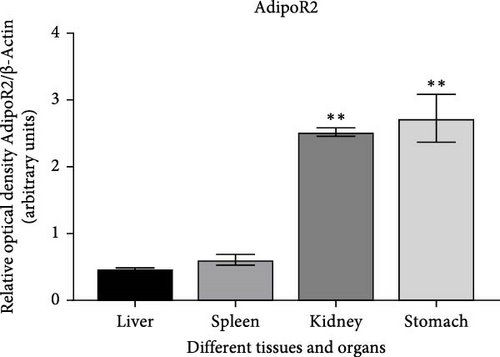
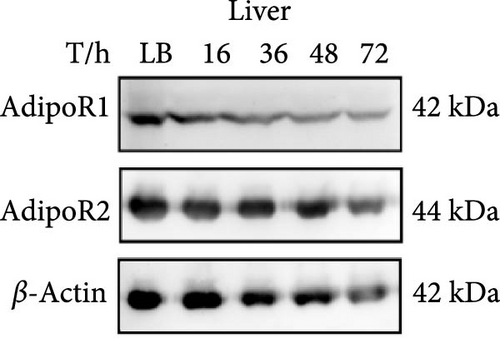
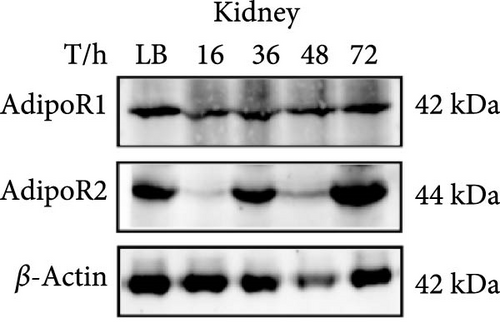
The expression levels of AdipoR1 and AdipoR2 proteins in different tissues were measured by Western blotting (Figure 9). The results showed that AdipoR1 (42 kDa) and AdipoR2 (44 kDa) proteins were expressed in liver, spleen, kidney, and stomach. The expression level of AdipoR1 protein in kidney is higher than that in other three tissues, while the expression level of AdipoR2 protein is the highest in stomach (Figure 9a–c). Under Ah infection, the expressions levels of AdipoR1 and AdipoR2 proteins were upregulated to varying degrees. In the liver, the expression of AdipoR1 and AdipoR2 reached peak at 16 h, which was 1.41- and 1.78-fold higher than that of the control group, respectively (Figure 9d–f). In the kidney, AdipoR1 reached the peak expression level at 72 h, 2.51-fold that of the control group, AdipoR2 expression peak was at 72 h, 2.53-fold that of the control group (Figure 9g–I). The results indicated that RaAdipoRs proteins in the liver and kidney were basically similar to the qRT-PCR results. In the liver, the protein and mRNA levels of AdipoR1 and AdipoR2 show a trend of first increasing and then decreasing; whereas in the kidney, both the protein and mRNA levels exhibit an increasing trend. It suggested that AdipoR1 and AdipoR2 might participate in the processing of immune response by Ah.
4. Discussion
An inflammatory model induced by Ah was successfully constructed in R. amurensis in this study. Through anatomical observation edema and vascular congestion were found among the liver, spleen, and kidney tissues, indicating that Ah-triggered inflammatory reactions in these tissues. Pathological examination confirmed characteristic hepatocyte vacuolation, nuclear condensation, and extensive infiltration of inflammatory cells in liver cells. Previous studies have shown that amphibian liver cellsare usually arranged in a cord like pattern, with red blood cells and white blood cells contained within the sinusoidal capillary spaces. As the core organ for glycogen storage and energy metabolism, the liver mobilizes a large amount of energy reserves for detoxification under pathological stress, with glycogen as the primary energy substrate [44]. The significant glycogen depletion observed in infected individuals suggests that the body reprograms through metabolism to provide energy for immune response [44]. In addition, the infiltration of neutrophils, eosinophils, and monocytes increases after infection, indicating that the liver initiates local immune responses by recruiting white blood cells to curb the spread of pathogens [45].
The kidneys of amphibians are symmetrically distributed on both sides of the midline of the back and are a pair of red, elongated, and flattened lobulated organs. Within the kidneys, renal tubules, renal corpuscles, and collecting tubules can be seen [46]. The kidneys of lower vertebrates are not only important excretory organs but also responsible for the body’s hematopoietic and immune functions. Therefore, inflammatory reactions can also cause swelling, exudation, and other phenomena. The spleen, as the largest peripheral immune organ in the body, plays an important role in immune response. In R. amurensis, the spleen is attached to the mesentery and is an oval shaped organ. As an important immune organ of amphibians, the degree of damage often reflects the immune status and disease development of the body. The pathological phenomenon of this study is consistent with the classic characteristics of amphibian infection, and the histological confirmation of Ah mediated inflammatory damage mechanism marks the successful construction of the Ah inflammation model in R. amurensis.
In this study, two cDNA sequences of AdipoRs from R. amurensis were successfully cloned and identified and the obtained gene and protein sequences were analyzed by bioinformatics software. We predicted that seven conserved transmembrane domains were localized in sequences of RaAdipoRs, which were consistent with these of AdipoRs in human, mouse, pig, chicken, and Cyprinus carpio [47–50]. Structurally, AdipoR1 and AdipoR2 are different from the topology of the G protein coupled receptor family, with their C terminal outside the membrane and N terminal inside the membrane. According to smart analysis, a Hly III domain were also identified in RaAdipoRs and might play crucial roles for RadipoRs’ biological function through forming the special topological structure [51, 52]. Through the observation of 3D structure modeling, it is found that RaAdipoRs have similar structure of human AdipoRs, including 7TM structure, zinc binding site, and putative adiponectin binding surface. It is speculated that RaAdipoRs have similar functional characteristics of human AdipoRs. At the same time, the results of homology analysis and phylogenetic tree analysis of AdipoRs also showed that RaAdipoRs are conserved in an evolutionary relationship and may have the same biological functions as other species.
The innate immune response typically initiates within hours of infection, while the adaptive immune response gradually strengthens over days postinfection [53]. In Gervasi et al.’s [54] study, a significant increase in bacterial killing ability and neutrophil counts was observed in Rana cascadae at 48 h postinfection, indicating the immune system enters the regulation and adaptation phase around this time. Consequently, the study selected time points of 0, 8, 16, 24, 36, 48, and 72 h postinfection for analysis, including a control group. By the analysis of previous researches, it found that AdipoR1 and AdipoR2 were upregulated in inflammatory infection [55]. We further validated this result by quantitative PCR, IHC, and western blotting. The integration of qRT-PCR and western blotting provides robust cross-validation of AdipoR1 and AdipoR2 expression dynamics during infection. The results of qRT-PCR showed that AdipoR1 and AdipoR2 were expressed in many tissues of R. amurensis (p < 0.05). The expression of AdipoR1 and AdipoR2 is relatively high in kidney, muscle, and stomach, and the lowest in heart. In mice, AdipoR1 is abundantly expressed in heart, kidney, lung, skeletal muscle, and spleen [18]. High expression of AdipoR1 provides the receptor that mediates the increased fatty acid oxidation by adiponectin through enhancing fatty acid transport to the mitochondria of these tissues [29, 56]. In mammals, AdipoR1 and AdipoR2 are distributed in almost all tissues. AdipoR1 is highly expressed in skeletal muscle, while AdipoR2 is most abundant in the liver [33]. In chicken, the expression of AdipoR1 mRNA was highest in skeletal muscle, adipose tissue, and diencephalon. It was then followed by the kidney, ovary, liver, anterior pituitary gland, and spleen. On the other hand, AdipoR2 mRNA expression peaked in adipose tissue, followed by skeletal muscle, liver, ovary, diencephalon, anterior pituitary gland, kidney, and spleen [49]. In addition, researchers also found that AdipoRs mRNA is widely distributed in various tissues of carp and there are two subtypes of adipor1a and adipor1b in carp AdipoR1. AdipoR1a and AdipoR1b mRNA had the highest levels in the brain, while the transcript levels of AdipoR2 were highest in the heart, followed by red and white muscles [23]. The distribution of AdipoRs varies across different species such as mammals, amphibian, and fish. AdipoR1 and AdipoR2 exhibit distinct distribution patterns among these species. The tissue-specific expression of AdipoRs is conserved across species from mammals to fish, indicating deep evolutionary conservation in metabolic regulation. However, the R. amurensis shows unique adaptations. Notably, AdipoR2 is highly expressed in the stomach of the R. amurensis, a rarity in mammals. This may suggest an adaptation mechanism under cold conditions, aiding survival in high-latitude environments.
Takemura et al. [57] showed that adiponectin can help macrophages remove early apoptotic cells and regulate inflammation and autoimmunity processes. Excessive body fat is linked to immune system dysfunction and inflammation in both humans and mouse models of obesity [58]. Some studies on mice showed that adiponectin deficiency may contributed to increased inflammation in the case of excess nutrition or tissue ischemia [59, 60]. We found that the expression of adiponectin receptor was upregulated first and then downregulated in different tissues at different time points under Ah stress, which also proved the existence of the immunoregulatory function between adiponectin receptor and adiponectin. In recent years, another adiponectin receptor, T-cadherin has been found, which is also localized adiponectin on organs and tissues [61]. However, it is unclear how the three AdipoRs interact with each other.
Associated researches have proved that AdipoR1 and AdipoR2 are expressed on a variety of immune cell membranes, such as eosinophils, mast cells (MCs), and macrophages [62–64]. In particular, MCs, which are granulocytes present in nearly all tissues, play a crucial role in allergic and inflammatory reactions by participating in signaling pathways [65]. In recent studies, MC was found to express AdipoR1, AdipoR2 and leptin receptor, and responded to these adipokines by producing reactive oxygen. Although, both adiponectin and leptin are involved in the migration of the MCs, adiponectin acted differently from leptin by evidently increasing the mRNA expression of anti-inflammatory cytokines TGF-β and IL-10 [66]. Similarly, it was shown that the expression of IL-1β and IL-10 was significantly upregulated in R. dybowskii after Ah infection [67]. Therefore, it can be inferred that RaAdipoRs is up-regulated and has a role in promoting the migration of MCs. In studieson peripheral inflammation (tissue edema) in rats, adiponectin may modulate pain and peripheral inflammation by activating AdipoRs, thus, acting both peripherally and centrally at the spinal cord level. Therefore, it is speculated that RaAdipoRs have similar anti-inflammatory functions [68]. Subsequent data has confirmed that the AdipoR1–AdipoR2 signaling pathway can inhibit anaphylaxis. It is thought that AdipoR1 and AdipoR2 may regulate the IgE-independent or pseudo-allergy pathway [69]. There is research evidence that T cells express AdipoRs in cells under antigen-specific stimulation and the cell surface upregulates AdipoRs [70]. Recent research has shown that the low-molecular-weight isoforms of adiponectin and AdipoRs have anti-inflammatory activity in the lung environment; targeting adiponectin receptor may be a new way to control airway inflammation [71]. In our experiment, the expression of AdipoRs gene in the lungs of R. amurensis was significantly upregulated after infection, suggesting that AdipoRs might participate in the anti-inflammatory reaction. Under the stress of Ah, the AdipoRs gene in R. amurensis is highly expressed, indicating that the molecule may mainly participate in the realization of amphibian immune function. Since the skin of amphibians is exposed to the external environment with a large number of pathogens, the high expression of AdipoRs in the skin indicates that it may participate in immune function during infection.
In conclusion, the results of the present study demonstrated that AdipoR1 and AdipoR2 cDNA from R. amurensis contained 1137 bp (378 amino acids) and 1164 bp (387 amino acids). respectively. AdipoR1 and AdipoR2 proteins showed high identity with other animals. The higher mRNA expression levels of AdipoR1 and AdipoR2 were found in the kidney, muscle, stomach, skin, and spleen in healthy R. amurensis. The effects of Ah infection on the expression of AdipoRs in different tissues were also verified by qPCR, IHC, and western blot, indicated that AdipoRs may participate in immune response during infection. In the immune response of R. amurensis, AdipoRs show significant tissue-specificity and temporal regulation. Future research could explore their crosstalk with the TGF-β pathway, clarify their role in the innate immune network, and offer new insights into the function of amphibian AdipoRs.
Ethics Statement
The experimental animal in this study is the artificial breeding Rana amurensis, which has obtained the informed consent of the farm owner. All experimental animal procedures were reviewed and approved by the Committee for Animal Experimentation of Harbin Normal University (No. HNUARIA2021002). All experiments were performed following the approved guidelines and regulations. All methods are reported in accordance with ARRIVE guidelines (https://arriveguidelines.org) for the reporting of animal experiments.
Consent
The authors have nothing to report.
Conflicts of Interest
The authors declare no conflicts of interest.
Author Contributions
Yugang Sun, Dongmei Xu, and Jinhan A have contributed equally to this work. Yugang Sun, Dongmei Xu, Jinhan A, Huimin Ren, and Hina Hassan wrote the manuscript and conducted experiments together. Yufen Liu, Peng Liu, and Wenge Zhao revised the manuscript. Yugang Sun and Yufen Liu provided financial support. All authors have read and approved the final manuscript.
Funding
This work was financially supported by Natural Science Funds of Heilongjiang province, China (Project No: LH2021C053) and the Innovation Project for Doctoral Candidates of Harbin Normal University (HSDBSCX2022-06) .
Acknowledgments
We want to thank the Laboratory of Vertebrate Zoology from College of Life Sciences and Technology in Harbin Normal University for providing Aeromonas hydrophila strain (dw1701-1909) and the Laboratory of Biochemistry and Molecular Biology for providing the experimental equipment.
Supporting Information
Additional supporting information can be found online in the Supporting Information section.
Open Research
Data Availability Statement
The datasets and materials used and/or analyzed during the current study are available from the corresponding author on reasonable request. The coding RNA sequences of Rana amurensis AdipoR1 and AdipoR2 obtained in this study, have been uploaded to the genbank database (Rana amurensis AdipoR1 (ON652852): https://www.ncbi.nlm.nih.gov/nuccore/ON652852 and Rana amurensis AdipoR2 (ON652854): https://www.ncbi.nlm.nih.gov/nuccore/ON652854).


