Brain Transcriptome Profiles of Greater Amberjack (Seriola dumerili) Juveniles Under Long-Term Hypo- and Hypersaline Stress
Abstract
The fish brain plays a crucial role in regulating growth, reproduction, development, and adaptation to environmental stress. However, there are few studies that have examined the entire fish brain transcriptome and its responses to long-term hypo- and hyper-salinity stress. Greater amberjack (Seriola dumerili) has a high commercial value in mariculture worldwide due to its high growth rate and excellent flesh quality. Consequently, high-throughput RNA-Seq was employed to elucidate the molecular regulatory mechanisms underlying salinity adaptation by identifying gene expression changes in the brain of greater amberjack exposed to elevated and/or reduced salinity environments. We subjected individuals to salinity levels of 20, 30, and 40 ppt (parts per thousand) for 30 days. A total of 272 (198 up-regulated and 74 down-regulated) differentially expressed genes (DEGs) were identified in the B30 vs. B20 group, 21 (10 up-regulated and 11 down-regulated) DEGs in the B30 vs. B40 group, and 343 (119 up-regulated and 224 down-regulated) DEGs in the B20 vs. B40 group. Transcriptomic analysis revealed that salinity stress influenced the expression of genes associated with amino acid metabolism and transport (gpt, arg2, LOC111237759, slc3a2, and slc7a5), carbohydrate metabolism (aldob, ldhba, and gapdh), and signal transduction (map3k8, map3k2, map2k7, and lepr). Kyoto Encyclopedia of Genes and Genomes (KEGG) enrichment analysis indicated that the DEGs were significantly enriched in metabolism pathways, especially in amino acid and carbohydrate metabolism, transcription, translation, et cetera. Furthermore, gene set enrichment analysis (GSEA) demonstrated that the metabolism, signal transduction, translation, immune system, and transport and catabolism pathways were more active in the brain. These findings provide a foundation for further studies to clarify the molecular mechanisms of salinity adaptation and transcriptional regulation in the brain of marine fish.
1. Introduction
Salinity is a significant environmental stressor that threatens the distribution and physiological processes such as survival, growth, tissue water content, and hemolymph osmolarity of global marine and estuarine organisms [1–5]. Osmoregulation serves as a crucial adaptive mechanism for aquatic organisms in varying salinity environments and has been the subject of extensive research [6–8]. Fluctuations in environmental osmotic pressure have profound effects on teleosts at the molecular, cellular, and whole-organism levels, necessitating adaptive changes to maintain normal physiological functions [6]. During osmoregulation, the fish osmotic pressure sensors first perception of osmotic pressure and then transmit the osmotic sense signal to the brain before generating responses to relieve osmotic pressure [9]. However, much of the existing research has concentrated on osmosensory effectors and associated metabolism pathways, including the transport of ions, water, or amino acids, as well as enzyme activity in osmoregulation processes [8, 10, 11]. Despite this progress, the understanding of osmotic sensing and stress signal transduction at the molecular level remains insufficient.
The brain, as the central component of the nervous system in vertebrates, plays a comprehensive and collaborative role in regulating temperature control, osmotic stress resistance, muscle activity, and sensory system under stress conditions. In fish, the brain, particularly the pituitary gland and its adjacent hypothalamus, is crucial for maintaining osmotic homeostasis throughout the organism [8, 12]. Variations in environmental salinity can alter plasma osmotic pressure in fish, subsequently affecting the extracellular fluid surrounding brain cells [13]. Therefore, the fish brain contains sensitive target tissues to thoroughly explore the osmosensors and osmosensory signal transductor for osmoregulation. The impacts of hypo- and hyper-osmotic stress on the osmotic regulation of the fish brain have been extensively studied. For instance, certain hormones secreted by the brain, especially the hypothalamus and pituitary, are involved in the process of osmotic regulation in response to changes in salinity, such as prolactin (Prl) and corticotrophin-releasing hormone (Crh). Prl is a hormone that aids acclimation to freshwater and has been shown to modify the physiological processes by reducing tissue permeability and active ion uptake [14, 15]. Crh targets the pituitary gland to stimulate the release of adrenocorticotropic hormone (ACTH), thereby stimulating the production and release of cortisol from adrenal/interrenal cells, which plays a dual role in stress and osmoregulatory responses [16, 17]. In gilthead sea bream (Sparus auratus), transferring fish from seawater (SW) to hyper-saline water (HSW) significantly increased the activity of enzymes, such as hexokinase and phosphofructokinase, involved in energy metabolism regulation within brain tissue, thereby, reflecting the brain’s positive role in osmotic regulation [18]. Furthermore, in the brain of Nile tilapia (Oreochromis niloticus), the myoinositol biosynthesis (MIB) pathway plays an important role in the accumulation of the compatible osmolyte, myoinositol, in cells in response to hyperosmotic challenge [19]. Metabolic and immune-related pathways, ovarian steroidogenesis, and signal transduction contribute to the organism’s ability to cope with long-term hyper-salinity stress in tilapia [8]. Therefore, identifying the key osmoregulatory genes and elucidating their functions is essential for enhancing our understanding of osmotic regulation at the molecular level and for improving fishery yields.
With the advancement of high-throughput sequencing, RNA-Seq has emerged as a powerful method for discovering and identifying putative genes involved in stress responses across various species [20–25]. Identifying genes associated with salinity adaptation represents the initial step toward elucidating the molecular mechanisms underlying osmotic regulation. For example, three potential osmoregulation-related signaling pathways have been identified in the gills of Siberian sturgeon (Acipenser baeri) in response to high salinity stress: pathways related to lipid metabolism, tight junction, and thyroid hormone signaling [20]. A combination of transcriptome analysis, real-time (RT) q-polymerase chain reaction (PCR) and immunohistochemistry has been employed to investigate the effects of environmental salinity changes on immune-related genes in Japanese eel (Anguilla japonica) gill cells [26]. Recent studies have also highlighted differentially expressed genes (DEGs) in the brain and liver of certain fish species under osmotic stress, emphasizing pathways associated with growth, reproduction, immunity, osmoregulation, energy metabolism, ion transporters, and oxidative stress [8, 27–29]. However, in contrast to other extensively studied osmoregulatory and metabolic organs such as the gills, kidney, and liver [20, 26–28, 30–32], the brain’s response to osmotic regulation remains poorly understood. This study aims to address this gap by performing a comparative transcriptomic analysis of greater amberjack brain tissues under salinity stress.
The greater amberjack is a warm-water migratory fish that inhabits off-shore waters and is widely distributed in the Atlantic, Indo-Pacfic Oceans, and the Mediterranean Sea [32, 33]. This species holds significant commercial value worldwide and is considered one of the most suitable fish for breeding in deep-sea cages in the South China Sea. The optimal salinity for the growth of greater amberjack ranges from 29 to 36 ppt (parts per thousand), while levels below 25 ppt are detrimental to its growth [34]. Previous research on greater amberjack has investigated the effects of long-term salinity stress on gill osmoregulation [31], liver lipid, and energy metabolism [33], as well as the expression of pituitary growth-related genes (prl and growth hormone (gh)) [35]. Additionally, acute salinity stress impacts the expression of genes related to ion transport and osmoregulation, cell growth and development, and immune response in the kidneys and gills of greater amberjack [32]. However, the molecular regulatory mechanism underlying salinity adaptation in the greater amberjack brain is still unclear. Our research aims to elucidate the specific effects of environmental salinity changes on the gene expression profile of brain tissue, focusing on the identification of brain tissue-specific physiological pathways under hypo- (20 ppt), natural SW (30 ppt), and hyper-salinity (40 ppt) conditions. The working hypothesis posits that fish living in different salinity environments should exhibit specific gene expression patterns associated with physiological responses to salinity. To address this hypothesis, RNA-Seq technology was employed to explore the gene expression profiles of brain tissue in juvenile greater amberjack exposed to varying salinity environments. These findings will enhance our understanding of the molecular regulatory mechanism that facilitate adaptation to salinity stress in greater amberjack, thereby, providing practical guidance for its commercial production in aquaculture.
2. Materials and Methods
2.1. Ethics Statement
Greater amberjack were conducted following the guidelines and approvals of the Institutional Animal Care and Use Committee of Guang Dong Ocean University (Zhanjiang, China; NIH Pub. No. 85-23, revised 1996) with approval number GDOU-IACUC-2021-A1220, and the laws and regulations of China on biological research [31].
2.2. Experimental Design for Salinity Stress
The experiment was carried out at the Donghai Island Cultivation Base (Zhanjiang, Guangdong, China). Before the experiment, healthy juvenile greater amberjack (body length: 8.33 ± 0.45 cm; body weight: 6.38 ± 1.33 g) were acquired and acclimatized for 1 week in an indoor cement pool with a water volume of 21 m3 at 21 ± 1.0°C and natural SW salinity (30 ppt). The fish were fed with commercial floating bait (Guangdong Yuequn Biotechnology Co., Ltd, Jieyang, China; total feed amount was ~3% of body weight) twice daily (depending on the feeding situation of the fish). After acclimatization, 80 juveniles were randomly divided into four cylindrical 1000 L tanks (20 individuals per tank) at different salinities: 40, 30, 20, and 10 ppt. Salinity 30 ppt was chosen as control salinity (B30 group), salinity 40 ppt as hyper-salinity (B40 group), salinity 20 ppt, and 10 ppt as hypo-salinity (B20 and B10 groups). The fish were then temporarily cultured in an environment with a water temperature of 22 ± 1°C and a salinity of 30 ppt for 1 week. During this period, dissolved oxygen levels were maintained close to saturation, ranging from 6.5 to 7.0 mg/L. At the onset of the experiment, the salinity of the hypo-salinity group decreased at a rate of 5 ppt every 48 h, while the salinity of the hyper-salinity group increased at the same rate. The salinity of the water was checked three times a day and changed every 24 h. The process of salinity regulation is shown in Table S1. The salinities of the 10 and 20 ppt groups were reduced using aerated tap water, whereas the salinity of the 40 ppt group was increased using commercial SW crystals (Xuwen County Hailong Marine Biological Preparation Factory, Zhanjiang, China). The selection of salinity level in this experiment was based on previous studies on the adaptation of juvenile greater amberjack to salinity [31, 33, 36]. Fish in the control group were maintained at a natural SW salinity of 30 ppt throughout the experiment. Based on research on other fish species under different salinity stresses, including Asian bass (Lates calcarifer) [37], cobia (Rachycentron canadum) [38], and catfish (Lophiosilurus alexandri) [39], juvenile greater amberjack were sampled at 0, 15, and 30 days after treatment. The fish were fed with commercial floating bait (total feed amount was ~3% of body weight) twice daily (9:00 and 19:00) for 30 days. Afterwards, all the fish were starved for 24 h before the experiment. When subjected to the salinity stress for 30 days, our previous study found that all fish in the 10 ppt group died within 10 days, and the mortality rate of all experimental fish in the other groups varied from 25.00% to 40.00% [33]. Three experimental groups with salinities of B30 vs. B20, B30 vs. B40, and B20 vs. B40 were analyzed. During the experiment, six fish were randomly selected from each tank and anesthetized with 100 mg/L methane sulfonate (MS 222; Sigma–Aldrich, MO, USA), followed by immediate sampling. Whole brain tissues were put in an RNA stabilization reagent (Accurate Biology, Changsha, China) overnight before storage at −80°C for RNA extraction and reverse transcription.
2.3. RNA Extraction and Library Preparation for Illumina Sequencing
Transcriptome data from greater amberjack brain tissues subjected to hyper- and hypo-salinity stress were submitted to the National Center for Biotechnology Information (NCBI) Sequence Read Archive (SRA) under bioproject number (PRJNA893248; SRR22014018-SRR22014026). RNA extraction, purity, and degradation detection, library construction, and transcriptome sequencing were carried out following previous research methods [31, 33, 40]. Total RNA was isolated from brain tissue using Trizol reagent (Invitrogen, CA, USA). Initially, whole brain samples were thoroughly mixed in 1.5 mL centrifuge tubes and homogenized using magnetic beads in a tissue crusher at 4°C for several minutes. A portion of the homogenized was then taken for further grinding and extraction. NanoPhotometer spectrophotometer (Nanodrop 2000c, Thermo Scientific, DE, USA) was used to check the RNA concentration and purity. RNA degradation was detected by 1.5% agarose gel electrophoresis. And RNA integrity was assessed using an Agilent 2100 bioanalyzer (Agilent Technologies, CA, USA). Whole brain total RNA with an RNA integrity number (RIN) score ≥8 was used for sequencing. The TrueSeq RNA Sample Prep Kit (Illumina, CA, USA) was used to synthesis complementary DNA (cDNA) libraries from brain tissue according to the manufacturer’s instructions. Brain mRNA was isolated from total RNA using magnetic beads attached with oligo-(dT) (Illumina, CA, USA) and randomly fragmented using fragmentation buffer. First-strand cDNA was then synthesized using random hexamer primers and reverse transcriptase. RNaseH, DNA Polymerase I, dNTPs, and buffer were then added to synthesize the second strand of cDNA. This process was followed by end repair, adaptor ligation, fragment sorting and size selection, and amplification by PCR. After library construction, quantity and quality were examined using Agilent Bioanalyzer 2100 and Qubit 2.0, respectively. The libraries were sequenced using the Illumina NovaSeq6000 platform (Illumina, CA, USA) at Biomarker Technologies Co., Ltd. (Beijing, China), generating paired-end reads of 150 bp with a sequence read depth of 14.2x. Three replicates (using one fish as a biological replicate) of transcriptome sequencing for B20, B30, and B40.
2.4. Bioinformatics Analysis
The bioinformatic analysis of transcriptome data includes several parts: reads quality control, assembly, differential expression analysis, and gene function annotation. The raw data (raw reads) in fastq (version 0.22.0) format were first processed by in-house perl scripts. In this step, clean data (clean reads) were obtained by removing adapter contamination and filtering out low-quality reads with a N > 10% and a Q ≤ 10% (over 50% of the total read length) bases number from the raw data. Meanwhile, the Q20, Q30, and GC contents of the clean reads were calculated. Clean reads with Q20 > 95%, Q30 > 85%, and GC content of 50%–60% were considered as high-quality. Next, the high-quality clean reads were quickly and accurately aligned to the greater amberjack reference genome (BDQW01000001-BDQW01034655 (Biosample ID: SAMD00083043_sdu_WGS.acclist.zip)) using HISAT2 (version 2.0.4) [41]. The clean data were then assembled using StringTie (version 1.3.4d) with default parameters. Functional annotation was performed by sequence alignment with the public database (https://blast.ncbi.nlm.nih.gov/) using BLASTx (version 2.2.31) with an e-value threshold = 1 × e−5. Gene Ontology (GO) functional results were obtained using Blast2Go (http://www.blast2go.com/; version 2.5.0) program (e-value threshold 1 × e−5). An overview of metabolic pathway analysis was presented using the online Kyoto Encyclopedia of Genes and Genomes (KEGG) (http://www.genome.jp/kegg/), which is a powerful tool for conducting metabolic analysis and metabolic regulatory network research.
StringTie (version 1.3.4d) counted mapped reads from the alignments and estimated gene expression levels using the fragments per kilobase of transcript per million fragments mapped (FPKM) algorithm. The DESeq2 R package (version 3.8.6) was then used to perform statistical analysis on the differential gene expression of the three experimental groups (B20, B30, and B40). Principal component analysis (PCA) analysis was performed on the FPKM scores to assess differences between and within groups. Genes with a significant false discovery rate (FDR) <0.05 and an absolute fold change value ≥2.0 were considered to be significantly differentially expressed. Then, GO and KEGG enrichment analysis was carried out to identify significant DEGs. GO terms and KEGG pathways with p < 0.05 were defined as significantly enriched.
2.5. Gene Set Enrichment Analysis (GSEA)
GSEA was also used to detect the expression changes across the entire gene set. This enrichment tool can fully detect genes that are not significantly different in expression levels but play important biological roles at the overall level. To investigate the stimulatory effect of long-term salinity stress on various biological function gene sets in greater amberjack brain, differences in gene mRNA expression levels of biological function annotations and pathways between control, hypo-, and hypersalinity treatment groups (B30 vs., B20, B30 vs., B40, and B20 vs., B40) were analyzed by GSEA. FDR < 0.25, NOM p-value < 0.05 and |NES|>1 were considered significant enrichment, with FDR representing the p-value adjusted for false discovery rate.
2.6. Validation of DEGs by Quantitative Real-Time Polymerase Chain Reaction (RT-qPCR)
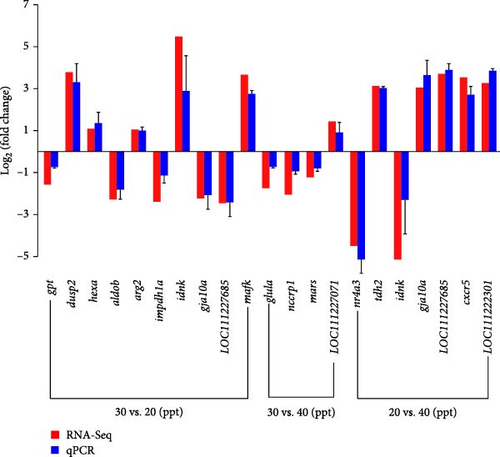
Here, 18 DEGs were randomly selected for RT-qPCR examination to verify the accuracy of the DEGs from the transcriptomic sequencing data. Total brain RNA was extracted individually from the B20, B30, and B40 groups. RNA samples were subjected to RT-qPCR analysis with three independent biological and two technical replicates. RT-qPCR reactions were performed on a LightCycler 96 system (Roche, Basel, Switzerland) using SYBR Green MasterMix (Toyobo, Japan) [42]. The reaction process was as follows: initial denaturation (95°C, 5 min), followed by 40 cycles of denaturation (95°C, 30 s), annealing (58°C, 20 s), and extension (72°C, 20 s; fluorescence collection). The specificity of the assay was determined by the melting curve and melting peaks, where a single peak indicates a product and more than one indicates a possible nonspecific reaction [43, 44]. Primer 5 software (Premier Biosoft International, CA, USA) was used to design the gene-specific primers for the 18 target genes. The primer sequences are listed in Table 1. The relative expression levels of DEGs were calculated using the formula R = 2−ΔΔCt method [43, 45, 46]. The reference geneβ-actin was used to normalize the expression values. Data was expressed as log2 (fold change), using means ± standard error (SE; n = 3). The statistical analysis was performed using SPSS 18.0 software (SPSS Inc., Chicago, IL, USA).
| Gene | Accession number | Primer name | Primer sequence (5′−3′) | Amplicon length (bp) |
|---|---|---|---|---|
| β-actin | KX570957 | β-actin-F | 5`-TGATGAAGCCCAGAGCAAGAG | 113 |
| β-actin-R | 5`-CGTTGTAGAAGGTGTGATGCCA | |||
| gpt | XM_022766245 | gpt-Q-F | 5`-TGATGCCATTGTGACCATGCTGAA | 168 |
| gpt-Q-R | 5`-TCCAGACTCCAACACTTGTCCTCAT | |||
| dusp2 | XM_022766940 | dusp2-Q-F | 5`-AGGCATCACGGCTGTGCTCAA | 138 |
| dusp2-Q-R | 5`-ATGAAGGCGATGGCTGTGGAGAA | |||
| hexa | XM_022754616 | hexa-Q-F | 5`-ACACAACTGGGCTCACTACTACACT | 197 |
| hexa-Q-R | 5`-AACTGGAGGTCTGCTTCTCATCACT | |||
| aldob | XM_022751572 | aldob-Q-F | 5`-CTCTTCTCCTCTGACGCCTCCAT | 141 |
| aldob-Q-R | 5`-CACCTTGATGCCGACAACAATGC | |||
| arg2 | XM_022766135 | arg2-Q-F | 5`-AGAGCACCACATCCTGAAGAACCT | 196 |
| arg2-Q-R | 5`-TCCGTTCACTGGCGTTCCTGT | |||
| impdh1a | XM_022754564 | impdh1a-Q-F | 5`-GCTCTATCTGTATCACCCAGGAAGT | 111 |
| impdh1a-Q-R | 5`-CATCAGCGATTACTGGCACTCC | |||
| idnk | XM_022757754 | idnk-Q-F | 5`- GATTGCCTTGGCTTCTCAAACTA | 165 |
| idnk-Q-R | 5`-GCAGGATTTCTTGGTCTGGACT | |||
| gja10a | XM_022750100 | gja10a-Q-F | 5`-TTGTCCTCCTTTAGTCGCTCCAC | 130 |
| gja10a-Q-R | 5`-ACATACTCATTGACATCCTTCGGC | |||
| LOC111227685 | XM_022753318 | LOC111227685-Q-F | 5`-GATTACAGCCTGCTCAAATGGGT | 200 |
| LOC111227685-Q-R | 5`-TGGTGGTGTCATACAGAGAGGAGAA | |||
| mafk | XM_022739356 | mafk-Q-F | 5`-CAAGTATGAGGCCCTGCAGTGT | 115 |
| mafk-Q-R | 5`-GTTGTTGTGGTTGGCGGACTT | |||
| glula | XM_022768716 | glula-Q-F | 5`-GCCAGCATCCGCATTCCTCGTA | 138 |
| glula-Q-R | 5`-GTCTCCTTCCTCGTTCAGCAAGCA | |||
| nccrp1 | XM_022746031 | nccrp1-Q-F | 5`-GACCTCAGCACTTACTCACACACCT | 140 |
| nccrp1-Q-R | 5`-CCAGTGAACAGTGTGGGGTAGAA | |||
| mars | XM_022748265 | mars-Q-F | 5`-ACGCCATTCACTCCAGCATCTA | 126 |
| mars-Q-R | 5`-GGAATTCATGCTTGTGGAGTCG | |||
| LOC111227071 | XM_022752456 | LOC111227071-Q-F | 5`-GTGACAGTGGTGACACAGAAGCC | 177 |
| LOC111227071-Q-R | 5`-GTAAGTTACAGACCACCAGCCATG | |||
| nr4a3 | XM_022765835 | nr4a3-Q-F | 5`-ACTACGGCGTTCGCACTTGT | 176 |
| nr4a3-Q-R | 5`-CACTTCCTTCACCATGCCCA | |||
| tdh2 | XM_022751093 | tdh2-Q-F | 5`-ATCACGAGTGCTATTTGCGACC | 183 |
| tdh2-Q-R | 5`-GAGGGAGATGCTTGCGGATT | |||
| cxcr5 | XM_022761494 | cxcr5-Q-F | 5`-GACCCCGACAATGATACAGACTAC | 152 |
| cxcr5-Q-R | 5`-CCTACTACACCCAGCAGGAAGAT | |||
| LOC111222301 | XM_022745990 | LOC111222301-Q-F | 5`-CCAGAGCAATACACCTCAACAAAG | 136 |
| LOC111222301-Q-R | 5`-ACTGAAAGCCCACACTTGACG | |||
- Abbreviations: aldob, fructose-1,6-biphosphate aldolase B; arg2, arginase 2; cxcr5, C–X–C motif chemokine receptor 5; dusp2, dual specificity phosphatase 2; gja10a, gap junction protein alpha 10 a; glula, glutamate-ammonia ligase (glutamine synthase) a; gpt, glutamic–pyruvic transaminase; hexa, hexosaminidase A (alpha polypeptide); idnk, IDNK gluconokinase; impdh1a, IMP (inosine 5`-monophosphate) dehydrogenase 1a; LOC111222301, collagenase 3-like; LOC111227071, immunoglobulin lambda-1 light chain-like; LOC111227685, Krueppel-like factor 10; mafk, v-maf avian musculoaponeurotic fibrosarcoma oncogene homolog K; mars, methionyl-tRNA synthetase; nccrp1, P1, F-box associated domain containing; nr4a3, nuclear receptor subfamily 4, group A, member 3; tdh2, L-threonine dehydrogenase 2.
3. Results
3.1. Illumina Sequencing Assembly
Transcriptome sequencing was performed on brain tissues from three groups subjected to different salinity concentrations (20, 30, and 40 ppt), generating 289,381,274 clean reads (Table 2). The clean reads included 95.27 million (B20), 103.87 million (B30), and 90.23 million (B40) data with Q20 (98.53%−98.71%), Q30 (95.42%−95.89%) levels, and 50.67%−52.39% GC contents. All 564.04 million reads from the nine sequencing libraries were successfully mapped to the assembled greater amberjack reference sequences and included 473.42 million uniquely mapped reads.
| Sample namea | B20-1 | B20-2 | B20-3 | B30-1 | B30-2 | B30-3 | B40-1 | B40-2 | B40-3 |
|---|---|---|---|---|---|---|---|---|---|
| Clean reads (106) | 32.81 | 35.60 | 26.86 | 36.11 | 35.20 | 32.56 | 31.38 | 30.12 | 28.73 |
| Clean base | 98.06 G | 106.65 G | 80.41 G | 107.93 G | 105.37 G | 97.38 G | 93.89 G | 90.17 G | 85.88 G |
| Q20 (%)b | 98.53 | 98.64 | 98.69 | 98.53 | 98.60 | 98.70 | 98.70 | 98.71 | 98.59 |
| Q30 (%)c | 95.44 | 95.66 | 95.83 | 95.42 | 95.55 | 95.88 | 95.89 | 95.89 | 95.54 |
| GC contents (%) | 51.66 | 50.83 | 50.67 | 52.39 | 51.54 | 51.45 | 51.61 | 51.29 | 51.83 |
| Total mapped (106)d | 64.26 | 69.62 | 52.51 | 69.96 | 68.65 | 63.42 | 61.37 | 58.88 | 55.37 |
| Mapping rate (%) | 97.93 | 97.76 | 97.73 | 96.87 | 97.52 | 97.39 | 97.78 | 97.74 | 96.37 |
| Uniquely mapped (106)e | 53.25 | 59.67 | 46.15 | 56.34 | 58.89 | 52.73 | 51.42 | 49.32 | 45.65 |
| Uniquely mapped rate (%) | 81.15 | 83.79 | 85.90 | 78.00 | 83.66 | 80.97 | 81.93 | 81.88 | 79.46 |
- aSample name
- bQ20: The percentage of bases with a Phred value > 20.
- cQ30: The percentage of bases with a Phred value > 30.
- dThe number of clean reads that mapped onto the annotated genome.
- eThe number of clean reads that uniquely mapped onto the annotated genome.
3.2. Identification of DEGs
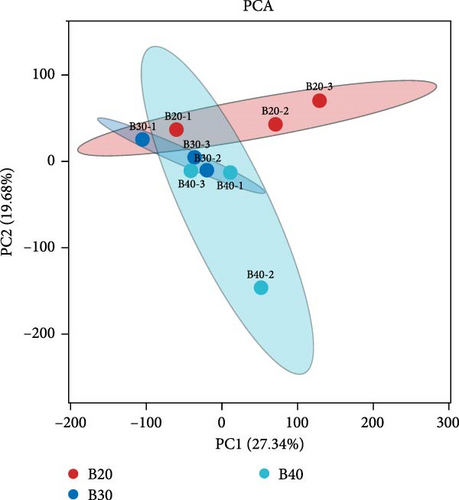
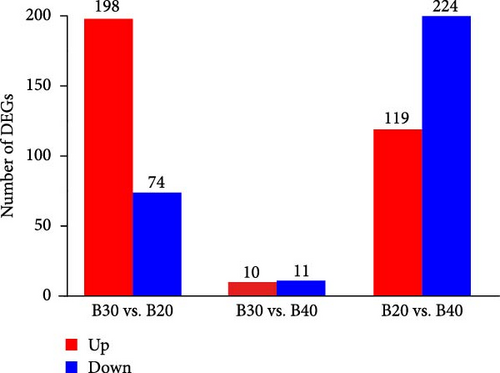
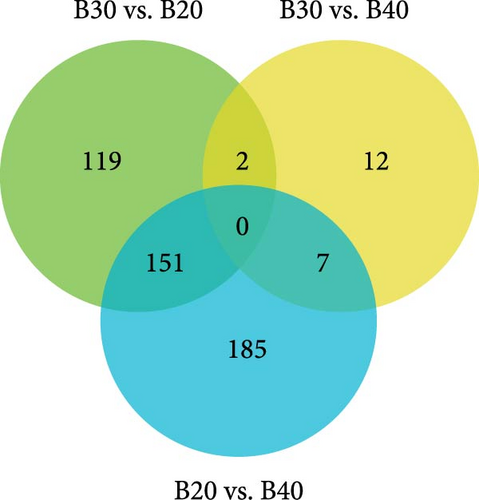
PCA analysis showed that all biological replicates of each group clustered together, where 27.34% and 19.68% of the variations were explained by the first and second principal components (PCs), respectively (Figure 1). In total, 636 DEGs were identified in the three salinity treatment groups following the FDR < 0.05 and |Log2 (FC)| ≥ 1 filtering criteria. The B20 group contained 272 DEGs, including 198 up-regulated and 74 down-regulated genes compared to the B30 group (Figure 2A). The B30 vs. B40 and B20 vs. B40 groups contained 21 (10 up-regulated and 11 down-regulated) and 343 (119 up-regulated and 224 down-regulated) DEGs, respectively (Figure 2A). The top 10 up- and down-regulated DEGs among the comparison groups are shown in Table S2. A Venn diagram showed the logical association between the three different salinity treatment groups, and no coexpressed DEGs were observed in any of the three comparison groups (B30 vs., B20, B30 vs., B40, and B20 vs., B40; Figure 2B).
3.3. Annotation and Function Analysis of Brain Transcripts
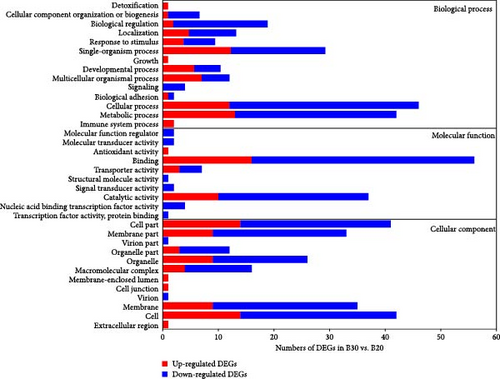
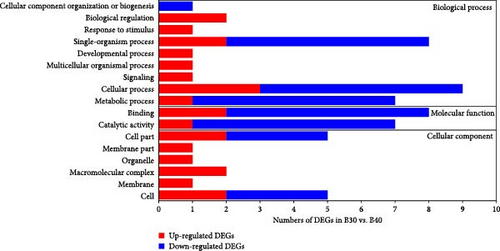
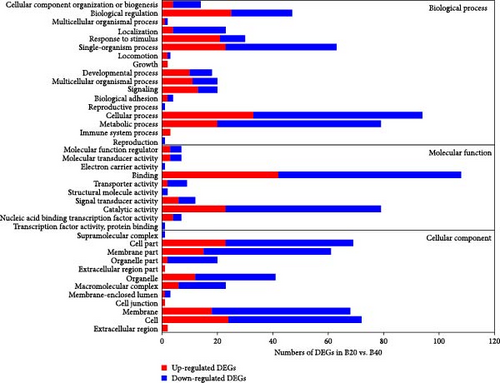
GO enrichment analysis revealed that all annotated DEGs were divided into three categories: biological process (BP), molecular function (MF), and cellular component (CC). The majority of DEGs in the BP category enriched the metabolism process (GO:0008152), single-organism process (GO:0044699), and cellular process (GO:0009987; Figure 3). Furthermore, the transferrin transport (GO:0033572) was significantly enriched in the B30 vs B20 group, while gamma-aminobutyric acid (GO:0009448) and nucleic acid metabolic process (GO:0090304) were the top enriched GO terms in the B30 vs. B40 and B20 vs. B40 groups, respectively (Table S3). Within the MF category, the catalytic activity (GO:0003824) and binding (GO:0005488) were the most dominant subcategories (Figure 3), and the transferrin receptor activity (GO:0004998), NADP binding (GO:0050661), and unfolded protein binding (GO:0051082) were the top enriched GO terms in the B30 vs. B20, B30 vs. B40, and B20 vs. B40 groups, respectively (Table S3). Additionally, the cell part (GO:0044464), cell (GO:0005623), membrane part (GO:0044425), and membrane (GO:0016020) were highly enriched in the CC category (Figure 3). And hemoglobin complex (GO:0005833), microribonucleoprotein complex (GO:0035068), and semaphorin receptor complex (GO:0002116) were the top enriched GO terms among three comparison groups, respectively (Table S3). The significantly enriched GO terms are shown in Table S3.
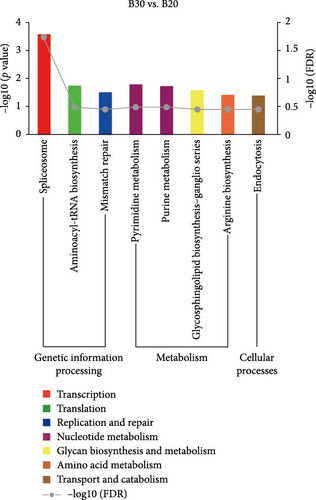
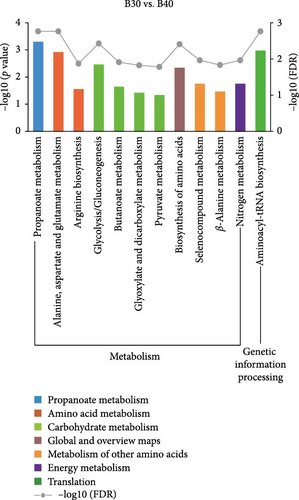
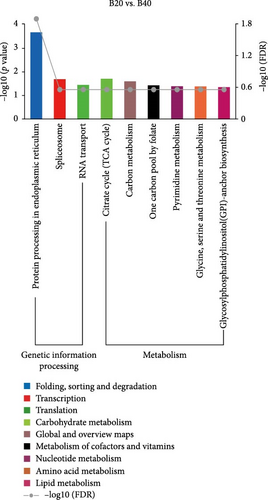
KEGG enrichment analysis showed that the DEGs significantly enriched 8, 12, and 9 pathways in the B30 vs. B20, B30 vs. B40, and B20 vs. B40 groups, respectively. The significantly enriched KEGG pathways are shown in Figure 4 and Table S4. In the B30 vs. B20, DEGs were significantly enriched in metabolism (nucleotide metabolism (pyrimidine metabolism and purine metabolism), glycan biosynthesis and metabolism (glycosphingolipid biosynthesis-ganglio series), and amino acid metabolism (arginine biosynthesis)), genetic information processing (transcription (spliceosome), translation (aminoacyl-tRNA biosynthesis), and replication and repair (mismatch repair)), and cellular processes (transport and catabolism (endocytosis)) pathways (Figure 4A). In the B30 vs. B40, metabolism pathways, such as propanoate, amino acid (alanine, aspartate and glutamate metabolism, and arginine biosynthesis) and carbohydrate metabolism (glycolysis/gluconeogenesis, butanoate metabolism, glyoxylate and dicarboxylate metabolism, and pyruvate metabolism), energy metabolism (nitrogen metabolism), and global and overview maps (biosynthesis of amino acids), as well as translation (aminoacyl-tRNA biosynthesis) were the significantly enriched pathways (Figure 4B). Additionally, DEGs were significantly enriched in metabolism (such as lipid (glycosylphosphatidylinositol (GPI)-anchor biosynthesis), amino acid (glycine, serine, and threonine metabolism), carbohydrate (citrate cycle (TCA cycle)), cofactors and vitamins (one carbon pool by folate), and nucleotide metabolism (pyrimidine metabolism), and genetic information processing (folding, sorting, and degradation (protein processing in endoplasmic reticulum), transcription (spliceosome), and translation (RNA transport)) pathways in the B20 vs. B40 (Figure 4C).
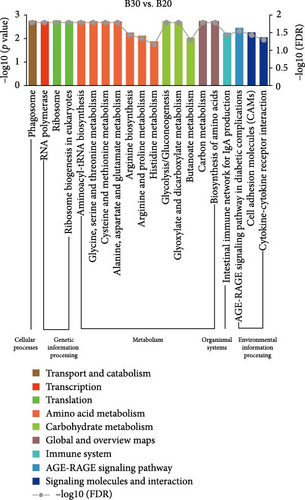
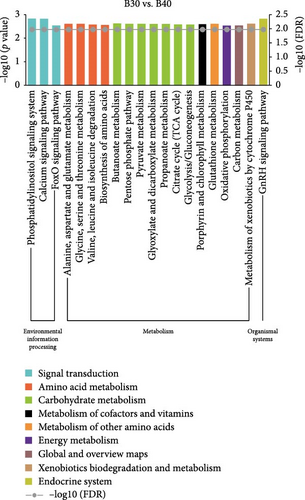
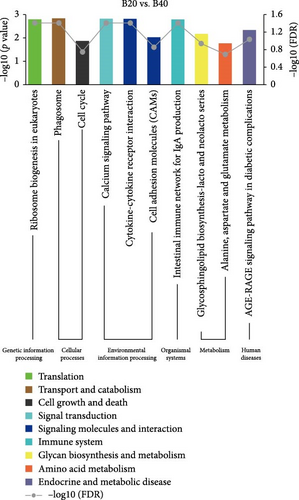
In the GSEA analysis of KEGG enrichment, the significantly enriched KEGG pathways of the three groups are shown in Figure 5 and Table S5. In the B30 vs. B20, metabolism pathways, including amino acid (aminoacyl-tRNA biosynthesis, glycine, serine and threonine metabolism, cysteine and methionine metabolism, and alanine, aspartate and glutamate metabolism, etc.), carbohydrate metabolism (glycolysis/gluconeogenesis, glyoxylate, dicarboxylate metabolism, etc.), and global and overview maps (carbon metabolism and biosynthesis of amino acids), transcription (RNA polymerase), translation (ribosome and ribosome biogenesis in eukaryotes), transport and catabolism (phagosome), signaling molecules and interaction (cytokine–cytokine receptor interaction and cell adhesion molecules (CAMs)), and immune system (intestinal immune network for IgA production) were the significantly enriched pathways (Figure 5A). The B30 vs. B40 group has abundant amino acid (alanine, aspartate, and glutamate metabolism, glycine, serine, and threonine metabolism, and valine, leucine, isoleucine degradation, etc.) and carbohydrate (butanoate metabolism, pentose phosphate pathway, pyruvate metabolism, etc.) metabolism pathways and signal transduction (phosphatidylinositol signaling system, calcium signaling pathway, and foxO signaling pathway; Figure 5B). Finally, processes related to transport and catabolism (Phagosome), signal transduction (calcium signaling pathway), and signaling molecules and interaction (cytokine–cytokine receptor interaction), translation (ribosome biogenesis in eukaryotes), immune system (intestinal immune network for IgA production), and endocrine and metabolic disease (AGE-RAGE signaling pathway in diabetic complications) are highly enriched in B20 vs. B40 (Figure 5C).
Based on the results of KEGG pathway analysis, GSEA analysis of KEGG enrichment, manual gene annotation on NCBI, and a manual literature search on the regulatory effects of hypo- and hypersalinity stress on the fish brain, gene function annotation resources revealed several candidate DEGs potentially associated with salinity adaptation. These DEGs are involved in amino acid metabolism and transport (glutamic–pyruvic transaminase (gpt), arginase 2 (arg2), betaine homocysteine S-methyltransferase 1-like (LOC111237759), solute carrier family 3 member 2(slc3a2), and solute carrier family 7 member 5(slc7a5)), carbohydrate metabolism (fructose-1,6-biphosphate aldolase B (aldob), lactate dehydrogenase Ba (ldhba), and glyceraldehyde-3-phosphate dehydrogenase (gapdh)), signal transduction, and signaling molecules and interaction (mitogen-activated protein kinase kinase kinase 8 (map3k8), mitogen-activated protein kinase kinase kinase 2 (map3k2), mitogen-activated protein kinase kinase 7(map2k7), and leptin receptor (lepr)) Table S6. The putative functions of these genes will be imputed in the discussion.
3.4. Validation by qRT-PCR
The expression levels of the 18 randomly selected DEGs in the brain were validated by qRT-PCR (Figure 6). The fold changes were highly consistent with the RNA-Seq results for the 18 DEGs under hypo- (20 ppt) and hyper-salinity (40 ppt), indicating the accuracy of the RNA-Seq analysis.
4. Discussion
Salinity is an important aquatic environmental factor that can directly affect the growth rate, development, nutrition, cellular physiology, and immune response of aquatic species [9, 47, 48]. Fish undergo various physiological changes during salinity changes to maintain their body homeostasis. RNA-Seq analysis is recognized as a reliable method for evaluating transcriptional responses to various experimental conditions, especially in nonmodel organisms without reference genomes. In this study, 95.27, 103.87, and 90.23 million clean reads were obtained for three salinity gradients of 20, 30, and 40 ppt, respectively. The Q20, Q30, and GC content values exceeded 98%, 95% and 50%, respectively, which proves the reliability of the raw data. Furthermore, the fold changes of the 18 DEGs among the three salinity comparison groups demonstrated a high degree of consistency between RNA-seq and qRT-PCR results. In conclusion, the sequencing outcomes of this study are both accurate and reliable, making them suitable for further analysis.
In the present study, 272, 21, and 343 DEGs were identified in the B30 vs. B20, B30 vs. B40 and B20 vs. B40 groups, respectively. The GO analysis results indicated that cellular process (GO:0009987), binding (GO: 0005488), and cell (GO:0005623) were the dominant groups in the BPs, MF, and CCs, respectively. These results were consistent with researches in aquatic animals such as the Pacific white shrimp (Litopenaeus vannamei) [49], Siberian sturgeon (Acipenser baeri) [20], and hybrid tilapia (Oreochromis mossambicus female×O. urolepis hornorum male) [24]. KEGG pathway and GSEA analysis can enhance our understanding of how salinity fluctuations affect the osmoregulation in greater amberjack. The results demonstrated that amino acid and carbohydrate metabolism were significantly enriched in the B30 vs B20, B30 vs B40, and B20 vs B40 groups, which playing pivotal roles during salinity acclimation as energy sources and as important osmolytes for cell volume regulation [27, 50–52]. Interestingly, the cytokine receptor interactions and mitogen-activated protein kinase (MAPK) signaling pathways involved in signal transduction were found to be enriched. The cytokine–cytokine receptor interaction pathway is crucial for inflammation in animals [53]. And MAPK signaling has been reported to be associated with the immune response of fish when challenged with chemical stressors, including salinity [54]. Therefore, the DEGs related to amino acid metabolism and transport, carbohydrate metabolism, and signal transduction, along with their potential functions in response to salinity, are discussed below.
4.1. DEGs Involved in Amino Acid Metabolism and Transport
This study identified DEGs associated with amino acid metabolism, including gpt, arg2, and LOC111237759, which are involved in the regulation of free amino acid synthesis. Previous studies have demonstrated that amino acids function not only as energetic substrates but also as plasma and cellular osmolytes during osmotic acclimation [55, 56]. In aquatic insect larvae, free amino acids such as arginine and proline act as regulators for osmoregulation [57]. Alanine aminotransferase (ALT/GPT) catalyzes the transamination between L-alanine (L-Ala) and 2-oxoglutarate (2-OG) forms pyruvate and L-glutamate (L-Glu), playing a significant mediatory role in the synthesis of nonessential amino acids and protein catabolism [58]. In certain teleosts, such as golden pompano (Trachinotus ovatus) and salmon (Oncorhynchus keta), serum or tissue ALT activities exhibit significant changes under low salinity stress [59–63]. Furthermore, alt1 mRNA levels in the abdominal muscle of shrimp (Penaeus japonicus) and gpt mRNA levels in the liver of blue tilapia (Oreochromis aureus) and greater amberjack were both significantly up-regulated during hypersalinity stress [28, 64]. However, a notable decrease in expression was observed in the brain of greater amberjack, suggesting that alterations in alt/gpt mRNA expression levels and serum ALT activities maybe responses to environmental stressors. Arg2 is highly expressed in the brain and liver and is believed to play a major role in stimulating the production of ornithine. Ornithine serves as a precursor for the synthesis of glutamate, polyamines, and proline, which are essential components of cell growth and proliferation, and protein synthesis [65, 66]. In greater amberjack, arg2 mRNA was significantly induced under hypo-salinity stress, consistent with liver research findings [33], suggesting that the increased arg2 levels under hypo-salinity stress may stimulate the synthesis of ornithine, thereby, promoting the production of osmoregulatory amino acids (proline and glutamate). Betaine homocysteine methyltransferase (BHMT) is primarily for catalyzing the breakdown of betaine in organisms. Betaine possesses the properties of an amphoteric bipolar ion, which enhances the tolerance of body cells to unfavorable environments and effectively regulates osmotic pressure and ionic balance within tissues [67]. In aquatic animals, including ayu (Plecoglossus altivelis), sea bass (Lateolabrax japonicus), and sea cucumber (Apostichopus japonicus), the expression of BHMT protein and mRNA in gills, kidneys, liver, and intestines has been shown to vary significantly [67–69]. In the present study, LOC111237759 was found to be significantly up-regulated under hypo-salinity stress in greater amberjack, indicating its potential role in salinity stress response and osmotic pressure regulation.
In addition, the DEGs related to amino acid transport (slc3a2 and slc7a5) were significantly changed under salinity stress. Amino acids belong to macromolecular substances and must be transported by amino acid transporters on the cell membrane to enter the cell. Heteromeric amino acid transporters (HATs) are transporters of various essential amino acids, which are significant for the uptake of amino acids and maintenance of stability of intracellular amino acid concentrations [70]. SLC3A2 is a member of the transmembrane glycoprotein of the SLC3 family type Ⅱ and a component of HATs. SLC3A2 has a dual function in regulating amino acid transport and integrins of downstream signaling pathways [71]. Besides, the binding of SLC3A2 and SLC7A5 (L-type amino acid transport 1, LAT1; SLC3A2/LAT1) mediates the transport of most neutral (such as leucine, isoleucine, and methionine) and aromatic amino acids [70]. In greater amberjack, slc3a2 decreased under hypo-salinity, and slc7a5 increased under hyper-salinity. These results infer that, under salinity stress, the greater amberjack brain may regulate the concentration of intracellular free amino acids by changing the expression of genes related to amino acid metabolism and transport, thereby maintaining the cellular and plasma osmolarity of the fish.
4.2. DEGs Involved in Carbohydrate Metabolism
Carbohydrates are the main sources of energy for all living organisms [72, 73]. Numerous studies indicate that fish consume 10%–50% of their energy for osmotic regulation and adaptation to changes in environmental salinity [74]. Genes involved in Glycolysis/Gluconeogenesis, for example, gapdh, aldob and ldhba, were down-regulated when greater amberjack were exposed to hypo- or hyper-salinity. GAPDH has been recognized as a crucial enzyme in energy metabolism, facilitating the production of ATP, and pyruvate through anaerobic glycolysis in the cytoplasm [75]. The gadph mRNA exhibited significant variation in spotted sea bass (Lateolabrax maculatus) across different salinities (0, 12, 30, and 45 ppt) [76]. In this study, the greater amberjack gapdh mRNA expression was found to be down-regulated under hyper-salinity (40 ppt) stress after 30 days, similar to the results in tiger puffer (Takifugu rubripes) following exposure to hyposalinity (4 ppt) [52]. Fructose 1,6-diphosphate aldolase catalyzes the cleavage of C6 substrates into C3 products, which are subsequently converted into pyruvate. Pyruvate plays a crucial role in the glycolysis/gluconeogenesis and pentose phosphate cycle pathways, contributing to cellular energy production [77, 78]. Research has shown that the aldoaa mRNA expression was down-regulated in tiger puffer during hypo-salinity stress [52]. While aldob mRNA expression was found to be decreased in response to cold stress in pearl gentian grouper (Epinephelus fuscoguttatus♀ × Epinephelus lanceolatus♂) [79], as well as in blunt snout bream (Megalobrama amblycephala) during the antioxidant response to dietary emodin [80]. Additionally, a similar decrease was observed in greater amberjack subjected to hypo-salinity stress for 30 days. These findings suggest that glycolysis/gluconeogenesis and energy production may be influenced in response to the stressors. Furthermore, a bidirectional enzyme LDH has been identified to catalyzes the interconversion of lactate and pyruvate, which plays a role in anaerobic metabolism or gluconeogenesis pathways [81]. In teleosts, the LDHB isoform, which is predominantly expressed in oxygen-riches tissues, can stimulate the synthesis of carbohydrate substances [81, 82]. In SW-acclimated milkfish (Chanos chanos), ldhb mRNA was found to be up-regulated under hypothermic stress, indicating an enhanced gluconeogenic response [81]. In contrast, ldhba mRNA expression in greater amberjack brain was down-regulated under hyper-salinity stress, suggesting that the gluconeogenic response in the brain may be attenuated under hypertonic conditions. Taken together, the energy and carbohydrate substances metabolism in the brain may be changed in response to salinity stress and osmoregulation.
4.3. DEG Involved in Signal Transduction
The adaptation of fish to salinity stress relies on the efficient mechanisms of osmosensing and osmotic stress signaling [83]. These upstream mechanisms processes regulate the expression of effector proteins and coordinate the adaptive response [84]. The MAPK signal transduction, a ubiquitous and highly conserved pathway regulating eukaryotic cell development. Each MAPK cascade comprises three core kinases (MAP3K, MAPKK, and MAPK) that regulate various cellular processes, including development, proliferation, differentiation, survival, apoptosis, and stress response [85–89]. The signal is transmitted through sequential phosphorylation and activation of these kinases, ultimately leading to the phosphorylation of target regulatory proteins by the MAPK and MAPKAPK components [88]. Recent functional studies have investigated MAPKs in teleost, particularly focusing on the functional characterization in different stress responses. In Japanese flounder (Paralichthys olivaceus), RNA-Seq analysis demonstrated that eight mapk genes are involved in regulating resistance to both biotic and abiotic stress, including temperature stress and Edwardsiella tarda infection [90]. Under conditions of salinity and hypoxia, the expression of several mapk factors from the JNK and p38 subfamilies varied in spotted sea bass [91]. Notably, in this study, the upstream MAPK regulatory factor map3k8 exhibited greater sensitivity to hypotonic (20 ppt) challenges compared to isosmotic (30 ppt) challenges. Conversely, the highest levels of map3k2 and map2k7 gene expression were recorded during hyper-salinity (40 ppt) challenges. These findings suggest that salinity stress may indirectly influence the MAPK signaling pathway by modulating the expression of upstream MAPK regulatory factors in the greater amberjack brain, thereby playing a crucial role in osmotic stress signaling.
Leptin is a multifunctional cytokine and hormone found in the hypothalamus that regulates food intake, energy expenditure, fat stores or glucose metabolism, and reproduction [92, 93]. Leptin binds its receptors to activate the 5′-AMP-activated protein kinase (AMPK), Jak/STAT pathway, and MAPK pathway for signaling transduction [92]. Transferring Mozambique tilapia (O. mossambicus) from freshwater (FW, 0–0.5 ppt) to SW (SW, 23 ppt) elevated the liver lepa and lepr mRNA expression level, and plasma glucose, amino acid, and lactate levels. Therefore, lepa mRNA is sensitive to osmotic pressure and may act as a hyperglycemic factor in teleost by inducing hepatic glycogenolysis [94]. In marine fish, the liver lepa mRNA expression in Japanese sea bass was significantly lower in freshwater and semi-SW groups than in SW [95]. Similarly, brain lepr mRNA was decreased under the hypo-salinity stress in greater amberjack. These results suggest that leptin may be involved in the glycolipid metabolism and signal transduction process in marine fish.
Although the aquaculture of Seriola species has sharply increased in recent decades, its production is constrained by the reduced number of hatcheries and grow-out installations [96]. Among culture conditions, water salinity is a critical factor in achieving optimal growth and affecting the aquaculture yield. Deviation from the appropriate salinity range would adversely affect the growth, survival, and reproduction of cultured fish and ultimately reduce their yield [1, 2, 97, 98]. Our transcriptomic analysis provides insights into the molecular pathways activated by the fish’s osmoregulatory organs, the gills and kidneys, as well as the nonosmoregulatory organs, such as the liver and brain, in response to the complex challenges posed by salinity stress [31–33, 99]. These findings provide a detailed transcriptomic profile of adaptation and highlight the important contribution of the transcriptome to fish adaptation to ambient salinity fluctuations. Furthermore, they provide theoretical guidance for the increased commercial aquaculture production of greater amberjack and the conservation of marine fisheries resources against increasing environmental challenges.
5. Conclusions
In conclusion, these results emphasize the response of fish brains to long-term environmental salinity using high-throughput sequencing technology. In this study, 272, 21, and 343 DEGs were obtained in the B30 vs. B20 (hypo-salinity), B30 vs. B40 (hyper-salinity), and B20 vs. B40 groups, respectively. These genes involved in salinity regulation were enriched in several BPs, including amino acid metabolism and transport, carbohydrate metabolism, and signal transduction. The increased mRNA expression of gpt, arg2, and LOC111237759 in the brain under hypo-salinity stress could stimulate the synthesis of free amino acids, thereby regulating cell volume and maintaining osmotic balance. Moreover, the expression of aldob, ldhba, and gapdh mRNA was down-regulated, indicating that the energy and carbohydrates requirements in the brain response to salinity stress and osmoregulation may be varied. This study reveals the possible molecular mechanism of osmotic regulation in the brain response to salinity stress.
Conflicts of Interest
The authors declare no conflicts of interest.
Author Contributions
Xiaoying Ru: writing the first draft, data curation. Xiaoying Ru, Yang Huang, and Tong Zhou: investigation, validation, formal analysis. Hongjuan Shi: writing–review and editing. Yang Huang and Chunhua Zhu: resources. Tonglin Yang, Peipei Chen, and Jiahui Yang: visualization, supervision. Hongjuan Shi and Chunhua Zhu: conceptualization, methodology. Chunhua Zhu and Yang Huang: funding acquisition, project administration. Xiaoying Ru and Yang Huang contributed equally and should be considered as co-first authors.
Funding
This research was financed by the Fund of Guangdong Ocean University (030301022301), Southern Marine Science and Engineering Guangdong Laboratory (Zhanjiang) (ZJW-2023010), The Major Science and Technology plan of Hainan Province (ZDKJ2021011), Guangdong Ocean University College Students Innovation and Entrepreneurship Training Program (CXXL2022001), The Project For Science and Technology of Zhanjiang (2024R1010), Research on Breeding Technology of Candidate Species for Guangdong Modern Marine Ranching (2024-MRB-00-001), and Guangdong Province “Yangfan Plan”—2024 Modern Marine Ranching Industry Talent Revitalisation Plan (HYJ-YFJH-2024001).
Acknowledgments
We would like to thank MogoEdit (https://www.mogoedit.com/) and citexs (https://www.citexs.com/) for the linguistic assistance during the preparation of this manuscript.
Supporting Information
Additional supporting information can be found online in the Supporting Information section.
Open Research
Data Availability Statement
The data that support the findings of this study are available upon reasonable request.


