Expression Patterns of miRNA in the Experimental Autoimmune Encephalomyelitis (EAE)/MS Model Treated With Oenothera biennis Oil
Abstract
Background: Dysregulation of microRNA expression emerges as a crucial factor in the pathogenesis of autoimmune diseases, and their importance in modulating immune responses and disease progression is evident.
Methods: This study investigated the expression patterns of miRNAs in the brain tissues of C57BL/6J mice using the experimental autoimmune encephalomyelitis (EAE) model, which mimics multiple sclerosis (MS). The model was treated with Oenothera biennis oil, a potential therapeutic agent.
Results: Our research has revealed a novel and significant likelihood of association between miR-182-5p, miR-200c-3p, miR-206-3p, miR-429-3p, miR-1298-5p, and diseases resembling the EAE model, such as MS. This groundbreaking discovery could have profound implications in diagnosing and treating autoimmune diseases that mimic the EAE animal model.
Conclusions: These miRNAs, identified in our study, might serve as potential therapeutic targets in MS, potentially leading to more effective treatments and improved patient outcomes.
1. Introduction
Multiple sclerosis (MS) is a multifaceted condition that appears at the intersection of the nervous and immune systems. Peripheral immune cells penetrate the central nervous system (CNS), triggering inflammation and the formation of focal demyelinating lesions [1]. Focal demyelination is associated with relapsing-remitting MS, whereas progressive forms of the disease are characterized by axonal degeneration and neuronal death [2, 3]. While drug treatments can aid in slowing disease progression or mitigating disability in patients, they often entail significant side effects and do not reverse the symptoms of MS [4, 5].
Recently, there has been growing interest in the impact of small, noncoding RNA molecules known as microRNAs (miRNAs) on the CNS. The precise role of miRNAs in brain functions remains largely unexplored. However, some findings indicate that miRNAs are expressed at high levels and exhibit specific expression patterns, suggesting their importance in the CNS. Studies indicate that miR-367-3p inhibits microglial ferroptosis in an in vivo MS model; on the other hand, miR-18a-5p, Let-7g-5p, miR-374a-5p, and miR-145-5p have both pro- and anti-inflammatory effects, while miR-342-3p and miR-150-5p are anti-inflammatory in relapsing-remitting MS patients [6, 7]. Evidence suggests a potential role for miRNAs in various stages of human CNS development and function. These roles include neuronal patterning, specification, and axonal pathfinding, as well as the physiological functions of mature neurons. Studies supporting these claims highlight the spatiotemporally specialized expression of miRNAs [8].
miRNAs are tiny noncoding RNA molecules, which, by binding to specific messenger RNA (mRNA) sequences, regulate gene expression at the posttranscriptional level [9]. A study with a large serum cohort found that miR-320b and miR-25-3p are early biomarkers associated with MS severity and brain atrophy [10]. An investigation revealed that higher levels of miR-142-3p in the cerebrospinal fluid (CSF) of MS patients treated with dimethyl fumarate were associated with increased disease activity, IL-1β signaling, and neuronal excitability [11]. On the other hand, numerous miRNAs have been suggested as therapeutic targets in MS such as miR-125a, miR-146b, miR-200c, miR-328, miR-199a, miR-152, miR-633, and miR-922 [12]; however, the connection between their early expression levels following disease onset and long-term outcomes has yet to be investigated [13, 14].
While mechanisms for repairing damage in the CNS exist, they are disrupted in the context of MS, and currently, no treatments are available to address this deficit. Over the past few decades, there has been a noticeable uptick in the utilization of complementary and alternative medicine (CAM) by individuals with MS, with herbal remedies being a popular choice [15].
Medicinal plants exhibit various therapeutic effects across various diseases [16]. Research has indicated that specific herbal compounds possess the ability to enhance myelin repair and reduce inflammation [17–19]. Evening primrose oil, sourced from the seeds of Oenothera biennis (O. biennis), has garnered interest for its potential therapeutic benefits in numerous inflammatory conditions [20, 21]. Evening primrose oil is rich in essential fatty acids (EFAs), particularly linoleic acid (LA) and gamma-linolenic acid (GLA). GLA can modulate immune responses. In addition to EFAs, it contains various bioactive compounds, including flavonoids and phenolics, which are known for their antioxidant and anti-inflammatory properties. Previous studies have identified several polyphenols and flavonoids in evening primrose oil, such as gallic acid, caffeic acid, epicatechin, coumaric acid, ferulic acid, rutin, and rosmarinic acid. Furthermore, other research has reported that (+)-catechin, (−)-epicatechin, and gallic acid are the primary phenolic compounds found in O. biennis, along with one isoflavone and 2-hydroxychalcone [20] O. biennis exhibits therapeutic effects in various diseases, including atopic dermatitis, rheumatoid arthritis, diabetic neuropathy, MS, premenstrual syndrome, schizophrenia, and breast cancer [22–24].
While the exact cause of MS remains unclear, animal models, particularly the experimental autoimmune encephalomyelitis (EAE) model, can replicate numerous clinical, neuropathological, and immunological features observed in MS [25, 26]. The molecular mechanisms underlying MS have been elucidated by establishing an EAE model in mice [24, 26, 27]. In our prior investigation, we demonstrated through biochemical and histological evidence that administering O. biennis to C57BL/6J mice with MS induced by the EAE method aided in the healing process [28]. Our aim in this study is to fully understand the underlying mechanism via alterations in the expression levels of miRNA following the therapeutic administration of O. biennis in an animal model of MS induced by the EAE method.
2. Materials and Methods
2.1. EAE Induction and Treatment Protocol
The experimental approval was received from the Animal Ethics Committee at Bezmialem University (Approval Number: 2015/53). Ten-week-old female C57BL/6J mice (n = 40) were procured from Bogazici University Animal Laboratory in Istanbul, Turkey. These mice were accommodated in Bezmialem University’s facilities, where they experienced regulated lighting conditions, following a 12-h-light-12-h-dark cycle, and were maintained at a temperature of 22°C. Throughout the study, they had unrestricted access to both food and water. In the experiment, animals were divided into three groups: control group:healthy mice (no PTX applied; n = 10), MS group: sham (only PTX applied; n = 15), and MS + OB group: treatment group (PTX applied + O. biennis applied; n = 15). To induce MS, we utilized a model described previously [28]. In summary, MS induction involved subcutaneous immunization with 200 μg of MOG35–55 peptides (Hooke Kit MOG35-55/complete Freund’s adjuvant (CFA) Emulsion PTX; Hooke Lab. Inc., Lawrence, MA) in a 200-μL emulsion comprised of equal parts of MOG and CFA, supplemented with 10 mg/mL heat-killed Mycobacterium tuberculosis (H37Ra; Difco Adjuvant H37Ra, Fisher Scientific Ltd., Loughborough, UK).
On Day 1, mice received an intraperitoneal injection of 500 ng pertussis toxin (Hooke Kit MOG35-55/CFA Emulsion PTX; Hooke Lab. Inc.). Disease progression was assessed daily after 2 weeks using a scoring system described by Bebo Jr. et al. [29], where scores ranged from 0 (no signs) to 6 (death during the 6-week experimental period), with intermediate scores indicating varying degrees of limb weakness or paralysis. We presented this data in our previous study [28]. Following 2 weeks postimmunization, treatments involving plant oil were administered. The treatment group’s diet was enriched with O. biennis extract (Premium Organics Ltd., Turkey). Mice in the MS + OB group were provided with feed containing 18−21 g/kg O. biennis extract, while those in the control and MS groups were given standard feed throughout the 6 weeks [24]. Upon completion of the study, brain samples were collected from all mice under general anesthesia induced by 35 mg/kg ketamine and 80 mg/kg xylazine. These tissue samples were stored at −80°C until further analysis.
2.2. Brain Tissue Homogenization and RNA Isolation
The pathogenesis of MS-related cognitive dysfunction is complex and specific roles are also played by focal cortical lesions [30], diffuse cortical atrophy [31], and atrophy of strategic cortical and subcortical gray matter structures, such as the hippocampus [32], the thalamus [33], and the cerebellum [34]. For this reason, whole brain tissue samples [35, 36] were homogenized at a speed of 30 m/s for 5 min using a homogenization device (MP Biomedical Fast Prep 24, South Korea), employing a lysis buffer. Total RNA was subsequently isolated using the RNA easy mini kit (Qiagen, Germany), following the manufacturer’s protocol. The quality and quantity of RNA were assessed using a NanoDrop2000 spectrophotometer (Thermo Scientific, United States). Additionally, RNA integrity was evaluated through gel electrophoresis and the Spot Check Nucleic Acid Quantitation Kit (Sigma-Aldrich, St. Louis, MO).
2.3. miRNA Array and Data Analysis
To analyze the miRNA expression patterns, we utilized an Affymetrix GeneChip miRNA array v.3.0 (902018) (Affymetrix, Santa Clara, CA, United States). This array comprehensively covers miRBase Version 17, encompassing 19.931 mature miRNA probe sets across various organisms. Additionally, it includes 2.999 probe sets specific to human, mouse, and rat pre-miRNA hairpin sequences. For the experiment, RNA samples from the three groups (MS + OB, MS, and C) were combined, with each pool containing 100 ng of RNA. The total RNA was then labeled with biotin using the 3DNA Array Detection FlashTag Biotin HSR kit (Genisphere, Hatfield, PA, United States) following the manufacturer’s instructions and subsequently subjected to overnight hybridization.
Using the Affymetrix GeneChip miRNA array, samples underwent hybridization on the array chip and were incubated in an oven at 48°C for 16–18 h (GeneChip Hybridization Oven 645). Posthybridization processes, including washing, staining (GeneChip Fluidics Station 450), and chip scanning, were conducted per the manufacturer’s instructions (Affymetrix, United States). The hybridized chips were scanned using an Affymetrix GCS 3000 7G scanner. Raw data underwent background correction using the Robust Multi-Array Mean (RMA) algorithm. The preprocessed data was analyzed using the Expression Console (Affymetrix, Santa Clara, CA, United States) and other software (Affymetrix Expression Console Build 1.3.1.187 and Affymetrix Transcriptome Analysis Console v3.0). The miRNA biweight mean (log2) density was compared to control miRNA deregulation in other groups. miRNA differential expression was considered significant if p < 0.05 in pairwise group comparisons. Among the miRNAs, those showing statistically significant changes of ≥ twofold increase or decrease were identified as candidate miRNAs.
2.4. Validation of miRNAs by Quantitative Real-Time Reverse Transcription Polymerase Chain Reaction (RT-qPCR)
Candidate miRNAs identified from microarray expression profiles were validated using RT-qPCR. Initially, cDNAs were synthesized from miRNA samples using the Quanto qScript miRNA cDNA synthesis kit (QuantoBio Co., United States) through a single-stage poly-A insertion and reverse transcription reaction. The miRNA expression profiles were then analyzed using sequence-specific primers in conjunction with the Biorad iTaq Universal SYBR Green Supermix (Bio-Rad Co., United States) and Quanta Perfecta universal PCR Primer (QuantoBio Co., United States) on an ABI PRISM 7900HT real-time PCR device (Applied Biosystems, Foster City, CA, United States). Each sample’s reaction mixture was prepared in duplicate, and the amplification profile consisted of initial denaturation at 95°C for 30 s, followed by 40 cycles of 95°C for 15 s, 60°C for 30 s, and 70°C for 30 s. The specific miRNA expression levels were normalized using U6, an endogenous control miRNA with consistent expression, and were quantified as 2∧−ΔΔct values [37].
2.5. Statistical Analysis
RT-qPCR miRNA levels were evaluated using GraphPad Prism 8.0.1 software (San Diego, CA). The Shapiro–Wilk test was used to determine the normality of the data. Comparisons between groups were performed using the nonparametric Mann–Whitney U test, as the number of observations was unsuitable for assessing the normal distribution. p < 0.05 was considered statistically significant, with mean ± SD. miR-1298-5p, miR-182-5p, miR-200c-3p, miR-206-3p, and miR-429-3p were analyzed using Kruskal–Wallis, followed by a post hoc Dunn test.
3. Results
3.1. Alterations in miRNA Expression
Microarray analyses were conducted to explore the comprehensive miRNA profiles across the treatment, MS, and control cohorts. A heat map visually depicted the differential expression of miRNAs, with downregulation represented by red and upregulation by green. In the MS vs. control group comparison, 66 out of 327 miRNAs were found to be downregulated (Figure 1a). In contrast, in the MS + OB vs. MS group comparison, 42 out of 162 miRNAs were upregulated (Figure 1b). The heat maps of five miRNAs and scatterplots (Figure 1c,d) were also included to illustrate these findings. A supporting dataset containing all differentially expressed miRNAs is provided (File S1).
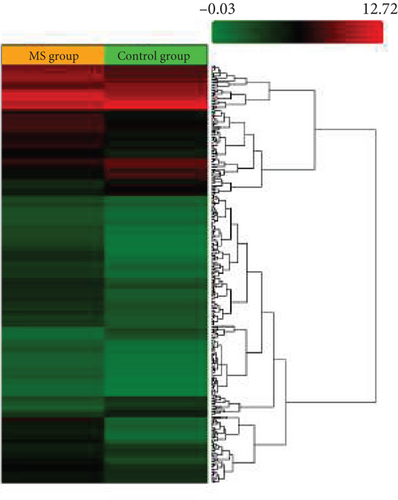
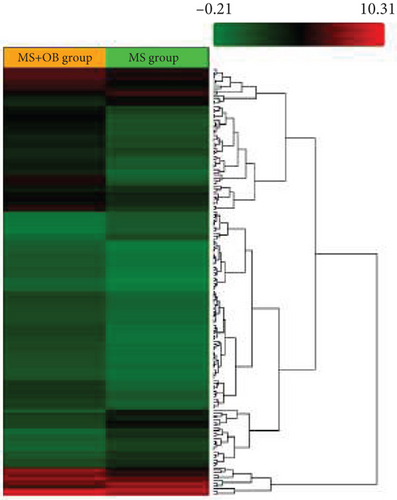
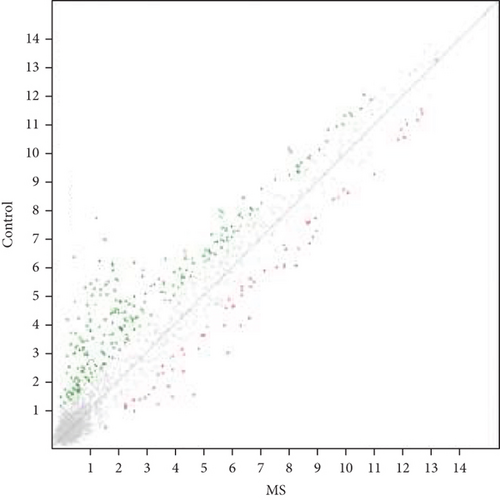
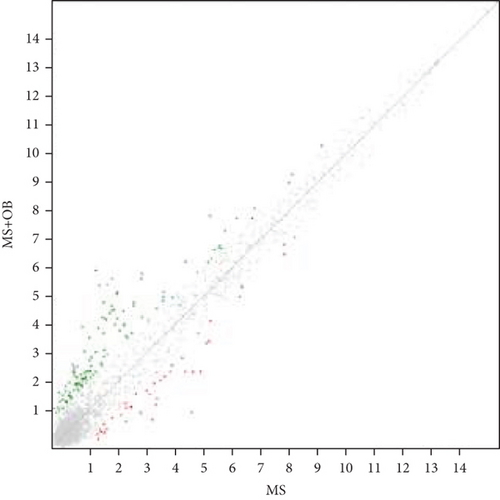
Comparative analysis identified miRNAs exhibiting consistent expression patterns across all experimental groups. Five miRNAs associated with MS and neurological pathways were identified, and their expression in brain samples was validated via RT-qPCR (Table 1). Following validation, fold change ratios were computed, revealing that the alterations observed in MS were generally reversed in the treatment groups, except for miR-200c-3p (Table 2). The expression patterns of these miRNAs across groups are depicted in Figure 2. The expression of miR-1298-5p was downregulated in the MS group (Figure 1c and Table 2). At the same time, it was upregulated approximately three times higher in the MS + OB group (Table 2). In the MS group, the expression of miR-182-5p was downregulated, whereas its expression was upregulated in the MS + OB group (Figure 1c and Table 2). The expression of miR-200c-3p was downregulated in both the MS and MS + OB groups (Figure 1c and Table 2). The expression of miR-206-3p was upregulated in the MS group, while it was downregulated approximately four times in the MS + OB group (Table 2). In addition, the expression of miR-429-3p was downregulated in the MS group, while it was upregulated approximately three times higher in the MS + OB group (Table 2).
| MS mean (SD) | C mean (SD) | MS + OB mean (SD) | |
|---|---|---|---|
| miR-1298-5p | 5.90 ± 0.36∗ | 4.30 ± 0.75 | 4.20 ± 1.28++ |
| miR-182-5p | 13.03 ± 1.23∗∗ | 10.49 ± 2.50 | 9.92 ± 1.80++ |
| miR-200c-3p | 8.77 ± 0.88∗ | 9.54 ± 1.83 | 9.62 ± 2.84+ |
| miR-206-3p | 8.21 ± 1.50∗∗ | 10.15 ± 3.19 | 12.81 ± 4.96∗+++ |
| miR-429-3p | 14.36 ± 0.81∗ | 11.19 ± 2.46 | 10.05 ± 3.21+++ |
- Note: Data is presented as mean ± standard deviation (SD). The Shapiro–Wilk test was used to test the normality of the data.
- Abbreviations: MS: multiple sclerosis; OB: Oenothera biennis oil treatment.
- ∗p < 0.05 and ∗∗p < 0.01: statistically significant compared to the control group. +p < 0.05, ++p < 0.01, and +++p < 0.001: statistically significant compared to the MS group.
| MS vs. C | MS + OB vs. MS | |||
|---|---|---|---|---|
| Fold change | Regulation | Fold change | Regulation | |
| miR-1298-5p | 5.9 | Downregulated | 19.9 | Upregulated |
| miR-182-5p | 5.2 | Downregulated | 8.6 | Upregulated |
| miR-200c-3p | 1.3 | Downregulated | 1.8 | Downregulated |
| miR-206-3p | 2.9 | Upregulated | 12 | Downregulated |
| miR-429-3p | 5.9 | Downregulated | 19.9 | Upregulated |
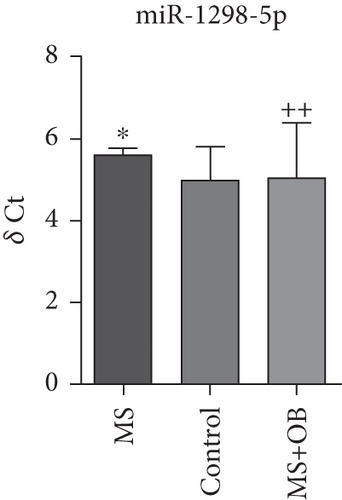
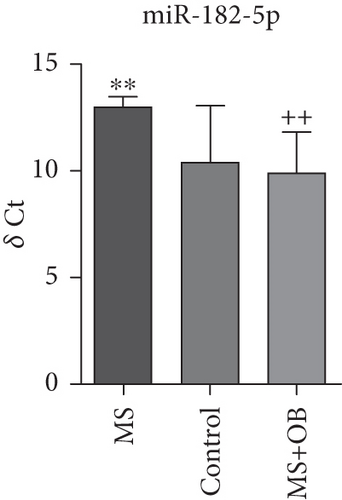
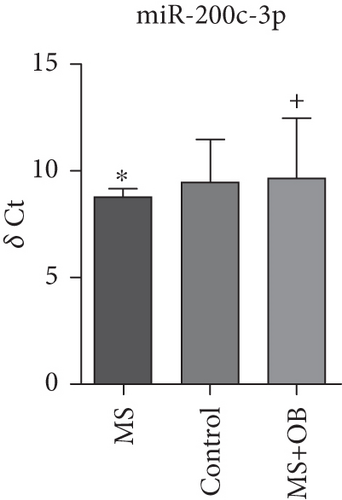
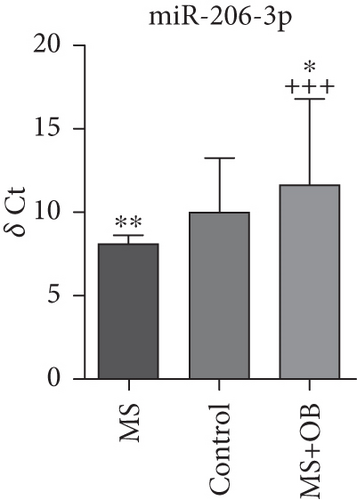
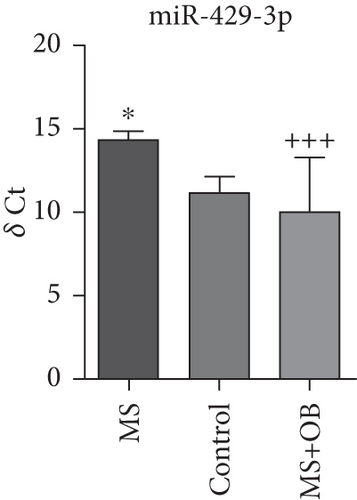
The expression of miR-1298-5p was significantly increased (p < 0.05) in the MS group compared to the control group. At the same time, it was significantly decreased (p < 0.01) in the MS + OB group compared to the MS group, similar to the control (Figure 2a). The expression of miR-182-5p was significantly increased (p < 0.01) in the MS group compared to the control. Furthermore, its expression was significantly decreased (p < 0.01) in the MS + OB group compared to the MS group (Figure 2b). The expression of miR-200c-3p was significantly decreased (p < 0.05) in the MS group compared to the control group, but it was increased (p < 0.05) in the MS + OB group compared to the MS group (Figure 2c). The expression of miR-206-3p was highly decreased (p < 0.01) in the MS group than in the control. Additionally, the expression of miR-206-3p was significantly increased (p < 0.05 and p < 0.001, respectively) in the MS + OB group compared to both the control and MS groups (Figure 2d). The expression of miR-429-3p was also significantly increased in the MS group than in the control and MS + OB groups (p < 0.05 and p < 0.001, respectively) (Figure 2e).
4. Discussion
MS is a chronic inflammatory disease that affects the CNS. It is characterized by autoimmune mechanisms leading to inflammation, axonal damage, demyelination, and hyperplasia of glial cells. The pathogenesis of MS involves various pathological processes, among which are the alterations in immune cells. These changes arise from activated peripheral immune inflammatory responses and dysfunction of the blood–brain barrier (BBB), as well as abnormal activity of glial cells such as microglia, oligodendrocytes, and astrocytes. The dysfunction of these cells within CNS lesions is closely linked to the dysregulation of miRNA expression. Notably, the transcription of miRNA varies across different subsets of immune cells [12, 38].
Multiple in vivo models are used to investigate MS pathophysiology, categorized into toxin-induced, virus-induced, and EAE models, each with distinct advantages [39, 40]. EAE is the most widely used model, as it closely mimics the clinical, histopathological, and immunological features of MS [39]. It can be induced actively via myelin antigen immunization or passively by transferring encephalitogenic T cells [41, 42]. While passive EAE progresses rapidly and is more uniform, its variability depends on the encephalitogenic potential of transferred T cells [43]. In this study, the authors investigated the expression of miRNAs in brain samples using an animal model of EAE treated with O. biennis oil. Five candidate miRNAs believed to be associated with MS, identified from microarray data, were validated through RT-qPCR. The study proposes that the validated miR-182-5p, miR-200c-3p, miR-206-3p, miR-429-3p, and miR-1298-5p identified in the research may be involved in the MS mechanisms.
miR-429-3p belongs to the micro-200 family, which is considered significant in the context of neurodegenerative diseases [44]. In diseases such as MS and prion diseases, members of the miR-200 family participate in a range of cellular processes, including the regulation of DNA repair, cell apoptosis, alpha-synuclein aggregation, FUS protein production, and the differentiation of Th17 cells [45]. A study examining the miRNA profile during ischemic preconditioning (IPC) discovered that miR-429-3p might exert a neuroprotective function in vitro during ischemia [46]. Conversely, studies employing an MS model have detected miR-429-3p in the spinal cord and urine samples [47]. However, there is currently no available data regarding its expression, specifically in brain samples.
Studies suggest that miR-429-3p may play a pivotal role in regulating immune responses and inflammatory processes in MS. The varying levels of this miRNA in MS patients and experimental models, and its potential to promote the activation of certain inflammatory cells (e.g., Th17 cells), make it a fascinating subject of study [48].
In our study, the upregulation of miRNA associated with MS pathogenesis in the opposite direction of the disease following treatment was achieved with O. biennis. The significant upregulation of miR-429-3p by 19.9 times in the treatment group (Table 2). The potential of miR-429-3p in MS treatment arises from the various pathways and molecules it can target [49].
It is conceivable that this miRNA may alter the course of MS by modulating inflammatory processes or by affecting the activation of glial cells (e.g., microglia and astrocytes). The development of molecules used as inhibitors of miR-429-3p may both reduce inflammation and provide neuroprotective effects.
In a recent studies, differential expression of specific miRNAs, including miR-1298-5p, was detected in the hippocampus of patients with intractable mesial temporal lobe epilepsy (mTLE) and hippocampal sclerosis. Additionally, this research proposed that miR-1298-5p is implicated in processes such as neurotrophin signaling, axonal guidance, regulation of potassium channel expression, and GABA action [50]. On the other hand, a study comparing global miRNA expression between senescence-accelerated mouse-prone 8 (SAMP8) control mice and SAMP8 mice treated with G9a inhibitor UNC0642 revealed a downregulation of miR-1298-5p following G9a inhibition treatment. The results demonstrated a decrease in miR-1298-5p expression in SAMP8 mice, which was reversed after G9a inhibitor treatment, indicating a reduction in DNA methylation levels. This allowed for the upregulation of miR-1298-5p and subsequently modified the gene transcription of various essential neuroprotective genes [51]. miR-1298-5p’s anatomical expression in diseases and its neuroprotective effects resulting from specific medications have been demonstrated in some studies; however, there is no direct research linking it to MS. Nonetheless, its regulatory response to treatment holds promising potential as an avenue for further exploration. The observed upregulation of miRNA associated with MS pathogenesis in the opposite direction of the disease following treatment was noted with O. biennis. The substantial increase in miR-1298-5p expression by 19.9 times in the treatment group in this study enhances the potential for this miRNA to serve as a therapeutic agent in MS (Table 2).
Valsecchi et al. [52] noted that miRNA-206-3p exhibits upregulation in the brain stem of a mouse model with spinal muscular atrophy (SMA) during the early phase of the disease. Research employing an Alzheimer’s disease model revealed an increase in miRNA-206-3p expression within the brain [53, 54]. Meanwhile, another study identified that miR-206 exerts a retrograde regulatory function at the neuromuscular junction [55]. In this study, upregulation of miRNA-206-3p by 2.9-fold in the control group and downregulation of miRNA-206-3p by 12-fold in the treatment group was observed; this strengthens the likelihood of it being considered as a candidate miRNA (Table 2). The levels of this miRNA may be affected in relation to the activation of inflammatory cells and the functions of glial cells in MS [56].
The ability of miRNA-206-3p to protect the health of oligodendrocytes and neurons in particular suggests that this miRNA may play an important role in the demyelination processes of MS. Furthermore, the use of its inhibitors may reduce inflammatory processes and provide neuroprotective effects.
In recent decades, mounting evidence has suggested that members of the miR-200 family, which includes miR-200c-3p, might play a regulatory role in the proliferation, differentiation, and apoptosis of neurons [57, 58]. Hence, disrupted expression of the miR-200 family could significantly disturb neuronal homeostasis, potentially contributing to the onset and progression of the disease. Also in another study, miR-200c-3p has been found to be involved in the pathogenesis of many neurodegenerative disorders including Alzhemer’s [59]. It also can modulate the expression of inflammation-related genes, suggesting that it may play an important role in the pathogenesis of MS. In addition, miR-200c-3p has been suggested to have an effect on cell migration and proliferation, thus playing a role in the control of oligodendrocyte recovery and demyelination processes [48, 60].
In this study, a downregulation of miRNA-200c-3p by 1.3-fold was observed in the control group, while a downregulation of 1.8-fold was observed in the treatment group (Table 2). The findings of this study enhance the potential for this miRNA to serve as a candidate.
miR-182-5p, part of the miR-183 family situated on chromosome 7q31-34, is characterized as an oncogenic miRNA because it promotes both the proliferation and survival of cancer cells [61]. While the functions of miR-182-5p are extensively documented in cancer, its role in the CNS remains largely unexplored, particularly under both normal and pathophysiological circumstances. One research finding suggests that miR-182-5p plays a role in protecting the brain during episodes of cerebral ischemia–reperfusion injury [62]. O. biennis achieved the upregulation of miRNA associated with MS pathogenesis in the opposite direction of the disease following treatment. The upregulation of miR-182-5p expression by 8.6-fold in the treatment group in this study increases the likelihood of this miRNA being considered a potential candidate (Table 2).
Additionally, miRNAs have a large number of target genes that regulate gene expression. This may cause a miRNA to have unexpected effects on objectively targeted pathways. For example, although these miRNAs we identified in the study are thought to have positive effects on inflammatory and neuroprotective pathways, they may also trigger some cancer processes or cause side effects. This complexity can make predictability regarding clinical treatment difficult. Therefore, further research on these miRNAs is important to overcome these limitations and develop new therapeutic strategies.
5. Conclusion
In this study, we investigated the impact of O. biennis oil on miRNA expression profiles using an animal model of EAE. Our previous research had demonstrated its beneficial effects on MS recovery. The administration of O. biennis oil resulted in significant alterations in the expression levels of miR-182-5p, miR-200c-3p, miR-206-3p, miR-429-3, and miR-1298-5p. The identification of key miRNAs—miR-1298-5p, miR-182-5p, miR-200c-3p, miR-206-3p, and miR-429-3p—suggests their involvement in MS pathogenesis and their potential as biomarkers or therapeutic targets. Future research should focus on validating these findings in human MS patients to determine their diagnostic and prognostic value. Additionally, investigating the molecular mechanisms by which these miRNAs influence immune responses and neuroinflammation could provide insights into novel therapeutic interventions and pave the way for novel treatment strategies targeting miRNA-mediated disease mechanisms in MS.
Ethics Statement
The experimental approval was received from the Animal Ethics Committee at Bezmialem University (Approval Number: 2015/53).
Conflicts of Interest
The authors declare no conflicts of interest.
Author Contributions
Conceptualization and methodology: Huri Demirci, Nur Dogan, Busra Yuce, Emine Seyda Teloglu, Gulreyhan Sonuc, Cagla Yildiz, and Esra Tiftik. Software, statistics: Aysu Kilic: writing – original draft preparation. Writing – reviewing and editing: Huri Demirci, Zozan Guleken, Beren Yildizbas, and Zeynep Ece Bulut. Supervision: Sahabettin Selek.
Funding
This work was supported by Bezmialem Vakıf Üniversitesi Scientific Research Project Department (Number 20113).
Acknowledgments
This work was supported by Bezmialem Vakıf Üniversitesi Scientific Research Project Department (Number 20113).
Open Research
Data Availability Statement
Data supporting the findings of this article will be made available upon reasonable request.


