Vine Performance, Single-Leaf and Whole-Canopy Gas Exchange Under Agrivoltaics Cover in Malvasia di Candia Aromatica and Cabernet Sauvignon Grapevines
Abstract
Background and Aims: Under a surge of interest in the dual use of land, very scant information is still available about physiological and agronomical adaptations of the grapevine grown under agrivoltaics (AV) panels and their compatibility with light energy capture.
Methods and Results: A setup of permanently horizontal AV panels mounted from veraison until harvest over Cabernet Sauvignon (CS) and Malvasia di Candia aromatica (MC) row sections was compared with an open-field (OF) row section of the same cultivars. Uninterrupted diurnal and seasonal whole-canopy gas exchange measurements were taken from August 9 to September 29. In contrast, total light interception, leaf gas exchange and water status, cluster temperature, and photochemical quantum yield of photosystem II (φPSII) readings were concentrated on August 13–14. Vegetative growth, yield components, ripening dynamics, grape and wine composition, and volatile and bound aromas were performed. Based on diurnal and seasonal direct and diffuse light measurements, panels cut incoming light by about 47%. In contrast, the reduction of the whole-canopy net carbon exchange rate (NCER) and transpiration (T) was only 7%–9%. Canopy water use efficiency (WUE) was not significantly affected, although, in CS, WUE lowered when panels cast maximum shade over the central part of the day. With yield components not being affected, under AV, harvest was delayed by 17 and 12 days versus OF in CS and MC, respectively. However, while technological maturity was comparable in MC under OF and AV, the latter had lower monoterpenes and fermentative esters, which might hint at less floral and fruity notes. The rainy late season compromised grape maturity on the CS–AV vines, and the final wines were lighter in color and body.
Conclusions: Under the specific panel’s configuration, the whole-canopy gas exchange was minimally affected in front of a 47% light depletion. Panels caused a consistent ripening delay that was detrimental to free-volatile wine components in MC. In contrast, it worsened grape and wine quality in CS primarily due to unfavorable late-season weather.
Summary
- •
Our trial emphasizes the need for careful physiological assessment of vine response to the specific panel position and orientation and underscores the importance of having a long ripening season.
1. Introduction
Agrivoltaics (AV) refers to a system that integrates photovoltaic modules with food production, enabling the dual use of land for generating energy and growing crops [1–4]. The main goal is to reduce competition between agricultural and solar development [5, 6]. A quick literature search can easily confirm an exponential rise in the number of publications and the growth of the global installed AV capacity, marking about 120 studies and 1200 Gigawatt (GW) in 2022 [7]. Such rise of interest in AV systems is also fed by their positive role within a climate change adaptation strategy: (i) By easing the switch to renewable energy and alleviating the environmental burden of intensive agriculture, they contribute to the reduction of greenhouse gas emissions; (ii) minimizing competition between agricultural and solar energy decreases the risk of deforestation; (iii) shielding crops from direct radiation warrants protection of crops from dangerous temperatures; and (iv) cases of reduced yield loss in situation of drought stress have been reported [8].
Looking in more detail at the physiological implications with performances of the subtending crop, by any means, the most relevant issue is the degree of diurnal and seasonal shading that a given crop can tolerate to achieve the acceptable result of no or minimal yield reduction versus open-field (OF) conditions and maintenance of the quality traits allowing successful product market allocation [9]. Within such a context and regardless of any energy-related issue, a primary distinction is between a continuous field crop and a discontinuous orchard system where rows usually alternate with free alleyway spacing.
If field crops are taken into consideration, available literature already provides some relevant information: Ref. [10] have reported that AV systems (greenhouse or ground) mounted on rocket, cucumber, berries, lettuce, and tomato crops provide a cover ratio equal or lower than 25% that did not show significant effects on plant growth and quality; in the shade-tolerant strawberry and spinach crops, the above effects were not seen even with a 50%–100% cover ratio. Slightly more recent work [11] added more specifications, underscoring that berries, fruits, and fruity vegetables benefited from a reduction in solar radiation by up to 30%. In contrast, forages, leafy vegetables, tubers/root crops, and C3 cereals initially showed less than proportional crop yield loss. In contrast, maize and grain legumes experienced substantial crop yield losses even at low shade levels. Finally, a study performed on two varieties of lettuce over three seasons [12] has concluded that the highest productivity per land area was reached by using trackers instead of stationary photovoltaic panels while notably maintaining biomass production of lettuce close to that obtained under OF conditions.
When the issue of the maximum degree of panel shading affordable by a given crop is shifted to perennial trees usually grown as tall and fairly thin rows separated by alleys for access and machine transit, the context significantly increases in complexity. In fact, if the interaction between variables related to the panels sets up (i.e., minimum and maximum distance above the canopy, width, stationary placement vs. various degrees of tracking, which might also change according to phenological stages or desired grape composition, etc.) and those typically found in an orchard system (canopy sizes, natural light extinction moving from top to canopy bottom, row orientation, soil aspect, between-row spacing, etc.) are to be taken into account, then assessment methodologies need to be adapted to the ambitiousness of the expected results [7, 13, 14]. It is, therefore, not a case that recent work has introduced a decision support system (DSS) approach able to somewhat anticipate plant behavior under these new meso-climate conditions [15, 16]; preliminary simulation produced for a mature vineyard, with a typical panel layout conservative on crop yield, highlights that up to 13% of water could be saved compared to an OF reference. Another useful approach anytime diurnal and seasonal diffuse and direct light distribution changes in an orchard system, even as a function of features and orientation of above-located solar panels, is calculating the ground coverage ratio (GCR) (ratio of the area of photovoltaic panels to area of land) which is deemed as a good indicator of the crop potential productivity in AV systems [17].
Due to the complexity described above, very few studies reporting the impact of AV panels on the yield and fruit quality of perennial tree species have been reported. In apples, maximum AV diurnal shading reduced dry matter content (24%) and soluble carbohydrate concentrations (23%) but maintained malic acid concentrations for 2 years out of 3 [14]. In pear [13], semitransparent AV modules (40% light transmission) caused an average 16% yield loss versus an OF control treatment. Assessing the behavior of the grapevines under AV panels is especially challenging because we move from no canopy at budburst to full canopy, usually reached around veraison; then, within such timeframe, any summer pruning operation can dynamically change the size and distribution of the foliage [18]. Therefore, it also affects the impact of above-canopy AV. Then, in the grapevine, a few vineyard management operations can be objectively hindered by the presence of AV panels: Among them, mechanical harvesting that is currently almost totally performed using over-row machines and any other operation implying canopy topping. It is the case of mechanical shoot trimming. In contrast, other mechanical operations typically have a row-side approach (sprays, leaf removal, mechanical winter pruning using cutter bars, etc.) and are not hindered. Another potential complication when dealing with wine grapes is that the capacity to accumulate sugars in the berry is primarily a function of the exposed leaf area (LA). Hence, the photosynthetic potential [19–21], phenolics (mostly total anthocyanins [ATs]), and flavor compounds are often regulated more locally, that is, as a function of the microclimate that insists around the clusters. Sugar accumulation was delayed when a source limitation was applied late in the season (onset of veraison) by mechanically removing part of the median and apical leaves on a canopy while leaving the basal portion unaltered. In contrast, no delay was seen in the accumulation of total ATs [18]. A take-home message is that the degree of decoupling between technological and phenolic maturity can significantly vary as a function of total and specific canopy portions’ light interception and distribution. Recent work from [19], where fixed panels were placed above a pergola-trained Corvina vineyard casting a quite severe 75% shading, showed the desirable features of less stressful stem water potential and higher photosynthetic rates measured under AV at midday versus the OF control. Nevertheless, while yield per vine was minimally affected, ATs, TSS, and polyphenols were reduced in grapes must from AV vines in each trial year. To testify to the variability of responses in the grapevine, [22] also worked on a pergola trellis with a shading rate of 30% and found essentially no change in vine performance versus the OF installation except for a 10-day delay in the AV treatment to reach the same berry sugar concentration hit by the control. This is a desirable outcome if it is considered the need to postpone harvest into a cooler season within a global warming scenario [20]. A clever step forward in terms of integration between AV panels and grapevine trellis design has been proposed by [21]. They have demonstrated that having a vertical shoot-positioned trellis respecting the rule between-row spacing to maximum canopy height ratio ≥ 1.5 (i.e., 2.7 vs. 1.8 m) also allows prolonged postextension up to 0.8 m above the canopy with vertically oriented panels. The advantages are that the vineyard support trellis needs minimal adjustment, vineyard management is not hindered, and mutual row shading is still negligible. Under such configuration, authors report a 40%–60% installable capacity range and a GCR varying between 1.27 and 1.50. Unfortunately, the authors do not report any vine assessment under the proposed panel’s layout. A general methodological issue that has never been addressed is that when extensively spaced treatments such as AV are implemented, understanding the effects on vine performance should require a whole-canopy approach rather than a traditional single-leaf approach.
In this study, we report vine behavior, single leaf, and whole-canopy physiological responses of Malvasia di Candia aromatica (MC) and Cabernet Sauvignon (CS) grapevines grown from veraison until harvest under a stationary horizontal AV cover versus OF conditions.
2. Material and Methods
2.1. Plant Material, Experimental Layout, and Weather Course
In 2024, AV panel setting and vine assessment were performed in a small experimental vineyard at Residenza Gasparini, a facility of the Università Cattolica del Sacro Cuore located in the Piacenza campus (45.1°N, 9.6°E, Italy). The vineyard features four 50 m long, 35° NE–SW oriented rows planted with cvs. Ortrugo, MC, CS, and Barbera all grafted onto SO4 rootstock. The spacing is 2.5 × 1 m (between rows and in the row, respectively), with a resulting density of 4000 vines/ha. Vines are spur-pruned at a bud load of about 10–12 nodes per meter of row. The main cordon wire is located 90 cm from the ground, whereas single foliage wires are placed 30, 70, and 110 cm above the main wire to allow a maximum canopy height of about 2.2–2.4 m. Manual shoot trimming was performed twice (June 10 and July 16) in all varieties to limit maximum canopy height below 2.5 m.
The i-Pergola Agri PV Tech AV system (i-Pergola, Brescia, Italy) installed in the vineyard combines advanced hardware and software features for seamless integration with agricultural operations. The hardware setup includes 4 row sections, each measuring 16 m long, supported by 3 IPE 140 columns per row, spaced 8 m apart. The foundation depth is 2 m, and the above-ground height is 3 m, ensuring adequate clearance for vineyard machinery other than mechanical harvesting. The structure features a horizontal axis (100 × 100 × 3 mm section) and an east–west tracker with a ±90° movement range powered by a sleeve drive mechanism. Each row is equipped with 8 SunPower P6 495 COM panels (Sun Power Italia Srl, Milano, Italy), providing a total capacity of 16 kWh, complemented by a HUAWEI 15 kW inverter for efficient energy conversion.
Despite panels being mounted on the first part of all rows, readings were taken only on the two central rows planted with Malvasia MC and CS grapevines. Such a decision had the following motivation: (i) the two external rows acted as border rows; (ii) including all varieties would have prevented setting up a minimum number of chambers (i.e., 3) per treatment combination (4 cultivars × two exposures = 8). Real view of the AV panels mounted in the vineyard is reported in Figure S1.
For the whole duration of the trial (DOY 207 with the setup of solar panels to DOY 285 with the harvest of the AV treatment of CS), daily air temperature (minimum, mean, maximum) and precipitation were recorded by the Netsens weather station (Netsens Srl, Firenze, Italy) located adjacent to the vineyard.
2.2. Diurnal Total Light Interception
The amount of intercepted light in the presence/absence of the photovoltaic covers was measured according to the approach presented by [23, 24] with a few modifications. Light readings were taken via a scanner bar equipped with 64 low-cost phototransistors (BPW20RSilicon PN Photodiode, Vishay Telefunken, Heilbronn, Germany) sensing short-wave radiation in the 300–1100 nm waveband. The sensors were embedded in a lightweight aluminum bar (15 mm wide, 35 mm thick) and spaced at 35 mm to yield a total maximum measuring length of 2205 mm. Each sensor had a pixel area of 0.01225 m2 and was covered with a Teflon layer to correct the readings in accordance with Lambert’s cosine law. The scanner bar was wired to an externally powered CR10 WP datalogger (Campbell Scientific Ltd, Lough-borough, UK), equipped with an AM 416 relay multiplexer. The data were then expressed as a photon flux density (PFD, μmol photons m−2s−1), using the multiplying factor of 4.6 reported by [22]. Measurements of total canopy light interception (TCLI) were taken on August 13 (DOY 225) under perfectly clear-sky conditions and negligible wind speed at solar noon (about 2 p.m.) and 2 hours before and after solar noon along unchambered sections of the OF and AV test rows. Readings were taken along three row sections for each cultivar × treatment combination by moving the horizontally held light scanner below the main supporting wire at intervals of 10 cm and a total length of 2.1 m. Each row section encompassed two adjacent vines. Therefore, the total number of measuring points per row section was 22 × 64 = 1408. The light scanner was shifted across the row line at each measurement to include the entire canopy shadow projection. Incident PFD was retrieved from the same sensor used to monitor incoming light for the whole-canopy readings described hereafter. The TCLI per unit of time (μmol photons s−1) was calculated as the summation of the difference between the reference (external) incoming light and the value for each pixel of the under-canopy shadow area (μmol photons m−2 s−1) multiplied by the grid area of each pixel (m2). The grid area per pixel was, in turn, calculated by multiplying step length (100 mm) by the space between sensors along the scanner (35 mm).
2.3. Single-Leaf Function and Cluster Temperature
To assess any possible interaction between cultivars, vineyard cover, and row side on leaf function, gas exchange variables [leaf assimilation rate (A), leaf transpiration rate (E), and stomatal conductance (gs)] were measured on DOY 225 (August 13, post-veraison, TSS ∼ 10°Brix) at three different timings during the day: 12:00 to 13:30; 14:15 to 15:15; and 16:10 to 17:05. Readings were taken on three unchambered vines for each cultivar × treatment combination and, within each vine, six leaves were measured, three per row side. To account for leaf age variation along the shoot, for each row side, a basal, median, and apical leaf was measured using an LCi T Pro (ADC Bioscientific Ltd., Hoddesdon, Herts, UK). Leaves were measured at ambient CO2 and relative humidity without altering their natural position. The same leaves sampled for gas exchange measurements were then subjected to measurements of the photochemical quantum yield of photosystem II (φPSII) taken using a leaf porometer/fluorometer (model LI-600, LI-COR, Lincoln, NE, USA). Finally, the same leaves were destructively processed for midday leaf water potential (ΨMD) readings. They were swiftly enveloped with a transparent bag to reduce transpiration. They were cut at the petiole with a razor blade before quickly inserted into the pressure chamber with a well-protruding petiole stub. Pressurization was stopped when the first sign of xylem sap was seen at the cut surface. Cluster temperature was measured at the three specified times of DOY 225 on three clusters per canopy side of each tagged vine, with an infrared thermometer (model Raynger ST, Raytek, Santa Cruz, CA, USA).
2.4. Whole-Canopy Gas Exchange
Whole-canopy net CO2 exchange rate (NCER) and transpiration (T) were measured using the modified enclosure chamber method described in [25]. In brief, the system features centrifugal blowers (Vorticent C25/2 M Vortice, Milan, Italy) collecting air from a standard 1000 L plastic tank and delivering a maximum airflow of 950 m3 h−1 to fill the chambers; 12 transparent polyethylene chambers (3 per each cultivar × treatment combination) were crafted around the canopy allowing 88% light transmission and 6% diffuse light enrichment and no alteration of the light spectrum (Figure S1); a CIRAS 3-DC CO2/H2O differential gas analyzer (PP-Systems, Amesbury, MA, USA); and a CR1000 data logger wired to an AM16/32B Multiplexer (Campbell Scientific, Shepshed, England). Every complete reading cycle lasted 16 min since the 12 solenoid valves commuted air flow from one chamber to another every 80 s. To keep the airflow fed to the chambers the most constant, 12 circular regulators with adjustable constant flow RAD2 100 BP 15–50 m3 h−1 (France Air Italia, Monza Brianza, Italy) were inserted into the air tube before the air inlet of each chamber. The airflow was set at 13.8 L s−1 for all chambers and maintained unaltered throughout the measurement period. Temperature was measured by shielded 1- or 0.2-mm-diameter perfluoroalkoxy Teflon-insulated Type-T thermocouples (Omega Engineering Stamford, CT, USA) at the air inlet and each chamber’s outlet. In addition, two BF-5 sunshine sensors (Delta-T Devices, Cambridge, England) were placed on top of vertical support, protruding about 50 cm above the chambers’ outlets in the OF and the covered areas for continuous measurement of direct and diffuse radiation.
Each vine was enclosed in a chamber on DOY 221 (August 9) and operated 24/7 until DOY 272 (September 29) with minimal interruptions due to either damage caused by heavy thunderstorms with strong winds (i.e., DOY 256) or minor maintenance interventions. Thus, whole-canopy measurements lasted for 51 days. Whole-canopy NCER (μmol s−1) and T (g hours−1) from airflow and CO2 and H2O differentials were calculated according to [26]. Daily gas exchange means were calculated by averaging data from dawn to dusk.
At harvest, all main and lateral nodes were counted on each per vine, and three shoots per vine were sampled and brought to the laboratory. The LA on each node of the main and lateral shoots was measured with a LA meter (LI-3000 A, LI-COR Biosciences, Lincoln, NE, USA). Afterward, the average LA was calculated for main and lateral shoots. The total LA per vine was calculated by multiplying the node number by the average leaf blade area. Since the gas exchange readings started at a time (August 9) when canopies had by far reached their final size, all gas exchange data were given on a per LA basis for normalization against absolute LA development.
2.5. Ripening Curves, Yield, and Grape Composition at Harvest
The progress of berry ripening as total soluble solids (TSS), pH, and titratable acidity (TA) was assessed in both cultivars starting at veraison (about 5 Brix in CS and about 8 Brix in MC) over 8 and 6 dates, respectively, until harvest was performed in the OF plots. Harvest dates were decided based on the stability of TSS and TA values in the OF vines; conversely, AV harvest was postponed 17 and 12 days in CS and MC, respectively. At each sampling date other than the harvest date, three 100-berry samples per cultivar × treatment combinations were taken, with equal partitioning over the two opposite row sides. Once brought to the laboratory, each sample was immediately weighed and manually pressed at room temperature, and the resulting must be used to determine TSS as Brix, pH, and TA as g L−1. TSS was assessed using a temperature-compensated desk refractometer. At the same time, pH and TA were measured by titration with 0.1 N NaOH to a pH 8.2 endpoint and expressed as g L−1 of tartaric acid equivalents.
At each harvest date, cluster number and total grape weight were recorded for 15 vines representative of each cultivar × treatment combinations, including the three chambered vines for each treatment in each block. Concurrently, three representative clusters per vine—usually located on shoots bore on a basal, median, and apical spur along the cordon—were taken to the laboratory for further processing. On each cluster, the severity of cluster rot, mainly as Botrytis cinerea, berry withering, and berry necrosis, was visually estimated as the percentage of affected berries over total.
From each of the 3 clusters, a 20-berry subsample was taken by carefully cutting each berry at the pedicel with sharp scissors and immediately weighed. In CS, the extraction of ATs was conducted as described by [27]; the 20 berries were peeled, and the skins were soaked in 100 mL of methanol for 24 h in a dark room at 20°C. The analyses were conducted with a spectrophotometer (Libra S80, Biochrome, Cambridge, UK), and an external calibration curve with malvidin-3-glucoside chloride as the standard (Sigma-Aldrich, St. Louis, MO, USA) was used to quantify total ATs at 520 nm. The remainder of each cluster sample was crushed, and the resulting musts were analyzed for technological maturity parameters according to the aforementioned methodology.
An aliquot of the grape juice was diluted four times and filtered through a 0.22-μm polypropylene syringe filter before the analysis to assess tartaric and malic acid concentrations. The HPLC separation was performed using an Agilent 1260 Infinity Quaternary LC system (Agilent Technology, Santa Clara, CA, USA) with a diode array detector (DAD). The chromatographic separation was performed isocratically at 0.8 mL min−1 with an Allure organic acid column, 300 × 4.6 mm and 5 μm (Restek, Bellefonte, PA, USA) using 0.005 N sulfuric acid as mobile phase. The analysis was conducted at 30 ± 0.1°C, and the injection volume was 15 μL. The organic acids were detected at a wavelength of 210 nm, and the quantification was performed using external calibration with authentic standards. The analysis was performed in triplicate.
2.6. White and Red Winemaking
At respective harvest dates, three 30-kg batches of MC grapes per treatment (MC–OF and MC–AV) were manually harvested, and each sample was destemmed, crushed, and pressed with a hydraulic press to obtain approximately 25 L of juice for each batch. The juice was transferred into 30-L stainless steel vats, added with 30 mg L−1 of potassium metabisulfite, and then inoculated with Saccharomyces cerevisiae at 30 g hL−1 (Laffort, Milano, Italy). The fermentation was carried out at 16 ± 2°C and monitored daily by measuring the residual sugars until the end of alcoholic fermentation. At the end of the fermentation, the wines were racked, added to 40 mg L−1 of potassium metabisulfite, and bottled in 750-mL glass crown-capped bottles. Winemaking of CS followed the same protocol until the addition of 30 g hL−1 of Saccharomyces cerevisiae (Laffort, Milano, Italy). The fermentations were performed at 23 ± 2°C, and the pomace was manually punched down twice daily. At the end of the alcoholic fermentation, the red wines were racked off, added with 40 mg L−1 of potassium metabisulfite, and bottled in 750-mL glass crown-capped bottles. The white and red wines were stored at 8°C for 2 months before analyses.
2.7. Wine Analysis
TA, pH, volatile acidity (VA), sulfur dioxide (free SO2 and total SO2), total phenol index (TPI), total phenols (TFs), and cinnamic acids (CAs) content were determined according to the official OIV methods [28]. Glucose and fructose were determined through an automatic multiparametric analyzer (Hyperlab, Steroglass Srl, Italy). The organic acid profile (tartaric, malic, citric) was determined as already reported by [29]. The density and ethanol content was measured with an Alcolyzer (DMA 4500, Anton Paar® GmbH, Graz, Austria). Proanthocyanidins (PROs), total ATs, flavans reactive with vanillin (FrV), and total flavonoids (TFs) were determined as reported by [30]. The colorimetric features of wines were assessed using the CIELab color space analysis, a uniform three-dimensional space defined by the colorimetric coordinates L∗, a∗, and b∗. Within the CIELab space, a psychometric index of lightness, L∗ (ranging from 0, black, to 100, white), and two-color coordinates, a∗ (a∗ > 0 red, a∗ < 0 green) and b∗ (b∗ > 0 yellow, b∗ < 0 blue), are defined. From these coordinates, other color parameters are defined: The hue angle (H∗) is the qualitative attribute of color, and the chroma (C∗) is the quantitative attribute of colorfulness: This saturation metric (S∗) is simply the chroma divided by lightness (C∗/L∗) [31]. All measurements were carried out in triplicate by a V-730 UV–Vis spectrophotometer (Jasco Europe Srl, Cremella, Italy).
2.8. Volatile Composition of MC and CS Wines
Volatile compounds, including free and glycosylated terpenes, were analyzed following the method proposed by [32] with some modifications. A 100 mL of degassed wines (1:1 water: wines) added with 60 μL 2-octanol (400 mg L−1) were loaded on a 1-g C18 Sep Pack cartridge (Isolute ENV+) previously activated with 5 mL methanol followed by 10 mL of deionized water. After sample deposition, cartridges were washed with 20 mL of deionized water to remove acids and sugars. Free volatiles were eluted with 10 mL dichloromethane and recovered in Sovirel vials containing anhydrous sodium sulfate before being concentrated to 200 μL under a nitrogen stream. This fraction was used later to determine free-volatile compounds. To collect glycosylated terpenes, 20 mL methanol was loaded into the previous cartridges, and the eluted fraction was dried in a rotary evaporator under a vacuum to remove methanol. The residue was dissolved in 6 mL of phosphate–citrate buffer (0.1 M Na2HPO4 and 50 mM citric acid; pH 5) and hydrolyzed by adding 2.6 mL of a 250 mg L−1 β-glycosidase enzyme solution (Cytolase, 3000 U/g). Samples were incubated at 40°C for 16 h. To extract hydrolyzed compounds, 20 μL of 2-octanol (400 mg L−1 in absolute ethanol) was added to the hydrolyzates as the internal standard and centrifuged for 15 min at 1500 g. Samples were eluted through cartridges (0.5 g C18 Sep Pack (Isolute ENV+)) previously activated with 5 mL methanol and 10 mL water. Volatiles were recovered with 5 mL dichloromethane, dehydrated with anhydrous sodium sulfate, and concentrated to 200 μL using a gentle nitrogen stream. The analysis was performed with a GC × GC system (Shimadzu Nexis GC-2030) coupled with a TQ8040 NX mass detector. The chromatographic separation was performed on two columns, with an apolar first dimension (1D) column SLB-5 ms fused silica capillary column (Supelco, 20 m × 0.18 mm × 0.18 μm film thickness) coupled to a (2D) SupelcoWAX (Supelco, 5 m × 0.32 mm dc, and df 0.25 μm film thickness). The injector, transfer line, and ion source temperature were 260°C. Oven temperature program conditions were as follows: initial temperature of 40°C for 2 min, programmed at 6°C min−1°C to 220°C. The modulation period was set to 4 s with a hot pulse time of 0.4 s. The modulator was offset by 20°C. Helium (Sapio Spa, Monza, Italy) was used as carrier gas at a constant flow of 15.5 mL min−1 (0.60 mL min−1 in the column). The MS parameters included electron ionization at 70 V with the ion source temperature at 260°C, mass range of 41–360 m/z, and acquisition rate of 8 spectra s−1.
Compounds were identified using the following criteria: (i) by comparing their mass spectra and retention time with those of authentic standards; (ii) the compounds lacking standards were putatively identified by matching their respective mass spectra with those present in commercial libraries (NIST 2020/Wiley 12); (iii) matching the linear retention index (LRI) obtained in our conditions with the published LRI on comparable D1 columns. The volatiles were quantified by area comparison against internal standards (2-octanol) in total ion current (TIC). Bidimensional chromatograms were processed using Chrome Square 2.1 software (Chromaleont Srl, Messina, Italy). The detected peaks of interest were integrated using the same software with a custom integration method with the following conditions: similarity > 80% and ΔLRI < 30.
2.9. Chemicals and Reagents
Methanol, ethanol (LiChrosolv®), dichloromethane (Suprasolv® grade), sulfuric acid, hydrochloric acid, gallic acid, catechin, vanillin, caffeic acid, Folin–Ciocalteu reagent, sodium hydroxide, tartaric acid, malic acid, citric acid, 2-octanol, sodium sulfate anhydrous, polyvinylpolypyrrolidone) (PVPP), iodine, starch, iron sulfate heptahydrate, sulfur dioxide, and phosphoric acid were purchased from Sigma-Aldrich (St. Louis, MO, USA), and the chemicals were all at least of analytical grade. HPLC-grade water was obtained by a Milli-Q system (Millipore Filter Corp., Bedford, MA, USA).
2.10. Statistical Analysis
Within each cultivar, data were generally subjected to a one-way ANOVA within the XLSTAT package (Version 2024.2.2, Addinsoft, New York, NY, USA), and in case of the significance of the Fisher test, OF versus AV means were separated with a t-test at p < 0.05. As per single leaf and water status readings, thanks to the availability of subreplicates per each vine, the analysis was elevated to a factorial design where variety (V), vineyard treatment (T), and exposed row side (R) were the factors, in turn, generating three first-order interactions. The V × T, V × R, and T × R interactions were partitioned only when significant at p = 0.05. For the whole-canopy gas exchange data taken at different time steps on the same individuals during the season, the repeated-measures ANOVA procedure embedded in the XLSTAT software package was used. Pair comparisons within dates were conducted using the least squared mean method at p = 0.05. Regression analyses and R2 calculations were also performed using the same XLSTAT package.
3. Results
3.1. Weather Trends and Vineyard Microclimate
The measuring season is characterized by quite hot and dry July and August months, with Tmax often peaking above 35°C (Figure S2). Conversely, September was unseasonably cool and wet: taking as a reference veraison dates of the two cultivars (July 19 and 31 for MC and CS, respectively) cumulated precipitation until respective harvests dates in OF and AV were 26.8 and 58.5 mm for MC, respectively, and 100.7 and 152.3 mm for CS (Figure S2).
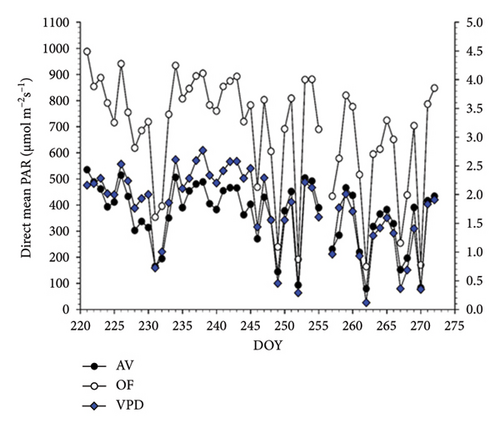
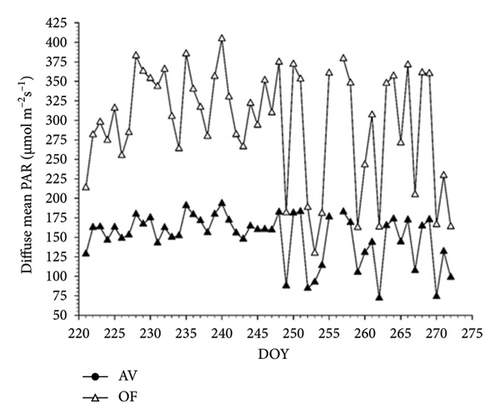
Seasonal trend of mean diurnal direct radiation (PAR as μmol m−2s−1) measured by the BF-5 hemispherical sensor under panels and in OFs covers the total length of whole-canopy gas exchange readings (DOY 221-272) (Figure 1(a)). When pooled over the 51 measuring days, direct PAR under OF conditions was 683 μmol m−2s−1 versus 361 μmol m−2s−1 registered under the AV cover, corresponding to a significant light depletion of 47.2% (Table 1). Daily VPD was higher in July and August versus September and peaked at about 2.5 kPa. When the same patterns were evaluated for the diffuse light component (Figure 2(a)) under panels, this amount was reduced by 49.0% compared to the OF conditions (Table 1).
| Cultivar × treatments | PAR (μmol m−2s−1) | TOD | TOD | TOD | |||||||
|---|---|---|---|---|---|---|---|---|---|---|---|
| Direct | Diffuse | 11:30-12:30 | 14:00-15:00 | 16:00-17:00 | 11:30-12:30 | 14:00-15:00 | 16:00-17:00 | 11:30-12:30 | 14:00-15:00 | 16:00-17:00 | |
| Mean incoming radiation (μmol m−2s−1) | Mean intercepted radiation (μmol m−2s−1) | Intercepted to incoming radiation (%) | |||||||||
| Cabernet Sauvignon | |||||||||||
| OF | 683 ± 30 | 296 ± 10.1 | 1674 ± 6.2 | 1646 ± 6.1 | 1308 ± 9.4 | 688 ± 13.8 | 489 ± 15.5 | 556 ± 13.5 | 41.0 | 29.7 | 42.5 |
| AV | 361 ± 16.8 | 151 ± 4.3 | 969 ± 11.8 | 155 ± 0.8 | 147 ± 0.2 | 682 ± 7.2 | 80 ± 1.8 | 100 ± 1.5 | 70.4 | 51.6 | 68.0 |
| Malvasia di Candia aromatica | |||||||||||
| OF | 683 ± 30 | 296 ± 10.1 | 1674 ± 6.2 | 1646 ± 6.1 | 1308 ± 9.4 | 722 ± 12.6 | 423 ± 14.6 | 499 ± 13.3 | 43.1 | 25.7 | 38.1 |
| AV | 361 ± 16.8 | 151 ± 4.3 | 969 ± 11.8 | 149 ± 0.3 | 147 ± 0.2 | 730 ± 6.4 | 64 ± 1.5 | 99 ± 1.5 | 75.3 | 42.9 | 67.3 |
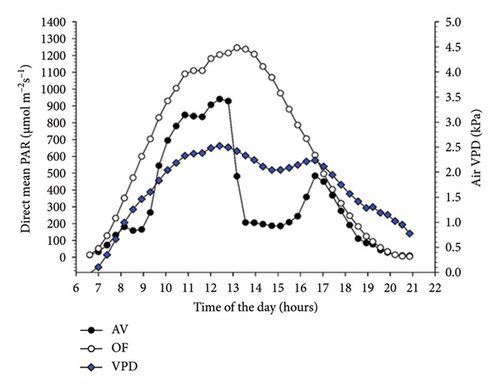
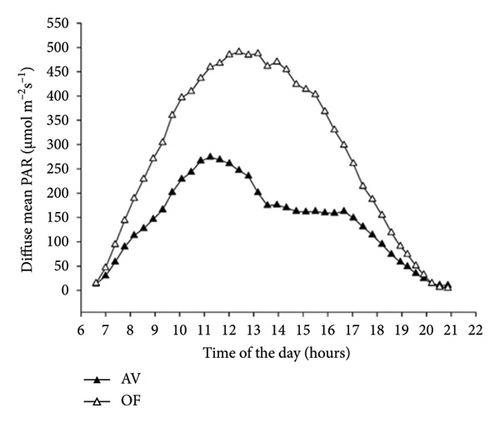
Diurnal variation (from dawn to dusk) of direct radiation averaged over 51 measuring days shows that AV values are always lower than OF values, albeit with substantial intraday variation (Figure 2(a)). Under AV, a first shading “shoulder” is recorded in the morning from about 8:00 to 9:00. In contrast, vines under panel covers become heavily shaded just before solar noon (about 2 p.m. according to the specific site location and row orientation) until 4 p.m., when shading is alleviated before light starts to decline in both treatments with approaching sunset. The diurnal pattern of diffuse light under AV averaged over the same time frame is smoother, showing the lowest diffuse-to-direct light fractions (37%–41%) when the sun is around the zenith point (Figure 2(b)). When the diurnal patterns of air temperature measured at the chambers’ outlets were plotted, it was apparent that, in both cultivars, maximum cooling occurred around 10 a.m. with about 1.6°C–1.7°C less under AV concerning OF (not shown).
The presence of the AV panels profoundly changed patterns of both incoming and intercepted light (Table 1). Generally, fractions of intercepted light to incoming light were much higher than under OF, peaking at 75.3% for readings taken in the morning under the MC–AV. However, these ratios also reflect significant changes in incoming radiation under panels (about 72.6% less vs. OF for data averaged over cultivars and daytime).
3.2. Whole-Canopy Gas Exchange
Seasonal net carbon exchange rates (NCERs) per unit of LA are shown in Figure S3 for CS (A) and MC (B). Repeated ANOVA has shown neither significant main treatment effects nor time × treatment interactions in both cases. In CS, NCER/LA averaged over the 51 measuring days yielded 3.56 µmolm−2s−1 in AV and 3.91 μmol m−2s−1 in OF for a 9.2% seasonal NCER reduction under panels. In MC, the same comparison gave 3.71 and 3.96 µmolm−2s−1 for AV and OF, respectively, corresponding to a 6.3% NCER reduction under panels.
In both cultivars, seasonal T/LA varied between 0 and about 100 g m−2h−1, and the system was able to catch the wide fluctuations occurring on cool and cloudy days versus warm and sunny days (Figure S4). Once again, repeated ANOVA did not result in any significant main treatment and time × treatment effects. Once averaged over the whole measuring season, CS T/LA was 44.6 g m−2h−1 in AV and 48.4 g m−2s−1 in OF, reducing 7.9% under cover (Figure S4A). In MC, average T/LA rates were 50.4 g m−2h−1 in AV and 54.3 g m−2s−1 in OF, for a 7.2% reduction under panels (Figure S4B).
Relative variation of NCER/LA and T/LA over the season originated in CS, an almost identical canopy WUE (5.30 µmolCO2m−2s−1/mmolH2Om−2s−1 in AV vs. 5.33 µmolCO2m−2s−1/mmolH2Om−2s−1 in OF) (Figure S5A). Similar behavior was apparent from the MC, where canopy WUE was set at 4.85 µmolCO2m−2s−1/mmolH2Om−2s−1 in AV versus 4.74 µmolCO2m−2s−1/mmolH2Om−2s−1 in OF (Figure S5B). Unsurprisingly, repeated ANOVA carried out on both datasets did not highlight significant main treatment and time × treatment interaction.
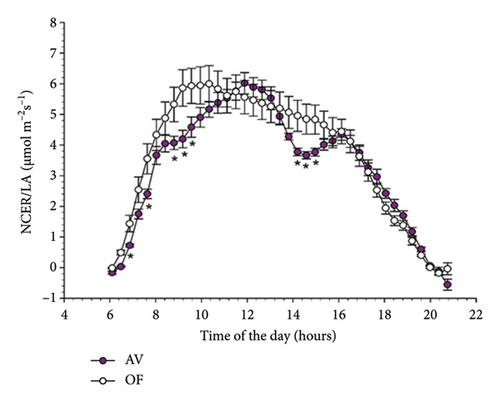
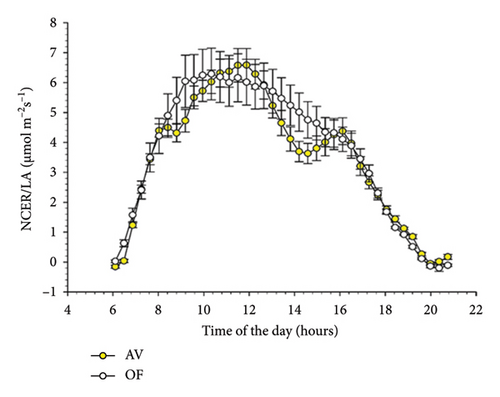
When evaluated on a diurnal basis with data averaging over the 51 measuring days, NCER/LA showed trends reported in Figure 3 for CS (A) and MC (B). In CS, a significant time × treatment interaction occurred (p = 0.001), indicating that, in AV, NCER/LA was significantly lower than that recorded in OF at 8 timings during the day which was concentrated in the morning until about 10 a.m. and in the early afternoon (from 2 to 4 p.m.). Although in MC similar trends were appreciated (Figure 3(b)), the same never reached statistical significance.
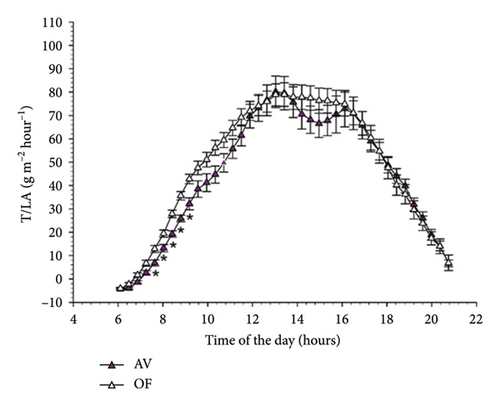
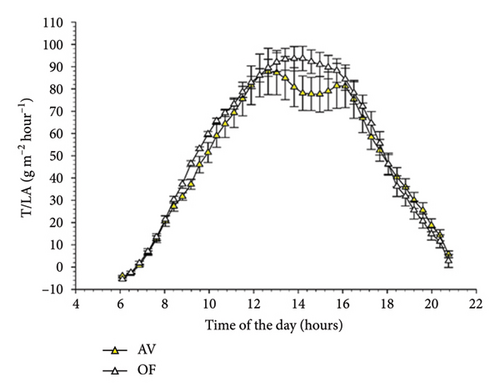
Diurnal trends of T/LA in the two cultivars mimicked those already described for NCER/LA (Figure 4). However, in CS significant differences between AV and OF were limited to 5 timings early in the morning, whereas no statistical differences were detected over the remainder of the day. This concurs with a significant time × treatment interaction (F = 2.307, p = 0.001) highlighted by the repeated ANOVA. In Malvasia, similarly to the NCER/LA rates, no differences between T/LA measured on AV and OF canopies were found at any time of the day (Figure 4(b)).
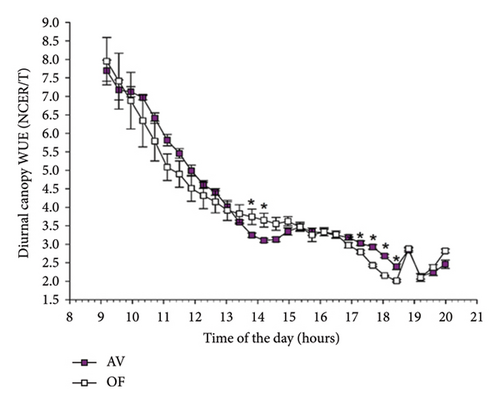
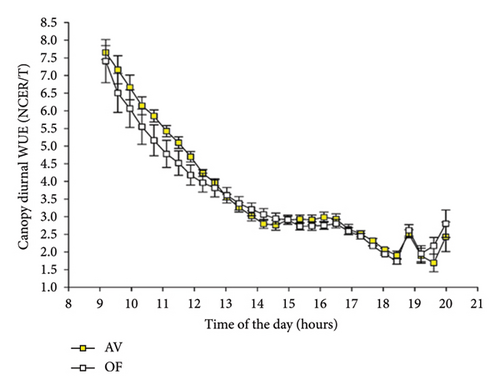
Calculated diurnal canopy WUE showed, for CS (Figure 5(a)), a significant time × treatment interaction, which highlighted, around noon, two timepoints when AV had lower WUE while the opposite occurred on four timepoints over the late afternoon. The same effects did not reach significance in the diurnal canopy WUE calculated for MC (Figure 5(b)).
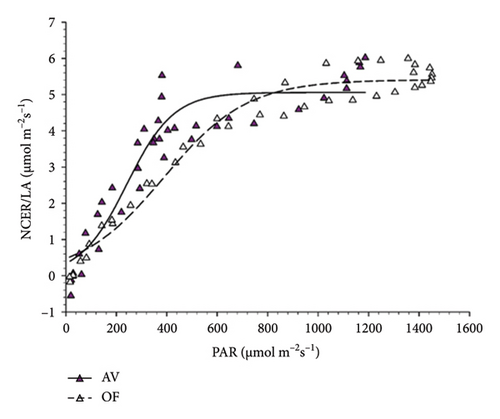
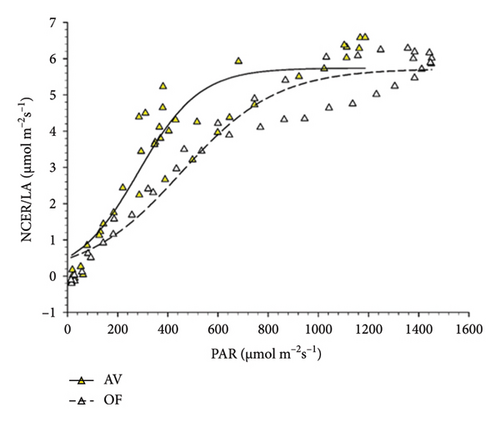
When light response curves were plotted for the two varieties using diurnal NCER/LA pooled over all measuring days and direct radiation as PAR, both datasets closely fitted to a multiparameter sigmoid model with R2 values ranging from 0.88 to 0.96 (Figure 6). Regardless of cultivars, it was apparent that vines growing under AV had a lower light saturation point (about 600 μmol m−2s−1) than that recorded in OF and approaching 1000 μmol m−2s−1; moreover, at intermediate PAR levels (about 200–500 μmol m−2s−1) in both cultivars, vines grown under AV had higher NCER/LA than the OF vines.
3.3. Single-Leaf Gas Exchange, Function, and Water Status
Single-leaf gas exchange and water status data recorded late in the morning of DOY 225 (August 13) are reported in Table 2 as the main effects (cultivar, type of cover, row side) and relative one-order interactions. While the slightly better leaf function recorded in CS seems to be related to a higher amount of incoming radiation during the time measurements were taken, it is relevant that the three parameters affected by the presence of AV were cluster temperature, ϕPSII, and ΨMD which all pointed at less stressful conditions versus the OF plots (Table 2). Due to the well-exposed condition of the east-facing row side at the time of measurements (incoming PAR = 1240 μmol m−2s−1), leaf gas exchange was enhanced for most of the measured parameters. The first-order interactions were mostly significant for TCLUSTER and ϕPSII (Table 3). As expected, panel cover significantly reduced the difference in temperature between E- and W-exposed clusters versus the OF conditions; in terms of V × R interaction, CS clusters showed a lesser T gradient when passing from E to W exposure than MC (Table 3). Panel presence reduced differences in ΨMD between the two varieties, which, instead, amplified under OF conditions with CS hitting the lowest value of −1.30 MPa.
| PAR (μmolm−2s−1) | TCLUSTER (°C) | E (mmol m−2s−1) | gs (mol m−2s−1) | A (μmol m−2s−1) | φPSII | WUEinst (A/E) | WUEi (A/gs) | ΨMD (-MPa) | |
|---|---|---|---|---|---|---|---|---|---|
| Variety (V) | |||||||||
| MC | 608 | 31.7 | 3.32 | 0.150 | 6.31 | 0.581 | 1.60 | 46.2 | 0.90 |
| CS | 914 | 31.4 | 4.94 | 0.198 | 8.75 | 0.520 | 1.65 | 44.0 | 1.10 |
| Treatment (T) | |||||||||
| OF | 791 | 32.9 | 4.65 | 0.178 | 12.1 | 0.484 | 1.51 | 43.7 | 1.15 |
| AV | 731 | 30.3 | 4.13 | 0.170 | 10.4 | 0.627 | 1.74 | 45.1 | 0.77 |
| Row side (R) | |||||||||
| East | 1240 | 33.1a | 4.80 | 0.160 | 11.3 | 0.375 | 2.24 | 65.0 | 1.00 |
| West | 282 | 30.1b | 3.47 | 0.187 | 3.8 | 0.727 | 1.01 | 23.8 | 0.92 |
| V × T (Pr > F) | 0.209 | 0.167 | 0.181 | 0.266 | 0.353 | 0.001 | 0.971 | 0.631 | 0.029 |
| V × R (Pr > F) | 0.553 | 0.039 | 0.297 | 0.606 | 0.255 | 0.007 | 0.763 | 0.691 | 0.948 |
| T × R (Pr > F) | 0.853 | 0.001 | 0.675 | 0.839 | 0.180 | 0.001 | 0.009 | 0.100 | 0.897 |
- Note: Values in bold indicate a significant difference between the two means. Each main factor was tested with n = 6. For first-order interaction, Pr > F is shown in bold when p ≤ 0.05.
| TOD | Variety × treatment (V × T) | Treatment × row side (T × R) | Variety × row side (V × R) | ||||||||||
|---|---|---|---|---|---|---|---|---|---|---|---|---|---|
| CS–OF | MA–OF | CS–AV | MA–AV | OF-E | OF-W | AV-E | AV-W | CS-E | CS-W | MA-E | MA-W | ||
| TCLUSTER (°C) | Morning | — | — | — | 35.0a | 30.7b | 31.0b | 29.5c | 32.6a | 30.2b | 33.4a | 30.0b | |
| Noon | — | — | — | — | 34.1a | 33.1b | 33.7a | 32.1b | 33.7b | 32.8c | 34.1a | 32.5c | |
| Afternoon | — | — | — | — | 34.5b | 37.0a | 33.3c | 33.1c | 33.3b | 34.9a | 34.5a | 35.1a | |
| φPSII | Morning | 0.511bc | 0.438c | 0.529b | 0.725a | 0.238c | 0.710a | 0.511b | 0.743a | 0.309c | 0.732a | 0.440b | 0.722a |
| WUEinst (A/E) | Morning | — | — | — | — | 1.90b | 1.12c | 2.58a | 0.97c | — | — | — | — |
| ΨMD (-MPa) | Morning | 1.30a | 1.00b | 0.81c | 0.72c | — | — | — | — | — | — | — | — |
| Noon | 1.35a | 0.99b | 0.84c | 0.78c | — | — | — | — | — | — | — | — | |
| Afternoon | 1.31a | 1.11b | 0.89c | 0.92c | — | — | — | — | — | — | — | — | |
- Note: Mean separation was performed within each row × type of interactions with the Student–Newman Keuls at p = 0.05 and indicated by superscript small letters. Each treatment combination had n = 3.
First-order interactions found for (φPSII) showed that both cultivars reached suboptimal φPSII values for leaves exposed to the E side, whereas φPSII did not differ between cultivars under OF conditions. For data pooled over cultivars, the OF-E combination reached the highest limitation (0.238). In the morning, leaves inserted on the W side of the canopy had much lower WUEinst than those placed on the E side (Table 3).
The same survey repeated at about solar noon (Table 4) produced a quite different outcome. Due to the very limited incoming radiation, between-variety differences were minor overall. Conversely, the main effects related to the presence or absence of AV cover originated a quite peculiar result. Although AV received only 152 μmol m−2s−1, which caused lower TCLUSTER and A (Table 4), leaf water status was maintained under AV in terms of higher E, gs, and ΨMD. Due to such relative changes, WUEinst and WUEi dropped under panel cover. The main effect of the row side showed minimal impact on the performed readings, with the sole exception of the west-exposed row side being 1.2°C warmer than the opposite row side. The 2 T × R and V × R significant interactions found again for TCLUSTER were of low magnitude, whereas the V × T interaction found for ΨMD very closely mirrored trends observed in the morning (Table 3).
| PAR (μmolm−2s−1) | TCLUSTER (°C) | E (mmol m−2s−1) | gs (mol m−2s−1) | A (μmol m−2s−1) | φPSII | WUEinst (A/E) | WUEi (A/gs) | ΨMD (-MPa) | |
|---|---|---|---|---|---|---|---|---|---|
| Variety (V) | |||||||||
| MC | 244 | 33.3 | 2.96 | 0.120 | 3.14 | 0.625 | 1.13 | 29.6 | 0.88 |
| CS | 284 | 33.2 | 2.61 | 0.120 | 2.82 | 0.690 | 1.14 | 27.4 | 1.10 |
| Treatment (T) | |||||||||
| OF | 377 | 33.6 | 2.544 | 0.101 | 3.51 | 0.632 | 1.45 | 38.8 | 1.16 |
| AV | 152 | 32.9 | 3.035 | 0.139 | 2.43 | 0.728 | 0.81 | 18.2 | 0.81 |
| Row side (R) | |||||||||
| East | 314 | 33.9 | 2.733 | 0.128 | 3.16 | 0.703 | 1.24 | 28.9 | 0.99 |
| West | 215 | 32.6 | 2.845 | 0.113 | 2.79 | 0.612 | 1.03 | 28.1 | 0.99 |
| V × T (Pr > F) | 0.703 | 0.075 | 0.677 | 0.291 | 0.130 | 0.374 | 0.191 | 0.075 | 0.001 |
| V × R (Pr > F) | 0.969 | 0.002 | 0.253 | 0.634 | 0.603 | 0.461 | 0.959 | 0.502 | 0.790 |
| T × R (Pr > F) | 0.920 | 0.008 | 0.221 | 0.681 | 0.459 | 0.059 | 0.527 | 0.621 | 0.234 |
- Note: Values in bold indicate a significant difference between the two means. Each main factor was tested with n = 6. For first-order interaction, Pr > F is shown in bold when p ≤ 0.05.
Data recorded in the afternoon confirmed minor differences between varieties due to limited incoming radiation (Table 5). In terms of treatment’s main effect, at almost the same incident PAR, AV behaved better than the OF vines as it showed higher gs and A, coupled with a less negative ΨMD. As per row-side effects, the east exposed was strongly energy limited (only 114 vs. 1454 μmol m−2s−1 hitting the west-exposed side), leaf function as PSII was optimal, and WUE was also low. Finally, TCLUSTER was confirmed to be quite responsive in terms of interactions (Table 3): Once again, the presence of panels annulled TCLUSTER differences between E- and W-exposed rows, whereas, under OF, a 2.5°C heating for the W side was recorded. To mimic what was seen for both morning and noon measurement windows, ΨMD did not vary between cultivars under AV cover. In contrast, CS was confirmed to reach a more negative ΨMD than MC under OF conditions.
| PAR (μmolm−2s−1) | TCLUSTER (°C) | E (mmol m−2s−1) | gs (mol m−2s−1) | A (μmol m−2s−1) | φPSII | WUEinst (A/E) | WUEi (A/gs) | ΨMD (-MPa) | |
|---|---|---|---|---|---|---|---|---|---|
| Variety (V) | |||||||||
| MC | 766 | 34.8 | 4.26 | 0.123 | 5.13 | 0.579 | 1.00 | 35.0 | 1.01 |
| CS | 803 | 34.1 | 4.52 | 0.154 | 5.94 | 0.636 | 1.21 | 38.1 | 1.10 |
| Treatment (T) | |||||||||
| OF | 789 | 35.8 | 4.26 | 0.125 | 4.88 | 0.599 | 1.04 | 37.2 | 1.21 |
| AV | 779 | 33.2 | 4.52 | 0.151 | 6.19 | 0.649 | 1.17 | 35.8 | 0.91 |
| Row side (R) | |||||||||
| East | 114 | 33.9 | 3.27 | 0.113 | 1.71 | 0.725 | 0.58 | 14.4 | 0.97 |
| West | 1454 | 35.0 | 5.52 | 0.163 | 9.36 | 0.490 | 1.71 | 58.6 | 1.15 |
| V × T (Pr > F) | 0.238 | 0.213 | 0.436 | 0.317 | 0.986 | 0.753 | 0.866 | 0.747 | 0.001 |
| V × R (Pr > F) | 0.202 | 0.021 | 0.339 | 0.383 | 0.896 | 0.362 | 0.527 | 0.346 | 0.790 |
| T × R (Pr > F) | 0.533 | 0.001 | 0.113 | 0.975 | 0.001 | 0.167 | 0.001 | 0.003 | 0.838 |
- Note: Values in bold indicate a significant difference between the two means. Each main factor was tested with n = 6. For first-order interaction, Pr > F is shown in bold when p ≤ 0.05.
3.4. Vegetative Growth, Yield Components, and Grape Ripening
There were no significant changes in CS vines due to panel cover on the total LA and all main yield components (Table 6). Consequently, the LA/Y ratio across treatments was almost the same (about 1.6 m2/kg). However, although the fresh berry weight did not differ, berries grown under AV had a lower skin mass per berry and, consequently, a lower relative skin percentage.
| Parameter | Cabernet sauvignon | Malvasia di Candia aromatica | Sample size (n) | ||
|---|---|---|---|---|---|
| OF | AV | OF | AV | ||
| Canes/vine | 24.3 | 20.0 | 23.0 | 23.0 | 15 |
| Total LA/vine (m2) | 5.57 | 4.86 | 4.71 | 4.86 | 15 |
| Clusters/vine | 29.1 | 26.9 | 24.0 | 21.6 | 15 |
| Berry weight (g) | 1.425 | 1.442 | 2.286 | 2.707 | 45 |
| Skin weight (g/berry) | 0.207 | 0.152 | — | — | 45 |
| Skin-to-berry weight (%) | 13.49 | 10.53 | — | — | 45 |
| Cluster weight (g) | 114.4 | 110.8 | 225.1 | 264.5 | 45 |
| Yield/vine (kg) | 3.335 | 3.021 | 5.33 | 5.34 | 15 |
| LA/yield (m2 kg−1) | 1.673 | 1.608 | 0.883 | 0.910 | 15 |
| TSS (Brix) | 22.2 | 20.9 | 18.5 | 18.4 | 45 |
| pH | 3.34 | 3.32 | 3.12 | 3.31 | 45 |
| TA (g L−1) | 7.34 | 8.48 | 5.50 | 5.00 | 45 |
| Tartaric acid (g L−1) | 8.01 | 7.06 | 6.00 | 6.09 | 45 |
| Malic acid (g L−1) | 1.52 | 2.94 | 0.73 | 1.04 | 45 |
| Total anthocyanins (mg kg−1) | 1628 | 892 | — | — | 45 |
| Total anthocyanins (mg g−1 of skin) | 12.22 | 8.52 | — | — | 45 |
| Berry withering (%) | 2.2 | 0.1 | 2.9 | 1.6 | 45 |
| Berry necrosis (%) | 1.6 | 0.2 | 2.6 | 0.3 | 45 |
| Cluster rot (%) | 10 | 70 | 0 | 0.8 | 45 |
- Note: Within row and cultivar, values in bold are different at p = 0.05 according to t-test. N in the last column indicates sample size.
- Abbreviations: LA = leaf area, TA = titratable acidity, TSS = total soluble solids.
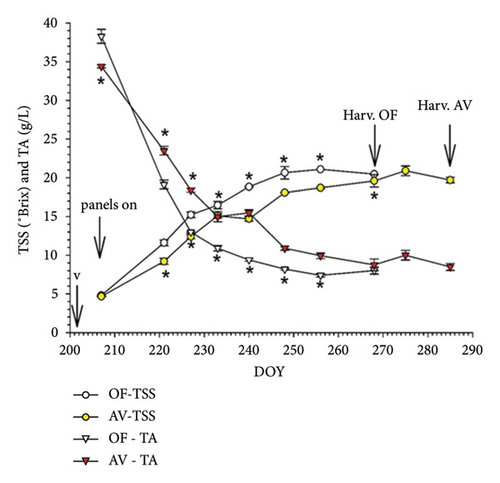
Repeated-measures ANOVA was performed on the TSS and TA data gathered on different dates post-veraison. In CS, a highly significant date × treatment interaction for both parameters originated (Figure 7(a)). Ripening curves showed that soon after panel setup, AV started to significantly delay sugar accumulation and acidity degradation. When OF vines were harvested on September 24, their TSS was still higher than the value found in AV. Extending the harvest date of AV by 17 days did not allow full recovery, as TSS was set at 20.9 Brix versus 22.2 scored for the OF treatment (p = 0.005). TA decline was also slowed down in AV and, at respective harvest dates, CS vines grown under panel cover retained higher total acidity and malic concentration than OF and, instead, lower tartaric acid concentration. Total ATs were severely curtailed in AV regardless of the unit of expression (Table 6). Although berry dehydration and necrosis were minimal in the OF treatment, panel cover allowed for almost the elimination of this low percentage. Due to the extremely rainy period elapsing between the two harvest dates in CS (Figure S2), cluster rot incidence reached a remarkable 70% compared to the OF treatment.
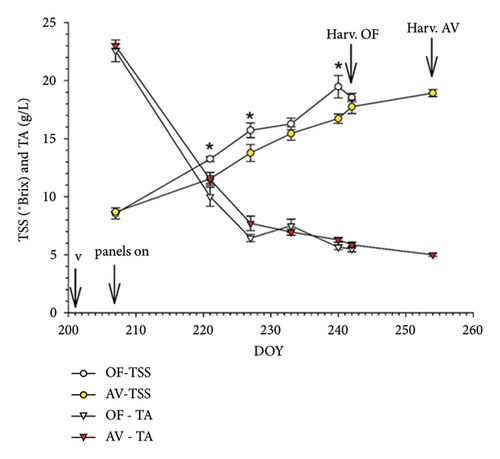
In MC, total LA and yield per vine were very homogeneous between the two treatments, originating, in turn, a very close LA/Y ratio (about 0.9 m2/kg) (Table 6). To partially differ from the results shown in Cabernet S, AV promoted a larger berry size and cluster weight, which was also higher, although at the border of significance (p = 0.06). Repeated ANOVA performed on the TSS and TA data obtained at different dates post-veraison originated a highly significant date × treatment interaction only for TSS (Figure 7(b)), showing a delayed sugar accumulation in AV since DOY 221 that was overall maintained for the remainder of the season. However, at the harvest of OF, this gap was almost filled (17.8°Brix in AV vs. 18.5°Brix in OF, ns), and at the respective harvest dates (Table 6), TSS was very close to full compensation in AV. Nevertheless, AV retained higher pH and malic acid concentration at similar TSS. In Malvasia, panel covers proved effective at significantly decreasing the incidence of berry withering and necrosis. Albeit significant, the increase in cluster rot was inconsistent (0.8% at AV harvest).
3.5. Wine Properties
The chemical–physical compositions of MC (MC–OF vs. MC–AV) and CS (CS–OF vs. CS–AV) wines are reported in Tables 7 and 8. All alcoholic fermentations were regularly completed within 7–8 days (residual sugars < 0.2 g L−1). VA and total sulfur dioxide concentrations did not show significant differences between treatments and ranged from 0.27 to 0.36 g L−1 and from 64.0 to 69.0 g L−1, respectively, falling within the legal limit (EU Regulation No. 606/2009). The OF wines showed the lowest pH values compared to the AV wines, while no significant difference in TA, density, and ethanol content was found among the treatments.
| Unit | CS–OF | CS–AV | |
|---|---|---|---|
| Wine attributes | |||
| pH | — | 3.18 | 3.21 |
| Titratable acidity1 | g L−1 | 6.49 | 6.80 |
| Ethanol | % (v/v) | 10.89 | 10.01 |
| Density | g L−1 | 0.99 | 0.99 |
| Free SO2 | mg L−1 | 16.3 | 14.0 |
| Total SO2 | mg L−1 | 64.3 | 65.0 |
| Volatile acidity2 | g L−1 | 0.36 | 0.35 |
| Organic Acids | |||
| Tartaric acid | g L−1 | 2.94 | 2.36 |
| Malic acid | g L−1 | 2.53 | 3.09 |
| Citric acid | g L−1 | 1.46 | 0.87 |
| Chromatic features | |||
| L∗ | — | 37.07 | 46.42 |
| a∗ | — | 72.16 | 71.52 |
| b∗ | — | 50.7 | 34.9 |
| H∗ | — | 35.1 | 26.1 |
| C∗ | — | 88.2 | 79.7 |
| S∗ | — | 2.39 | 1.72 |
| DE | — | — | 2.80 |
| Color8 | — |  |
 |
| Phenolics | |||
| Total phenol index | — | 26.54 | 19.52 |
| Total phenols3 | mg L−1 | 1495.50 | 1259.33 |
| Cinnamic acids4 | mg L−1 | 396.9 | 322.71 |
| Proanthocyanidins5 | mg L−1 | 1599.0 | 1076.6 |
| Total anthocyanins6 | mg L−1 | 152.64 | 76.73 |
| Flavans reactive to vanillin7 | mg L−1 | 607.40 | 420.85 |
| Total flavonoids7 | mg L−1 | 1065.29 | 817.96 |
- Note: Within each row, values in bold are different at p ≤ 0.05 according to t-test, n = 3. CS–OF: Cabernet Sauvignon vines under open-field (OF); CS–AV: Cabernet Sauvignon vines under agrivoltaics (AV) panels.
- 1Titratable acidity: expressed as g L−1 of tartaric acid equivalent.
- 2Volatile Acidity: expressed as g L−1 of acetic acid equivalent.
- 3Total phenols: expressed as mg L−1 of gallic acid equivalent.
- 4Cinnamic acid: expressed as mg L−1 of caffeic acid equivalent.
- 5Procyanidins: expressed as mg L−1 of cyanidins acid equivalent.
- 6Total anthocyanins: expressed as mg L−1 of malvidin equivalent.
- 7Flavans reactive to vanillin: expressed as mg L−1 of catechin equivalent.
- 8Color of wine reproduced on the basis of CIELab coordinates by using the colorizer software (https://colorizer.org. accessed on 28-01-2025).
| Unit | MC–OF | MC–AV | |
|---|---|---|---|
| Wine attributes | |||
| pH | — | 3.12 | 3.20 |
| Titratable acidity1 | g L−1 | 6.70 | 6.41 |
| Ethanol | % (v/v) | 10.42 | 10.55 |
| Density | g L−1 | 0.99 | 0.99 |
| Free SO2 | mg L−1 | 18.67 | 16.33 |
| Total SO2 | mg L−1 | 68.00 | 68.67 |
| Volatile acidity2 | g L−1 | 0.28 | 0.27 |
| Organic acids | |||
| Tartaric acid | g L−1 | 2.05 | 1.81 |
| Malic acid | g L−1 | 1.33 | 1.42 |
| Citric acid | g L−1 | 0.58 | 0.66 |
| Chromatic features | — | — | — |
| L∗ | — | 100.21 | 102.41 |
| a∗ | — | 0.18 | −0.03 |
| b∗ | — | 7.42 | 6.55 |
| H∗ | — | 88.76 | 89.57 |
| C∗ | — | 7.42 | 6.55 |
| S∗ | — | 0.07 | 0.06 |
| DE | — | — | 2.00 |
| Color8 | — |  |
 |
| Phenolics | — | — | — |
| Total phenol index (TPI) | — | 8.1 | 7.31 |
| Total phenols3 | mg L−1 | 233.13 | 238.5 |
| Cinnamic acids4 | mg L−1 | 89.56 | 83.12 |
| Proanthocyanidins5 | mg L−1 | 29.86 | 42.15 |
| Total anthocyanins6 | mg L−1 | nd9 | nd |
| Flavans reactive to vanillin7 | mg L−1 | 11.1 | 13.94 |
| Total flavonoids7 | mg L−1 | nd | nd |
- Note: Within each row, values in bold are different at p ≤ 0.05 according to t-test, n = 3. MC–OF: Malvasia di Candia aromatica vines under open-field (OF) conditions; MA-AV: Malvasia di Candia aromatica vines under agrivoltaics (AV) panels.
- 1Titratable acidity: expressed as g L−1 of tartaric acid equivalent.
- 2Volatile acidity: expressed as g L−1 of acetic acid equivalent.
- 3Total phenols: expressed as mg L−1 of gallic acid equivalent.
- 4Cinnamic acid: expressed as mg L−1 of caffeic acid equivalent.
- 5Procyanidins: expressed as mg L−1 of cyanidins acid equivalent.
- 6Total anthocyanins: expressed as mg L−1 of malvidin equivalent.
- 7Flavans reactive to vanillin: expressed as mg L−1 of catechin equivalent.
- 8Color of wine reproduced on the basis of CIELab coordinates by using the colorizer software (https://colorizer.org. accessed on 28-01-2025).
- 9nd: not detectable.
As reported in Table 7, the final CS wine composition was maintained for OF higher tartaric and lower malic, as previously ascertained in grape juices. Regarding the wine’s color, OF wines had a higher Hue angle (H∗), chroma (C∗), yellow-blue color coordinate (b∗), and color saturation (S∗), whereas AV wine showed a higher lightness (L∗). TFs and all classes of phenolics were significantly curtailed under AV cover. As per volatile compounds (Table 9), several esters, monoterpenes (namely, D-Limonene, citronellol, and nerolidon), and nor-isoprenoids (-damascenone) were lower in AV wines.
| RTa | 1D LRIb | Free aromatic compounds | Chemical class | CS–OF | CS–AV |
|---|---|---|---|---|---|
| 6.61 | 814 | Ethyl butyrate | Ester | 29.39 | 42.44 |
| 7.62 | 856 | 4-Methyl-1-pentanol | Higher alcohol | 10.09 | 8.49 |
| 7.67 | 858 | Ethyl 2-methylbutyrate | Ester | 0.61 | 0.23 |
| 7.81 | 864 | Ethyl isovalerate | Ester | 2.11 | 1.35 |
| 7.83 | 864 | 3-Methyl-1-pentanol | Higher alcohol | 23.01 | 17.41 |
| 8.45 | 887 | 1-Hexanol | C6 alcohol | 1162.64 | 897.20 |
| 8.50 | 888 | Isoamyl acetate | Ester | 632.51 | 754.63 |
| 11.04 | 982 | 1-Heptanol | Higher alcohol | 7.92 | 8.36 |
| 11.26 | 989 | 1-Octen-3-ol | Higher alcohol | 2.83 | 3.66 |
| 11.68 | 1004 | Ethyl hexanoate | Ester | 170.78 | 178.19 |
| 12.02 | 1018 | Hexyl acetate | Ester | 2.61 | 2.61 |
| 12.40 | 1033 | 3-Ethyl-4-methylpentan-1-ol | Higher alcohol | 28.72 | 22.09 |
| 12.51 | 1037 | D-Limonene | Monoterpene | 2.03 | 1.51 |
| 13.24 | 1064 | Ethyl 2-hydroxy-4-methylvalerate | Ester | 15.56 | 13.00 |
| 13.61 | 1078 | Isoamyl lactate | Ester | 8.21 | 9.01 |
| 13.80 | 1084 | 1-Octanol. 2.7-dimethyl- | Monoterpene | 7.34 | 10.33 |
| 14.40 | 1106 | Linalool | Monoterpene | 1.88 | 1.53 |
| 16.39 | 1187 | Diethyl succinate | Ester | 61.42 | 65.53 |
| 17.51 | 1234 | 2.4-Dimethylbenzaldehyde | Aldehyde | 11.35 | 11.85 |
| 16.72 | 1200 | Ethyl octanoate | Ester | 152.14 | 158.25 |
| 17.60 | 1238 | Citronellol | Monoterpene | 5.37 | 3.64 |
| 17.97 | 1253 | Ethyl phenylacetate | Ester | 1.63 | 2.93 |
| 18.28 | 1266 | Phenethyl acetate | Ester | 49.46 | 54.01 |
| 19.66 | 1325 | Isopentyl heptanoate | Ester | 98.60 | 53.15 |
| 19.96 | 1339 | Ethyl 3-hydroxyoctanoate | Ester | 5.58 | 5.69 |
| 21.12 | 1391 | β-Damascenone | Norisoprenoids | 4.74 | 3.38 |
| 21.25 | 1396 | Ethyl decanoate | Ester | 24.44 | 23.85 |
| 22.63 | 1462 | Ethyl 2-hydroxy-3-phenylpropanoate | Ester | 140.19 | 104.54 |
| 23.62 | 1508 | δ-Decalactone | Lactones | 1.89 | 2.26 |
| 24.79 | 1567 | Nerolidol | Monoterpene | 3.02 | 1.25 |
| RTa | 1D LRIb | Bound aromatic compounds | Chemical class | CS–OF | CS–AV |
| 6.72 | 819 | 2,3-Dimethyl-1-pentanol | Higher alcohol | 249.57 | 216.01 |
| 11.67 | 1003 | 3,5,5-Trimethyl-1-hexanol | Higher alcohol | 19.47 | 17.76 |
| 15.17 | 1139 | Phenylethyl alcohol | Higher alcohol | 57.15 | 47.90 |
| 16.47 | 1190 | Dihydrocitronellol | Monoterpene | 3.62 | 23.29 |
| 18.99 | 1295 | 4-Vinylphenol | Phenols | 18.74 | 15.79 |
| 26.77 | 1651 | 3-Oxo-α-ionol | Norisoprenoids | 9.26 | 8.81 |
- Note: Within each row, values in bold are different at p ≤ 0.05 according to t-test, n = 3. CS–OF: Cabernet Sauvignon vines under open-field (OF); CS–AV: Cabernet Sauvignon vines under agrivoltaics (AV) panels.
- aRT: Retention time (minutes).
- bLinear retention index on the first dimension (C8-C20 normal alkanes).
Final MC wines had fairly similar basic attributes and overall confirmed must analyses (Table 8). As per phenolics components, the AV wines had lower TPI and CAs and higher PROs. Volatile compounds differed between the two wines: esters and several free monoterpenes were significantly lower in AV wines (Table 10). However, the prevailing bound aromatic compounds showed that geraniol plus derivatives concentration did not differ between the two wines, and AV doubled the content in nerol versus OF wines.
| RTa | 1D LRIb | Free-volatile compounds | Chemical class | MC–OF | MC–AV |
|---|---|---|---|---|---|
| 6.61 | 814 | Ethyl butyrate | Ester | 44.91 | 44.18 |
| 7.61 | 856 | 4-Methyl-1-pentanol | Higher alcohols | 10.89 | 5.36 |
| 7.67 | 858 | Ethyl 2-methylbutyrate | Ester | 0.56 | 0.39 |
| 7.81 | 864 | Ethyl isovalerate | Ester | 2.95 | 2.51 |
| 7.83 | 864 | 3-Methyl-1-pentanol | Higher alcohol | 23.83 | 17.92 |
| 8.45 | 887 | 1-Hexanol | C6 alcohol | 511.61 | 518.87 |
| 8.49 | 888 | Isoamyl acetate | Ester | 1558.45 | 657.19 |
| 11.04 | 982 | 1-Heptanol | Higher alcohol | 9.07 | 9.95 |
| 11.22 | 988 | 3-Methylpentyl acetate | Ester | 0.91 | 0.32 |
| 11.68 | 1004 | Ethyl hexanoate | Ester | 356.60 | 223.25 |
| 12.02 | 1018 | Hexyl acetate | Ester | 38.83 | 4.66 |
| 12.51 | 1037 | D-Limonene | Monoterpene | 1.91 | 1.59 |
| 13.30 | 1067 | Ethyl 2-hydroxy-4-methylpentanoate | Ester | 31.95 | 24.08 |
| 13.61 | 1078 | Isoamyl lactate | Ester | 12.49 | 7.95 |
| 13.68 | 1080 | trans-Linalool oxide (furanoid) | Monoterpene | 8.36 | 5.95 |
| 13.79 | 1084 | 1-Octanol. 2.7-dimethyl- | Monoterpene | 8.53 | 9.02 |
| 14.08 | 1094 | cis-Linalyl oxide (furanoid) | Monoterpene | 3.61 | 1.19 |
| 14.56 | 1113 | Hotrienol | Monoterpene | 5.59 | 3.94 |
| 14.75 | 1121 | Linalool | Monoterpene | 152.00 | 90.89 |
| 16.39 | 1187 | Diethyl succinate | Ester | 65.66 | 49.97 |
| 16.39 | 1187 | trans-linalool oxide (pyranoid) | Monoterpene | 38.83 | 18.96 |
| 16.72 | 1200 | Ethyl octanoate | Ester | 481.73 | 302.09 |
| 16.93 | 1209 | 2,6-Dimethyl-3,7-octadiene-2,6-diol | Monoterpene | 202.36 | 168.67 |
| 16.95 | 1210 | α-Terpineol | Monoterpene | 42.52 | 26.20 |
| 17.51 | 1234 | 2.4-Dimethylbenzaldehyde | Aldehyde | 11.93 | 13.53 |
| 17.81 | 1247 | Citronellol | Monoterpene | 17.89 | 27.39 |
| 18.06 | 1257 | trans-3-Hexenyl butyrate | Ester | 9.29 | 3.03 |
| 18.31 | 1267 | Phenethyl acetate | Ester | 447.08 | 169.16 |
| 19.96 | 1339 | Ethyl 3-hydroxyoctanoate | Ester | 4.48 | 4.73 |
| 20.36 | 1357 | 2,6-Dimethyl 2,6-octadiene | Monoterpene | 2.09 | 1.73 |
| 21.12 | 1391 | β-Damascenone | Norisoprenoids | 9.87 | 8.73 |
| 21.62 | 1414 | Ethyl decanoate | Ester | 101.94 | 47.16 |
| 22.62 | 1462 | Ethyl phenyllactate | Ester | 105.67 | 81.87 |
| 25.35 | 1594 | Ethyl dodecanoate | Ester | 15.66 | 3.86 |
| 23.62 | 1508 | δ-Decalactone | Lactones | 2.53 | 2.43 |
| 24.82 | 1569 | Nerolidol | Monoterpene | 6.61 | 8.63 |
| RTa | 1D LRIb | Bound aromatic compounds | Chemical class | CS–OF | CS–AV |
| 6.39 | 803 | 2,3-Dimethyl-1-pentanol | Higher alcohol | 248.93 | 290.84 |
| 10.99 | 980 | 2-Ethy-1-hexanol | Higher alcohol | 362.89 | 424.32 |
| 13.65 | 1079 | cis-Furan linalool oxide | Monoterpene | 62.59 | 48.83 |
| 14.12 | 1095 | trans-Linalool oxide (furanoid) | Monoterpene | 11.33 | 6.24 |
| 15.22 | 1141 | Phenylethyl alcohol | Higher alcohol | 61.38 | 49.96 |
| 15.59 | 1156 | trans-Pyranoid linalool oxide | Monoterpene | 71.94 | 72.95 |
| 16.47 | 1190 | Dihydrocitronellol | Monoterpene | 10.48 | 8.90 |
| 16.92 | 1208 | cis-3-Hexenyl butyrate | Ester | 1.50 | 1.86 |
| 16.90 | 1208 | trans-3,7-Dimethyl-1,5-octadien-3,7-diol (Terpenediol I) | Monoterpene | 23.06 | 8.48 |
| 16.95 | 1210 | α-Terpineol | Monoterpene | 4.99 | 3.70 |
| 17.59 | 1238 | Nerol | Monoterpene | 77.09 | 162.36 |
| 17.63 | 1239 | Citronellol | Monoterpene | 3.50 | 2.75 |
| 17.64 | 1240 | Geraniol | Monoterpene | 1522.03 | 1493.95 |
| 19.98 | 1340 | 2-Methoxy-4-vinylphenol | Phenols | 22.18 | 10.74 |
| 20.68 | 1372 | (E)-8-Hydroxylinalool | Monoterpene | 71.02 | 80.28 |
| 25.38 | 1596 | Humulene II epoxide | Monoterpene | 35.52 | 26.82 |
| 26.13 | 1634 | 3-Hydroxy-β-damascone | Norisoprenoids | 239.33 | 280.52 |
| 26.78 | 1671 | 3-Oxo-α-ionol | Norisoprenoids | 3.75 | 2.02 |
- Note: Within each row, values in bold are different at p ≤ 0.05 according to t-test, n = 3. MC–OF: Malvasia di Candia aromatica vines under open-field (OF) conditions; MC–AV: Malvasia di Candia aromatica vines under agrivoltaics (AV) panels.
- aRT: Retention time (minutes).
- bLinear retention index on the first dimension (C8-C20 normal alkanes).
4. Discussion
There are at least three main items deserving attention when considering the interaction between AV panels and vineyard performances: (i) sustainability of the dual use of land, which is primarily a function of the maximum amount of shade that the vines can withstand without compromising vineyard efficiency; (ii) physiological and agronomic adaptation to the imposed shading pattern; and (iii) degree of interference with vineyard management operations.
A few review papers [10, 17, 33] have repeatedly stressed the meaning of the GCR, defined as the ratio of module area to land area or the ratio of array length to row-to-row pitch, as a reliable indicator of crop potential productivity. In our work, the array length is 109.2 cm, and between-row spacing is 250.0 cm, resulting in a GCR of 43.7%. According to [17], it appears that a GCR < 25% is required to ensure that yield reduction is contained within 20%. In their paper, a specific relationship is also shown for fruit crops, emphasizing that a breakeven (i.e., no changes in yield vs. OF conditions) is reached at a GCR of about 55%. Our value fits nicely with this forecast as, in both varieties, the total yield per vine was very similar to the OF conditions. This refers to horizontally fixed panels that started to cast shade on the canopies around the veraison and, clearly, berry growth occurring after the lag phase was not impacted by the cover, indicating that the level of shading was not limiting for this process. Similar results were reached in other studies where the limiting factor was, for instance, water shortage applied post-veraison [34, 35].
A thoughtful analysis of the physiological and agronomic adaptation to the vineyard cover must start with an accurate assessment of the changes in the amount of direct and diffuse light under AV and OF conditions. Thanks to the BF-5 sensors placed on top of the canopy with or without the panel cover, it was possible to estimate that, under AV, season-averaged direct and diffuse PAR were cut, respectively, by 47.2% and 49.1%, a significant reduction versus OF light availability (Figures 1 and 2). Such fractions are much higher than the season-averaged limitation of the NCER/LA under panels, which was calculated at −9.2% in CS and −6.3% in MC (Figure S3) and resulted to be nonsignificant over the whole season of measurements. This seems to be a very rewarding and promising result as, despite a substantial radiation cut, whole-canopy-based NCER/LA was overall scantly affected. From a physiological standpoint, this response is inherent to the information contained within a generic light response curve, which, in the grapevine, usually sets a light saturation point at around 800–1000 μmol m−2s−1 [36] which is, more or less, half of the maximum incident radiation registered in summer under a clear sky. Therefore, as long as we move primarily along the flat part of the light response curve, a mild limitation of the photosynthetic rate might be expected. Indeed, when we plotted, for each variety, a light response curve built with the seasonal actual data, a more precise scenario was displayed (Figure 4). Quite interestingly, regardless of the variety, fitting the same sigmoid model to the datasets allowed two features to emerge: (i) canopies grown under AV since veraison had a lowered light saturation point as compared to OF and (ii) at PAR values centered around 400 μmol m−2 s−1, AV achieved higher NCER/LA. Both responses hint at an adaptation strategy to a given level of shading, leading vines to improve utilization of light at a suboptimal intensity [37, 38].
Given the moderate reduction of NCER/LA under AV in our study, it becomes quite intriguing to evaluate how T/LA was affected and, in turn, canopy WUE. Seasonal reduction of T/LA varied from 7.2% to 7.9% across varieties and, under no time × treatment interactions, T/LA trends mirrored quite closely those of NCER/LA. T/LA values could be accurately predicted by a linear correlation with air VPD (not shown). This outcome aligns well with recent work on different canopy geometries [21] and previous work employing single-leaf approaches [39, 40]. The expected consequence from the above is that seasonal WUE did not vary.
However, when canopy WUE is evaluated on a diurnal basis, conclusions can be slightly different in the presence of ample fluctuations of incoming direct and diffuse radiation. It is indeed true that, looking at diurnal canopy WUE in CS, a significant treatment × date interaction occurred, showing that at 2 hours around solar noon canopy WUE was lower in AV and vice versa, starting at about 5 p.m., AV had higher canopy WUE than OF until about 6:30 PM. By comparing these trends with the diurnal fluctuation of direct light, it is easy to conclude that when the panel shading is the most severe (13:30 to 15:30), the WUE of canopies under AV tends to worsen. In contrast, the opposite happens when direct PAR under AV resumes to values very close to those measured in OF.
The leaf gas exchange assessment was very helpful in corroborating this hypothesis. In fact, when the two expressions of leaf WUE were considered, in case direct PAR available for the AV and OF treatments were similar and not limiting (Table 2), leaf WUE was not affected. By contrast, further reduction due to the presence of the mostly diffuse light hitting the two-row sides at solar noon drastically deteriorated leaf WUE under AV (Table 4). Conversely, replenishment of nonlimiting and comparable mean direct PAR in the afternoon readings (Table 5) reestablished the condition observed mid-morning. It is also worth noting that, regardless of variety or vineyard cover, the shaded side of a row always had much lower leaf WUEs. The reasons underlying such behavior seem rather straightforward: under limiting light (i.e., PAR < 200 μmol m−2s−1), A is severely curtailed as quantum yield is directly affected, whereas E is less limited as the still high VPD drags transpiration [41].
It is also noteworthy that gas exchange data recorded in the afternoon of DOY 225, while showing very similar PAR levels hitting on the west row side of the two vineyard cover treatments (Table 5), display higher A rates in AV than OF, although E rates were not affected. The nature of this effect reminds previous work by [42], who reported a significant afternoon depression in the photosynthetic capacity of grapevine leaves constantly held under high light (1450 μmol m−2s−1) but not in leaves previously exposed to moderate photon flux density (750 μmol m−2s−1). Less negative ΨMD recorded in AV and a tendency to retain higher ϕPSII support the above hypothesis.
The dynamics of sugar accumulation observed in both cultivars are an interesting subject of discussion (Figure 7). About 2 weeks after the panel’s placement, TSS was already limited, and such limitation continued until harvest when the gap between AV and OF tended to fill in MC (Figure 7(b)) while maintaining a significant difference in CS (Figure 7(a) and Table 6). This temporary sugar limitation is difficult to explain for two reasons: seasonal and diurnal NCER/LA limitation (ranging from 6.3% in MC o 9.2% in CS) was found to be statistically not different from OF rates, and the final LA/Y ratio was similar between the two treatments, although MC set slightly below the 1 m2/kg threshold. However, an older study where mature vines were conditioned in the field to receive 100%, 60%, and 30% of the incoming light [37] showed that berry sugar accumulation was restricted more than proportionally for a fraction of shading the closest to our conditions (60%) despite a mild reduction in leaf assimilation. This implies that cluster sink strength, as affected by the amount of imposed shading, also plays a role in the berry sugar intake. The above hypothesis has been recently confirmed by [43] who applied intermittent seasonal shading on young potted Shiraz grapevines and, under well-watered conditions, observed a consistent delay in the onset of veraison and the final sugar content per berry at harvest.
From an agronomical standpoint, the minimal goal to be achieved using AV is to maintain yield and grape/wine quality traits [19]. A further desirable feature would be to delay harvest and postpone it to a cooler period of the season with undoubtful benefits for both white and red winemaking.
Data taken in CS aligned with those on Malvasia in terms of unchanged yield components and similar vine balance given as the final LA/Y ratio, whereas TSS at the respective harvest dates was still lower in AV (Table 6). However, likely due to the quite wet and rainy late season, besides the large increase in cluster rot incidence (Table 6), total TA and malic acids were still higher in AV with a 17-day delayed harvest versus OF and, most regrettably, total ATs were dramatically reduced. Based on recorded weather characteristics (Figure S2), it is very unlikely that low color at harvest is due to the degradation of already-formed pigments [44]. Instead, [68] has shown that in grape skins of Botrytis-affected berries, concentrations of all the phenolic compounds (ATs and PRO monomers, dimers, and trimers) decreased drastically. It is also quite peculiar that, at harvest, TSS was reduced by 6.1% under AV versus OF, whereas total ATs (mg g−1) were curtailed by 45.2% (Table 6). Although the measurements of whole-canopy gas exchange could not be extended until the harvest of AV vines, the likely late-season low photosynthetic performance might have triggered a mechanism already reported in [46, 47]. These authors showed that carbon limitation in CS and Sangiovese decreased total AT concentration by 84.3% compared to the nonsource-limited control, whereas it decreased sugar concentration only by 27.1%. Mathematical analysis of carbon balance indicated that berries used a higher proportion of fixed carbon for sugar accumulation under carbon limitation (76.9%) than under carbon sufficiency (48%).
As per the final CS wines, according to [48, 49] and based on analytical differences, OF wines had higher color intensity (C∗), color saturation (S∗), and hue angle (H∗), indicating that these wines had a darker color with a hue shifted toward yellow. Moreover, the OF wines showed a higher level of total ATs, vanillin-reactive flavanols, and procyanidins. The different molecular weights of tannins strongly affect their sensory and health properties, depending on their degree of polymerization and specific chemical nature. It is known that the higher the level of procyanidins and vanillin-reactive flavanols, the greater the wine body and the perceived astringency and bitterness [50]. Therefore, the OF wines could be characterized by a full body with an astringent mouthfeel and bitter taste. On the other hand, the AV wines showed a light red color and low levels of polyphenols (ANs, procyanidins, vanillin-reactive flavanols, etc.); therefore, the AV grapes could be suitable for the production of light-bodied, brightly colored, fruity red wines, for early consumption [51].
In MC, AV grapes harvested 12 days after OF grapes attained very similar maturity, as also found in studies with table grape varieties under AV solar panels [52, 53]. However, our data had two important exceptions: higher must pH and higher malic acid concentration. While this latter can be easily connected to an increased amount of shade cast over the fruiting area during the day, higher pH under AV seems to concur with field investigations indicating that sunlight-exposed fruit had significantly lower juice pH than nonexposed fruit [54]. However, no variation in juice pH was found in a study with potted CS and Pinot noir grapevines (Vitis vinifera L.) grown in a sunlit phytotron and subjected to varying cluster light exposure during various stages of fruit development [55] feeding the hypothesis that, with regard to juice pH, foliage light exposure is more important than cluster light exposure and that the observed response is also genotype dependent. There is a paucity of data about light availability effects on grapes and wine pH in white cultivars; however, recent work conducted in Puglia (Italy) on Verdeca shows that full basal defoliation performed at bunch closure resulted in a wine pH of 3.89 versus 3.58 measured in wines made from the nondefoliated and more shaded vines [56]. Indeed, within the context of global warming, it is encouraging that, at the same TSS, AV can warrant higher malic acid at harvest.
Despite Malvasia grapes growing under panels being harvested 12 days later than OF and the still early picking avoiding the very heavy late seasonal rainfall (see very low fraction of cluster rot in both treatments), the volatile aromatic profile of the final wine can be deemed to be inferior to that emerging from the OF wine. Terpenes are the predominant grape volatile compounds conferring typical floral and citrus aroma to the MC wines due to their low perception threshold [57, 58]. In our study, 12 free terpenes were identified and quantified, and, among them, 2,6-dimethyl-3,7-octadiene-2,6-diol, linalool, α-terpineol; trans-linalool oxide (pyranoid); and citronellol, representing 41%–46%, 25%–31%, 7%–9%, 5%–8%, and 4%–7%, respectively, were all significantly lower in AV wines (Table 10). According to ample literature [59–63], increased shading of the fruiting zone easily leads to a lower accumulation of terpenes in grapes and, consequently, in wine [64, 65]. In addition, the main fermentative esters, including ethyl hexanoate, ethyl octanoate, isoamyl acetate, and phenylethyl acetate, were detected at higher concentrations in OF compared to AV wines. These compounds are characterized by fruity (i.e., apple, banana, pineapple, pear, strawberry) and floral (i.e., rose) notes due to their low perception threshold [66].
Another reason supporting overall less flavor perceived in MC wine from the AV treatment is that shading occurred starting at veraison and prolonged until harvest, according to data referred to Muscat Gordo Blanco [67] during the period of berry formation and through the lag phase, the concentration of free and most bound monoterpenes is low and fairly constant; starting at veraison, the concentration of several odor compounds, and especially linalool, starts to sharply increase, reaching a plateau at about a TSS of 24°Brix. It is, therefore, inherent that panels casting shade from the veraison onward have a high chance of altering the flavor profile of an aromatic variety.
It must also be pointed out that at harvest (103 days after flowering), bound monoterpene forms found in MC account for 88.45% of the total monoterpene pool. Among these, the two most abundant and characterizing bound forms are nerol and geraniol, while linalool is usually found in much lower concentrations. In our study, geraniol did not differ between treatments, and nerol was higher under AV. Although the free terpenes play an important role as primary contributors to the fruity and floral aromas, the glycosylated derivatives of terpenes can affect the wine aroma during its shelf-life due to their hydrolyzation into odor-active forms via acid hydrolysis, increasing its aroma’s complexity [68].
A final item of discussion is the compatibility of the AV frame and structure with ordinary vineyard management operations. While operations performed with an interrow tractor performing spraying, mechanical leaf removal, and soil management practices are not hindered, an issue exists with the length of the extra posts placed along the row, making, for instance, mechanical harvesting and shoot trimming unfeasible. This kind of serious limitation will probably attract the attention of AV constructors in the near future; some ideas have already been tested and, among them, the solution of vertical panels surmounting the row with no hindrance to any mechanical operations [21] is an excellent start.
5. Conclusions
A preliminary trial was carried out in 2024 to test the physiological and agronomical adaptation of CS and MC to the microclimate imposed by mounting, around veraison, a horizontally fixed AV shading structure compared to OF conditions. Despite a seasonal incoming light cut of about 47% versus the OF conditions, whole CO2 assimilation and transpiration per LA unit were slightly limited under AV (7%–9% less than OF). Canopy WUE was unaffected overall, although it tended to systematically decrease under heavy shade conditions. Regardless of variety, vines held under AV already showed some shade adaptation mechanisms, such as higher quantum yield, lower light saturation point, and improved gas exchange in afternoon measurements compared to OF.
Dynamic of technological maturity was significantly modified in the two varieties since AV harvest was performed in Malvasia and Cabernet, with 12- and 17-day delay versus OF, respectively. At respective harvest dates, malic acid was always higher under panels. In CS, phenolic maturity was never reached, mostly due to a wet and rainy late season, which favored rapid bunch rot colonization and induced a carbon limitation, which was detrimental, especially for total ATs accumulation.
Final AV wines of CS were lighter in color, structure, and body. In contrast, Malvasia wines obtained from AV plots were characterized by both lower levels of monoterpenes and fermentative esters, which might mean that this wine would provide less floral and fruity notes compared to the OF wines.
While the work highlights the promising potential of AV application in vineyards, more work under sun-tracking conditions and with more articulate differentiation as a function of specific phenological stages is needed.
Conflicts of Interest
One of the authors serves as Chief Editor of the Journal. To ensure transparency and integrity, we declare no involvement in the peer review and editorial evaluation of this manuscript. All other authors declare no conflicts of interest.
Funding
This study was funded by Regione Emilia-Romagna, 37462.
Acknowledgments
The authors are grateful to Marco Paterlini and Andrea D’Amico, from i-Pergola Company for having coordinated and supervised the setting of the agrivoltaics panels; the same gratitude goes to Stefano Santelli for careful vineyard maintenance and surveillance.
Supporting Information
Figure S1. View of a row section where size and positioning of the AV panels can be appreciated. In the front, plastic enclosures of three canopies are also shown.
Figure S2. Daily minimum, average, maximum air temperature (T), and rainfall recorded at the experimental site over the whole trial duration. Dotted arrow indicates date of solar panels positioning (DOY 207), whereas solid arrows indicate harvest dates for variety × vineyard cover combinations. CS = Cabernet Sauvignon; MC = Malvasia di Candia aromatica. OF = open field; AV = agrivoltaics panels. Base 10, cumulated growing degree days (°C) and rainfall (mm) registered between the two harvests of MC–OF and MC–AV and between the two harvests of CS–OF and CS–AV are reported nearby the arrows.
Figure S3. Seasonal patterns of NCER/LA for Cabernet Sauvignon (A) and Malvasia di Candia aromatica (B) grapevine measured under OF and AV conditions. Data in each panel were subjected to repeated-measures ANOVA which resulted to be nonsignificant either for main treatment or time × treatment interaction. Vertical bars represent standard errors (SE) around the means (n = 3).
Figure S4. Seasonal patterns of T/LA for Cabernet Sauvignon (A) and Malvasia di Candia aromatica (B) grapevine measured under OF and AV conditions. Data in each panel were subjected to repeated-measures ANOVA which resulted to be nonsignificant either for main treatment or time × treatment interaction. Vertical bars represent standard errors (SE) around the means (n = 3).
Figure S5. Seasonal patterns of canopy WUE (NCER/T) for Cabernet Sauvignon (A) and Malvasia di Candia aromatica (B) grapevine measured under OF and AV conditions. Data in each panel were subjected to repeated-measures ANOVA which resulted to be nonsignificant either for main treatment or time × treatment interaction. Vertical bars represent standard errors (SE) around the means (n = 3).
Open Research
Data Availability Statement
The data that support the findings of this study are available from the corresponding author upon reasonable request.


