Brewer’s Spent Grains as Alternative Ligno-Cellulosic Filler for the Preparation of Bio-Based Polymer Composites
Abstract
Brewer’s spent grains (BSGs) are lignocellulosic sources that can be considered promising economic alternatives to wood as biofillers to produce wood–plastic composites (WPCs). Given the high protein content (25 wt.%) of BSGs, alkaline hydrolytic solid–liquid (S/L) extractions were carried out at different pHs, with the goal of extracting as much protein as possible without altering or compromising the quality of the lignocellulosic matrix. Biocomposites with 10–50 wt.% biofiller were produced by blending polybutylene succinate (PBS) and poly(hydroxybutyrate-co-hydroxyhexanoate) (PHBH) with native BSG (BSG), BSG treated at pH 10.5 (BSG-S2_T2) and BSG treated at pH 12 (BSG-S2_T3). The injection-molded compounds were characterized in terms of structural, rheological, mechanical, morphological, and thermal properties to investigate the potential impact of different biofillers on the overall compatibility of the two different biopolymer matrices as an alternative to conventional wood flour-based WPCs. Fourier transform infrared (FT-IR) spectra, thermal (differential scanning calorimetry [DSC]), and morphological (scanning electron microscope [SEM]) analyses revealed only minor interactions. The melt flow rate (MFR) analyses showed the increased viscosity in PBS-based biocomposites when the filler concentration increased. In contrast, for PHBH-based composites, an increase in MFR values was obtained under the same test conditions, with a maximum peak of 97% for S2_T3 30 wt.% filler. From a mechanical point of view, the addition of reinforcing fibers led to a more significant increase in Young’s modulus (E) in PBS-based composites as the biofiller content increased, up to 98%, compared to pure PBS. On the contrary, in PHBH-based composites, the addition of fillers led to a significantly lower increase, with values between 14% and 20% compared to pure PHBH. The tensile strength (σB) and elongation at break (εB) decreased proportionally in the two biopolymer matrices as the percentage of natural filler increased, with properties similar to traditional WPCs. These results are consistent with the literature and support the application of PBS and PHBH biocomposites filled with BSG as an environmentally friendly alternative to conventional plastics.
1. Introduction
One of the most critical problems that Europe and the rest of the world have been facing in recent years has been the serious environmental contamination caused by the misuse of plastic materials composed of polymers derived from fossil fuels, generally known as conventional plastics [1].
Therefore, governments, companies, and scientists are working to develop sustainable bio-based, biodegradable, or compostable polymers in response to the growing interest in substituting traditional polymers and preventing the buildup of plastic material in the environment [2, 3].
To reduce manufacturing costs and enhance the performance of the final product, one strategy is to create biocomposites utilizing agri-food waste as biofillers [4, 5].
Wood–plastic composites (WPCs) are among the most well-known and intriguing eco-efficient composite materials available today [6], made of 30–70 wt.% plant fibers [7]—wood or any other lignocellulosic agri-food industry byproduct—mixed with a polymer matrix, which can be thermoset or thermoplastic, to create a finished product that resembles real wood [8, 9]. The use of WPC and its market is expanding in the twenty-first century in a variety of industries, including automotive, packaging, outdoor furniture, flooring, cladding, fence, gardening, decking, and more [10–12]. For example, the main wood-based product categories have witnessed a surge in global production volumes, with wood pulp exhibiting a 13% increase and wood-based panels a 207% surge between 2000 and 2018 [13]. Numerous variables affect the properties and quality of WPCs, including the kind of matrix, the filler’s nature (particle size and shape), how the filler interacts with the polymer matrix, and the processing techniques used. Despite the projected market growth for wood-derived products, raw materials are at the same time becoming increasingly expensive, and it is predicted that by 2030, there will not be enough wood from sustainably managed forests to meet demand [14].
Plant fibers that do not come from wood can be used as a more affordable substitute for wood, to satisfy the increasing demand in the marketplace, and to be more eco-friendly (e.g., reducing issues with deforestation). Because of their comparatively high strength and stiffness, cheap cost, low density, low CO2 emission, biodegradability, and yearly renewability, they are often suited for reinforcing the polymer matrix [15, 16].
Brewer’s spent grain (BSG) is one agri-food waste that is particularly attractive to employ as a lignocellulosic filler in the creation of WPC biocomposites. BSG is a low-value solid byproduct of the brewing industry that is obtained after mashing and malting of wort and its subsequent filtration [17, 18]. It is one of the most generated byproducts of brewing, making up roughly 80–85 wt.% of the total waste. About 6.2 kg of BSG is generated for every hectoliter of beer produced [19, 20]. The Brewers of Europe study from 2018 states that over 41 billion liters of beer are produced annually by European brewers, and this number is expected to rise [21]. More than 2.5 million tons of BSG are reportedly produced for beer manufacturing in Europe alone [22].
Given its high nutritional content, the BSG byproduct is currently mostly used in food or feed applications or cosmetics [23–26]. Additionally, it is used for environmentally friendly purposes, like the synthesis of organic acids and enzymes [27–29], biogas, bioethanol, bioenergy [30–32], or even as a substrate for the synthesis of biopolymers like polyhydroxyalkanoates (PHAs) since it contains fatty acids [33].
At present, the most well-known thermoplastics for making WPC are polyolefins [34–37]. Unfortunately, such composites are not biodegradable and are also challenging to recycle using existing traditional methods. Considering a more sustainable society and increased awareness of the finite nature of petrochemical resources, there is a growing push to substitute petroleum-based polymers for bio-based, biodegradable, or compostable plastics in composite applications. For example, some polyesters, including PHAs and polybutylene succinate (PBS), are promising biopolymers with potential applications as polymer matrices in WPC.
PHAs are a class of semi-crystalline, aliphatic thermoplastic bio-polyesters that are produced by a wide range of microorganisms intracellularly by bacterial fermentation [38]. The thermoplastic copolymer known as poly(hydroxybutyrate-co-hydroxyhexanoate) (PHBH) is created by adding 3-hydroxyhexanoate (3-HH) units to medium-length side groups, made by 3-hydroxybutyrate (3-HB). The percentage of 3-HH units present in the primary monomer (3-HB) determines the relative features and attributes of PHBH copolymers.
PBS is a thermoplastic, biodegradable biopolymer with excellent mechanical properties, a high degree of flexibility, and a broad processing window when compared to the PHBH biopolymer. As such, it may be processed using a variety of traditional methods, including extrusion, injection molding, film blowing, and thermoforming [39]. PBS is synthesized by a polycondensation process involving succinic acid (or its dimethyl succinate ester) and 1,4-butanediol (BDO). Both monomers can be of fossil or renewable origin, depending on the source used for their production [40].
Unfortunately, because these bioplastics are still relatively new to the market, their manufacturing costs are three to five times greater than those of conventional plastics, making them less profitable to produce on an industrial scale [41–43]. Therefore, blending biopolymers with different natural fillers derived from agri-food waste can be a starting point for solving some issues, such as high cost and poor properties [44–47].
There are several studies focused on the use of different types of lignocellulosic fibers as natural fillers within polymeric matrices [48–50]. For this reason, the objective of this study was to produce environmentally sustainable composite materials, using PBS and PHBH as biobased and biodegradable, to replace traditional polymers that represent a source of pollution both for their development and disposal [51]. To counter the high production cost and to be able to modulate their properties in a wider range of sectors, such as WPC [38, 52], the biopolymers were mixed with a lignocellulosic biofiller derived from brewing byproducts (BSG). [22, 53–55] In the materials sector, the use of polymers characterized by high biodegradability, low toxicity, and ecotoxicity, associated with the use of agri-food waste as biofillers, represents an essential strategic advancement in orienting the industry toward more sustainable and circular production models. At the same time, given the high protein content, the potential impact of the BSG biofiller components on PBS and PHBH has been studied. An ad hoc method was developed, with the possibility of industrial-scale reproduction, both for the chemical treatment procedure of the BSG useful for the removal of the protein content and for the processing of the composite mixtures with the extrusion and injection molding approaches. Furthermore, the potential of the BSG filler as a possible biofiller in composite materials was compared with results in the literature regarding WPCs containing both traditional polymers and biopolymers, as well as different types of lignocellulosic biomass [56–58]. Overall, the properties compared fall within similar ranges, demonstrating the relevance of using BSG for such composites [59, 60].
The present work aims to investigate the potential impact of BSG biofiller components on PBS and PHBH as biobased polymer matrices and discusses whether these biocomposite materials, PBS/BSG and PHBH/BSG, could be a viable alternative to traditional WPC made from wood flour. We, therefore, carried out treatments to deproteinize the BSG biofiller and produced and comprehensively characterized composites with different weight concentrations of BSG (10, 20, 30, and 50 wt.%) for each biocomposite family via compounding and injection molding.
2. Materials and Methods/Experimental
2.1. Materials
PBS was supplied by MCC Biochem (Düsseldorf, Germany) under the trade name “BioPBS FZ91PB” (Tm = 115°C, ρ = 1.26 g cm−3). The PHA used is a PHBH with a 3-HH content of 6 mol%, supplied by Gruppo Maip SRL (Turin, Italy), with the trade name “I am Nature B6 A13” (Tm = 145°C, ρ = 1.20 g cm−3). BSG was supplied by the brewery Gräfliches Hofbrauhaus Freising GmbH (Freising, Germany). It was a solid byproduct of the mashing process in the brewing of lager and weiss beer. The supplied BSG consisted of a mixture of spent wheat malt and barley malt and its husks. Native BSG was provided by the brewery in large quantities (25 kg) in the wet state. From the starting whole batch, a portion of 300 g was dried for the compositional analysis (the chemical characterization in Section 2.2), and the remaining wet BSG biomass was stored in polypropylene bags and frozen at −20°C until the chemical pretreatment (the treatment in Section 2.3), to prevent natural fermentation processes.
2.2. Chemical Characterization of BSG
The dry matter of BSG was measured gravimetrically by moisture meter MA 100 (Sartorius AG, Germany) and expressed as a percentage of the total biomass. The BSG necessary for analytical purposes was dried at a temperature not exceeding 60°C in the Heraeus Type 6060 convection air drying cabinet (Thermo Fischer Scientific, USA) until the dry matter was at least 90 wt.%. The drying temperature was correspondingly selected to favor a fast enough drying process without thermally altering the biomass components in BSG and without favoring fermentation processes. The dried BSG was milled for sample homogenization and particle reduction by means of a small-scale Braun MultiQuick 9 Type HB901AI knife mill (De Longhi Braun Household GmbH, Germany). Milled BSG was further screened by means of a stainless-steel sieve with a mesh pore size of 2 mm (Retsch GmbH, Germany). Particles larger than 2 mm were milled and screened once more.
The chemical composition of BSG was characterized gravimetrically and measured in terms of water extractives, ethanol extractives, soluble proteins, insoluble proteins, soluble ashes, insoluble ashes, lignin, and holocellulose. A detailed description of the methods used for the characterization can be found in the National Renewable Energy Laboratory’s Biomass Compositional Analysis Laboratory Procedures [61]. Protein content was estimated by measuring the total Kjeldahl nitrogen content by the Kjeldahl method and using a standard conversion factor of 6.25 for food and feed. This factor is based on the assumption that proteins consistently contain 16% nitrogen and that all nitrogen is from proteins [62]. The same methods were used to analyze the composition of the chemically treated BSG. Measurements were performed in duplicate, and results were expressed as an average thereof.
2.3. Treatment of BSG
2.3.1. Chemical Treatment
During pretreatment, the focus was to develop a process that could extract as many proteinaceous matters as possible without altering or affecting the quality of the lignocellulosic matrix (cellulose + hemicellulose + lignin) of interest for the compounds. Any eventual further use of the extracted proteins was out of scope in the project and this work.
Protein extractions were carried out as single trials in a 300 L stainless steel vessel, equipped with a spiral stirrer, pH-meter, double jacket with heating and cooling circuit for temperature control, weight load cells, and standard lauter tun false bottom with sieve plate for S/L separation and removal of filter cake. The tested process parameters were pH, extraction time, and type of S/L separation. Tested parameters are reported in Table 1. The effect of extraction time on protein extraction was assessed by taking aliquots of BSG from the extraction medium at selected time intervals. Extractions were performed at room temperature to favor selective protein extraction and reduce the loss of lignocellulosic fibrous components of interest. About 10 kg of wet BSGs were added to the extraction system per trial, and the S/L ratio was set to 1:9 by pumping osmose water into the vessel. BSGs were directly frozen when supplied from the brewery and thawed overnight before each trial. BSGs were added to the vessel without previous pretreatment. pH was set by the addition of 10 wt.% NaOH aqueous solution (Carl Roth GmbH & Co. KG, Germany) to the desired value.
| Process parameter | Parameter level | |||
|---|---|---|---|---|
| Low | Medium | High | ||
| pH | 9.0 | 10.5 | 12.0 | |
| Extraction time (min) | 30 | 60 | 120 | |
| Solid–liquid separation (lautering) | Conventional (static filtration) | Alternative (dynamic filtration) | ||
After extraction and sedimentation of BSG, one S/L separation consisted of a conventional lautering process, by letting the emerging BSG filter cake controlling the filtration of the liquid. The other separation consisted of an unconventional lautering process, by gently breaking the BSG filter cake under slow constant rotation of the spiral stirrer and by continuously spray-washing it with osmose water to avoid the retention in the filter cake of finer particles such as protein hydrolysates.
After S/L separation, filter cakes were redispersed in osmose water (same S/L ratio as for the extraction). After sedimentation of the treated BSG, the S/L separation was repeated, according to the set type. BSG filter cakes were collected from the sieve plate of the lauter tun false bottom, dried in a convection furnace at 60°C until the dry matter was at least 90%, and stored at 14°C in closed HDPE containers until further use.
2.3.2. Mechanical Pretreatment
The following byproducts were selected for making the composite materials: native BSG and its derivatives by the extraction process at pH 10.5 and 12 and separated from the extraction medium by the alternative sedimentation process, named BSG-S2_T2 and BSG-S2_T3, respectively. Subsequently, all selected BSG fillers were ground in a discontinuous centrifugal mill ZM200 (Retsch GmbH, Germany), to which a 0.25 mm filter and a speed of 14,000 rpm were applied. For the fillers BSG-S2_T2 and BSG-S2_T3, the grinding procedure was repeated by applying a 0.12 mm filter for particles larger than 0.25 mm. The purpose of this procedure was to have a comparable particle size distribution. This procedure optimizes the increase in affinity with the polymer matrix by maximizing the contact surface area.
2.4. Preparation/Manufacturing of Polymer Composites
The pellets of the two polymers (PBS and PHBH) and the filler powders (BSG, BSG-S2_T2, and BSG-S2_T3) were dried separately at 60°C in an oven overnight to remove any absorbed moisture. Extrusion was performed with a ZK 27Tx24 D twin-screw corotating extruder with an L/D ratio of 30 and a screw diameter of 25 mm (Dr. Collin GmbH, Ebersberg, Germany). The optimized extrusion parameters for PBS and PHBH-based composites are shown in Table 2. Two different temperature profiles were used due to the different melt temperatures and viscosities of the two polymers. Two single-screw gravimetric feeders were used to feed the twin-screw extruder. A screw speed of 150 rpm was used for all PBS and PHBH composites. The extruded material was cooled in a water bath and then pelletized. The formulations developed in this study are shown and named in Table S1.
| Matrix | Condition | Hopper | Zone 1 | Zone 2 | Zone 3 | Zone 4 (degassing) | Zone 5 | Zone 6 (adapter) | Die |
|---|---|---|---|---|---|---|---|---|---|
| PBS | T (°C) | 25 | 115 | 120 | 145 | 135 | 130 | 115 | 115 |
| p (mbar) | — | — | — | — | 100 | — | — | — | |
| PHBH | T (°C) | 25 | 135 | 140 | 142 | 145 | 150 | 145 | 140 |
| p (mbar) | — | — | — | — | 100 | — | — | — | |
The pellets obtained were dried in an oven at 60°C for overnight before the injection molding process. This was carried out in a Babyplast 10/12 injection molding machine (Rambaldi+Co IT Srl, Italy) to obtain standard type 5A samples in accordance with UNI EN ISO527-2 for characterization analysis [63].
For all PBS-based formulations, the samples were produced at a temperature of 140 ± 5°C, which varied according to the material processed. For the PBS polymer, the lowest temperatures were used (T1 = 135°C, T2 = 135°C, T3 = 145°C), while the presence of the BSG fillers made the material less fluid in the preinjection buildup phase, so production was conducted by slightly varying pressures and increasing temperatures. The exact same conditions were used for the same concentrations of the three different filler types. A detailed representation of the temperatures used can be found in Table 3, while other parameters relating to material charge, pressures, injection times, and speeds are shown in Table S2.
| Composition | T1 (°C) | T2 (°C) | T3 (°C) |
|---|---|---|---|
| PBS | 135 | 135 | 145 |
| PBS90 | 140 | 140 | 140 |
| PBS80 | 140 | 140 | 140 |
| PBS70 | 145 | 145 | 145 |
| PBS50 | 145 | 145 | 145 |
For all PHBH-based formulations, samples were produced at a temperature of 143 ± 13°C, which varied according to the processed material. For the PHBH polymer, the highest temperatures were used (T1 = 156°C, T2 = 155°C, T3 = 154°C), while the presence of the BSG fillers made the material more fluid in the preinjection buildup phase, so production was conducted by slightly varying the pressures and lowering the temperatures. The exact same conditions were used for the same concentrations of the three different filler types. A detailed representation of the temperatures used can be found in Table 4, while other parameters relating to material charge, pressures, injection times, and speeds are shown in Table S3.
| Composition | T1 (°C) | T2 (°C) | T3 (°C) |
|---|---|---|---|
| PHBH | 156 | 155 | 154 |
| PHBH90 | 146 | 141 | 139 |
| PHBH80 | 145 | 140 | 132 |
| PHBH70 | 145 | 138 | 130 |
| PHBH50 | 145 | 138 | 130 |
2.5. Characterization Techniques
2.5.1. Granulometry
The characterization of the particle size distribution of the three different fillers (BSG, BSG-S2_T2, and BSG-S2_T3) was evaluated using a Mastersizer 3000 laser diffraction particle size analyzer with a dry powder dispersion unit Aero S by Malvern Panalytical (Kassel, Germany). Particle size distribution was calculated based on Mie theory with the Software Mastersizer v3.88. The Refractive Index (RI) was set to 1.59, which is in between lignin (RI ≈ 1.61) and cellulosic components (RI ≈ 1.53 based on cellulose and hemicellulose) and proteins (RI ≈ 1.6) [64–66].
2.5.2. Fourier Transform Infrared (FT-IR) Spectroscopy
The chemical structure of the samples, as well as the fillers and the evaluation of a possible interaction between the fillers and polymer matrices, were determined using FT-IR spectroscopy analysis performed by an FT-IR Spectrum Two with Spectrum IR software, version 10, both supplied by Perkin Elmer (Shelton, CT, USA). Measurements were made on an ATR module (attenuated total reflection) equipped with a diamond crystal. The spectra of each sample were obtained in a wavelength number range of 4.000–600 cm−1 with a resolution of 2 cm−1 and 16 scans. Before analysis, the measured samples were conditioned in an oven at 60°C under vacuum overnight. Measurements were performed at room temperature and atmospheric pressure. The spectra of the composites were normalized to the peak at 1.388 cm–1 for PBS-based composites and 1.378 cm−1 for PHBH-based composites.
2.5.3. Melt Flow Rate (MFR)
The MFR of the materials tested was determined using the MeltFloW@on plastometer (Karg Industrietechnik, Krailing, Germany) equipped with two thermal resistors that heat a die/capillary. This test was carried out at 165°C with a weight of 5 kg, measuring the amount of material melted and discharged in 10 min, according to ISO 1133 [67].
2.5.4. Gel Permeation Chromatography (GPC)
Average molecular weight (Mw) measurements using GPC were performed using a Dionex system, utilizing a solvent combination of 1,1,1,3,3,3-hexafluoro-2-isopropanol (HFIP) and trifluoroacetic acid (0.02 mol L−1). Sampling was conducted using a DIONEX Ultimate 3000 injector, functioning at a steady flow rate of 1 mL min−1, using a Gynkotek M480 gradient HPLC pump. The detection was conducted with a Gynkotek SE-61 RI detector. Analysis utilized PSS-PFG columns (7 μm, 300 × 8 mm), regulated at a constant temperature of 40°C (PSS, Mainz, Germany). Samples were generated by dissolving 5000 µg/mL of material in HFIP and subsequently filtered through a polytetrafluoroethylene (PTFE) membrane having a porosity of 0.20 µm. A volume of 100 μL was injected for each analysis. Calibration was conducted utilizing a polyethylene terephthalate (PET) standard characterized by a limited molecular weight distribution (PSS Mainz, Germany). The acquired curves were examined using WinGPCUniChrom software (Version 8.1, PSS, Mainz, Germany). Mean values of weighted Mw were documented for all samples. Shown standard deviations of 5% refer to the sensitivity of the instrument. For relative values, the accuracy <5 %, common for Mw, can be assigned [68].
2.5.5. Mechanical Tests
Tensile tests were performed on 5A specimens (according to ISO527-2) using the TesT dynamometer (Model 112, TesT GmbH Universal Testing Machine, Germany) equipped with a 2 kN load cell. The specimens were clamped at both ends and subjected to a constant tensile speed of 10 mm/min until failure. Eight replications were tested for each specimen, and the tests were conducted at room temperature and pressure. From the stress–strain curves, the values of Young’s modulus (E), stress at break (σB), and elongation at break (εB) were calculated; the data shown are the average of the replicates. Prior to testing, the samples were conditioned in an oven at 60°C overnight hours to remove any absorbed moisture. Because the assumptions for a linear model were not met, a nonparametric Kruskall–Walis test was used to identify differences between the sample series of different fillers. To identify differences between the means of each sample, a post-hoc test (Dunn’s test) was performed at a significant level of 0.05.
2.5.6. Scanning Electron Microscope (SEM)
The surface morphology and interfacial compatibility of composite materials were observed with an SEM. For the injection molded samples, cross-sections were prepared using a JEOL IB-19530CP Cross Section Polisher with an Argon beam, sputtered with gold, and examined with a JEOL 7200F SEM with a Lower Electron Detector (Jeol, Freising, Germany). Images were taken at a working distance of 4.0 mm and an accelerating voltage of 1.50 kV.
2.5.7. Differential Scanning Calorimetry (DSC)
The thermal properties of PBS- and PHBH-based materials were evaluated using DSC. Measurements were performed with DSC Q100 instruments from TA Instruments (New Castle, DE, USA) calibrated with indium and mercury, and the thermograms were processed using the Universal Analysis Software 3.9 (TA Instruments, New Castle, DE). For the thermal study of the pure PBS and PBS formulations, an analysis of three dynamic temperature cycles was programmed. Each sample was heated from −60 to 150°C (1st cycle), then cooled from 150 to −60°C and kept isothermal for 5 min. This step was planned to remove the thermal history. Subsequently, the sample was reheated to 150°C. The same was done for the pure PHBH and PHBH formulations, reaching a temperature of 180°C due to the higher melting temperature compared to the PBS polymer. All thermal analyses were conducted at a heating/cooling rate of 10 K min−1 in a nitrogen atmosphere (50 mL min−1) using an average sample weight of around 10 mg, placed in aluminum crucibles. The melting temperature (Tm) and glass transition temperature (Tg) were determined in the second heating cycle. The crystallization temperature (Tc) was determined from the cooling cycle.
3. Results and Discussions
3.1. Characterization of BSG
BSG showed a dry matter of 20.47 wt.%, as no drying process is performed in the brewery after the separation of BSG in the lautering tun from the fermentable sugary wort. The remaining 79.53% is water and, eventually, other minor volatile components that can evaporate at 105°C, the temperature at which the gravimetrical measurement of moisture content takes place. The identification of these molecules is, however, not possible with the use of the standardized method, and its contribution to the total moisture content is expected to be negligible. That also confirms the importance of a preservation strategy to prevent or slow down the microbial decomposition of biomass. The following BSG components refer all to fractions of the dry matter of the analyzed BSG biomass. In terms of relative abundance, holocellulose constituted the predominant fraction of BSG, representing 47.64 wt.%. Proteins constituted the second most abundant component, accounting for 25.22 wt.%. These findings align with the values reported in the existing literature [17, 69]. Overall, 79.42% of present proteins (20.03 wt.% of total dry matter) were soluble neither in water nor in ethanol, which also confirms that the mashing during the brewing process denatures the majority of grain malt proteins. The mashing process occurs at temperatures up to 78°C, depending on the style of the beer, and at such temperatures, barley and wheat proteins may already lose part of their functionalities [70, 71]. The remaining 20.58% of BSG proteins (5.19 wt.% of total dry matter) were found in the water and ethanol extractives, which accounted altogether for 23.88 wt.% of BSG. Water extractives accounted for 12.83 wt.% of total dry matter and, other than water-soluble proteins (e.g., residual barley albumins and globulins) [70], they could contain residual starch traces, residual sugars (e.g., β-glucans) and partly auto-hydrolyzed hemicellulose [72, 73]. Ethanol extractives accounted for 11.05 wt.% of total dry matter and, other than ethanol-soluble proteins (e.g., residual barley hordein fractions) [70], they could contain lipids and polyphenolic compounds [17, 69, 74, 75]. Lignin was a minor component in the supplied BSG, accounting for 6.92 wt.% of total dry matter. Ashes represented the inorganic BSG components (e.g., salts and minerals) as well as the smallest compositional fraction with 3.13 wt.% of total dry matter. Overall, 51.11% thereof (1.60 wt.% of total dry matter) consisted of soluble ashes. The average values of the chemical composition of supplied BSG are reported in Table 5.
| Filler | Holocellulose | Total proteins | Soluble extractives | Ashes insoluble | Lignin | |
|---|---|---|---|---|---|---|
| H2O | EtOH | |||||
| BSG | 47.64 | 25.22 | 12.83 | 11.05 | 1.53 | 6.92 |
| S2_T2 | 50.10 | 15.31 | 7.02 | 8.90 | 1.45 | 17.22 |
| S2_T3 | 50.59 | 14.02 | 8.99 | 7.13 | 1.33 | 17.94 |
3.2. Chemical Treatment
Due to the lack of visible trends in protein reduction at various extraction times by aliquot sampling, the data reported refers only to the complete extractions (i.e., 120 min). Figure 1 shows the absolute protein content on dry matter in the treated BSG samples, which were subjected to extraction processes at different pH values and separated from the extraction medium with different filtration (i.e., lautering) techniques. The protein content of the treated BSG ranged from 20.88 wt.% with the mildest alkalinity and conventional lautering to 14.02 wt.% with the strongest alkalinity and the alternative lautering, with a corresponding reduction in protein content with respect to the untreated BSG ranging from 17.86 to 46.93%, respectively. Protein extraction processes were overall successful, since protein content in every resulting treated BSG was significantly lower than the protein content in the corresponding starting BSG. Two clear trends were observed. First, the higher the pH value, the lower the absolute protein content on dry matter in the treated BSG, independently of the lautering type. Second, the alternative lautering performed better than the conventional one in separating the extracted proteins from the residual BSG filter cake, independently of the pH value.
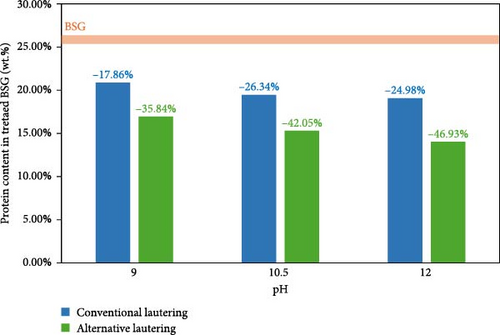
Process efficiency in terms of protein extraction yield is shown in Figure S1: this value indicates how much of the available proteins present in the starting BSG are not measured in the treated BSG dry mass, and therefore, they were extracted.
Yields ranged from 52.40% with medium alkalinity and conventional lautering to 79.84% with the strongest alkalinity and alternative lautering. In this case, a clear trend of increasing yield at increasing pH value is to be observed only with the alternative lautering. The conventional lautering could not separate the hydrolyzed proteins from the BSG filter cake as efficiently as the alternative one, thus reducing the extraction yield independently of the alkalinity strength of the extractive medium. A qualitative proof thereof was the formation of a gelatinous deposit on top of the BSG filter cake with the conventional lautering at pH 10.5, as reported in the supporting information (Figure S2). A quantitative proof was the measured 36.50 wt.% protein content in the deposit, which was higher than the protein content of the corresponding starting BSG. The more efficient alternative lautering displayed yields that were 19.54%–30.46% higher than the conventional one.
Upon the selection criteria of lowest protein content on dry matter and highest protein extraction yield, treated BSG batches from extraction at pH 10.5 and at pH 12 with the alternative lautering were selected for the further material development and coded as S2_T2 and S2_T3, respectively. Their chemical composition is reported in Table 5. It is important to note that the protein content was significantly reduced, while the relative holocellulose content was mostly unaltered with respect to the characterized BSG as received from the brewery. The relative lignin content increased because overall biomass was reduced during the extraction process, while lignin was not extracted. This was assumed as an indication that the fibrous lignocellulosic component of the untreated BSG was qualitatively preserved in the treated BSG as well.
3.3. Particle Size Analysis
It is well known that the size of the filler imposes a significant influence on its dispersibility in the polymer matrix and on the final properties of the composite material. From this point of view, smaller particles are known to exhibit higher surface areas, leading to potentially improved mechanical performance of composite materials [76]. The particle size distributions of different BSG fillers are shown in Figure S3 and report a broad fiber size distribution. Bimodal curves with a volumetric mean diameter, Dmean, around 110 µm were obtained for all three types of fillers (Table 6). The presence of fibers with an effective size larger than the sieve size probably results from a shape ratio greater than one, as some fibers have a diameter of less than 250 μm and a length greater than the diameter, allowing them to pass through the mill sieve holes.
| Sample name | Dx (10) (µm) | Dx (50) (µm) | Dx (90) (µm) | Dmean (µm) |
|---|---|---|---|---|
| BSG | 9.8 ± 0.2 | 76 ± 2 | 246 ± 21 | 105 ± 7 |
| BSG-S2_T2 | 8.4 ± 0.1 | 76 ± 1 | 238 ± 3 | 102 ± 1 |
| BSG-S2_T3 | 9.9 ± 0.1 | 91 ± 1 | 261 ± 2 | 115 ± 1 |
3.4. Structural Characterization of Fillers
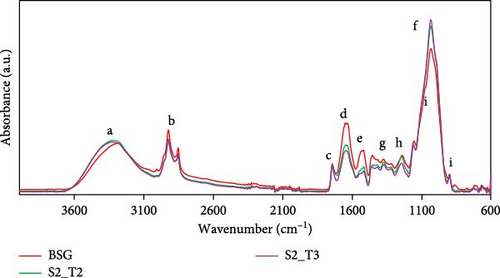
Figure 2 shows the full FT-IR spectra of BSG, BSG-S2_T2, and BSG-S2_T3 fillers obtained after milling, displaying typical signals of lignocellulosic materials. However, they differ in signal intensity regarding certain bands. All spectra show the broad peak around 3000–3680 cm−1 (a), associated with stretching vibrations of hydroxyl groups (─OH) present in the structure of holocellulose, lignin, and starch [77, 78]. The absorption bands in the range 2830–2990 cm−1 (b) can be attributed to the symmetric and asymmetric stretching of the C─H bonds of methyl and methylene groups [79–81]. The peak around 1730 cm−1 (c) is typical of the C═O group in the lignocellulosic system [54]. The two bands at 1634 (d) and 1518 cm−1 (e) can be associated with the asymmetric and symmetric bending of the proteic N─H group and the stretching vibrations of aromatics C═C bonds in the lignin structures [82–84]. It can be seen that the band decreases in intensity in the two fillers BSG-S2_T2 and BSG-S2_T3 compared to the untreated BSG due to the protein extraction process. Notably, the band around 1030 cm−1 (f) corresponds to the C─OH functional group of the cell wall polysaccharides, and it can be seen that its intensity increases in the two treated fillers, as cellulose is present to a greater extent after protein extraction and therefore more easily detected [85, 86]. More weak signals observed at 1300–1470 cm−1 (g) are related to the bending vibrations of the C─H hydrocarbon chain [54]. The band corresponding to the 1190–1280 cm−1 (h) area is characteristic of the C─O stretching of the acetyl groups related to hemicellulose [87]. Finally, the signal at about 890 cm−1 (i) is related to C─O─C extension characteristic of cellulose in the fiber [86].
3.5. Structural Characterization of PBS- and PHBH-Based Composites
FT-IR analysis was employed to examine the chemical composition and structure of the biopolymer matrices, as well as to identify potential interactions between the filler and the polymer matrix. The results of the spectra are presented in Figure 3. Specifically, Figure 3a shows, from top to bottom, the FT-IR spectra for the BSG, the PBS50BSG50 composite, and the pure PBS used as a reference. Similarly, Figure 3b shows the spectra of the PHBH50BSG50 composite containing the BSG filler and the pure PHBH polymer. Finally, Figure 3c,d shows an enlargement of the zone between 2820 and 3020 cm−1, highlighting changes in the IR spectrum of the polymer matrix due to the presence of the filler. Additional FT-IR spectra of the PBS and PHBH composites containing the fillers treated at different pH values are shown in the support material in Figure S4.

As for the pure PBS polymer (Figure 3a), the spectrum shows an area between 2830 and 3000 cm−1 related to the symmetric and asymmetric stretching of the C─H bond. The intense band at 1713 cm−1 characterizes the stretching vibration of the carbonyl C═O attributed to the ester group. In addition, the peak at 1147 cm−1 was assigned to the stretching vibration of the C─C(═O)─O bond. Finally, for the structure of PBS alone, the signal at 1030 cm−1 is assigned to the O─C─C stretching vibration of the esters [87].
Concerning the pure PHBH polymer, the corresponding FT-IR spectrum exhibits the majority of the typical signals observed in the PBS biopolymer, with slight differences in wavenumber (cm−1) due to the similarity of the two polyester structures. This can be observed in the signals between 2840 and 3000 cm−1 [88] and 1720 cm−1 [89, 90]. Signals at 1453 cm−1 and 1379 cm−1 correspond to the bending of the C─H bond in the ─CH2 and ─CH3 groups, respectively. Furthermore, the peak at 1125 cm−1 was assigned to the stretching vibration of C─C(═O)─O group [91]. In conclusion, the signal observed at 1042 cm−1 is attributed to the symmetric stretching vibration of the O─C─C bond in esters [88].
Overall, the FT-IR spectra of the composites containing 50 wt.% filler exhibited similarities to those of the pure polymer, irrespective of the type and content of filler utilized. However, the composites exhibited differences in signal intensity when compared to the pure polymer matrices. This phenomenon may be attributed to the presence of analogous chemical bonds in the composite components.
In all figures, a signal associated with the stretching vibrations of the -OH groups present in the structure of cellulose, hemicellulose, lignin, and starch can be observed in the range of 3160–3500 cm−1. When considering the spectrum of PBS50BSG50, In the range between 2800 and 3000 cm−1, two more intense peaks are observed around 2924 and 2856 cm−1, indicating the presence of the filler in the spectroscopic response of the composite (Figure 3c). Similarly, peaks were observed in the PHBH50BSG50 composite (Figure 3d) and in the remaining composites containing the various types of fillers. The signal inherent in the C═O group of PBS and PHBH, at about 1713 and 1720 cm−1, respectively, exhibited no shift when the polymer was combined with the different fillers. However, a significant overlap of the signal due to the BSG and biopolymer between 1400 and 800 cm−1 was observed. Similar to the study by Zeng et al. [92] and Hejna [93], no spectroscopic changes in PHBH were observed, indicating that the addition of filler does not affect the chemical structure of the polymer matrix. Ultimately, the composite materials display the emergence of signals at 1651 and 1572 cm−1, which are indicative of the filler signals (Section 3.3).
3.6. MFR Analysis and GPC of PBS- and PHBH-Based Composites
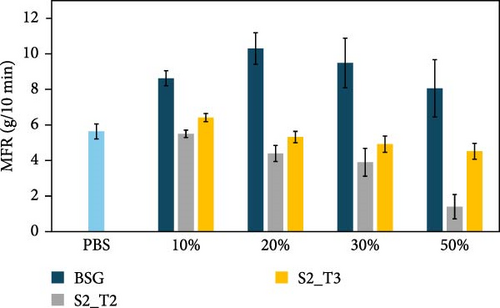
The effect of the type of filler and its content, as well as the resulting effect on the extrusion process used for compounding, were evaluated by performing MFR and GPC analysis of the prepared biocomposites, and the results are presented in Figure 4. Specifically, Figure 4a shows the MFR and GPC results inherent in the PBS-based composites, while Figure 4b shows the same results inherent in the PHBH-based composites. These values were found to be useful in evaluating the processability of the pellets for the injection molding process. MFR values showed that different types of fillers have a distinct influence on biopolymer matrices. In particular, a reduction in fluidity was observed for all PBS-based compositions tested (Figure 4a). In more detail, biocomposites containing the S2_T2 and S2_T3 treated fillers showed a decrease in MFR of 81% and 54%, respectively, for compositions with 50 wt.% filler. Similarly, biocomposites containing BSG showed only a 40% reduction in MFR compared to the reference biopolymer matrix, PBS. In contrast, for the PHBH-based biocomposites (Figure 4b), the MFR values show a slight upward trend, which is more evident for the S2_T3 filler at 30 and 50 wt.%.
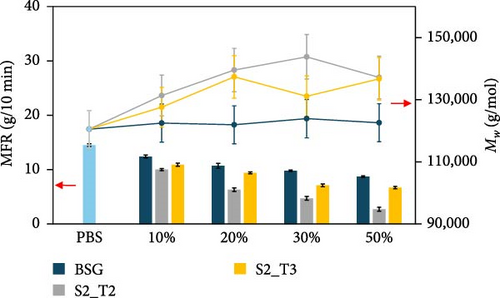
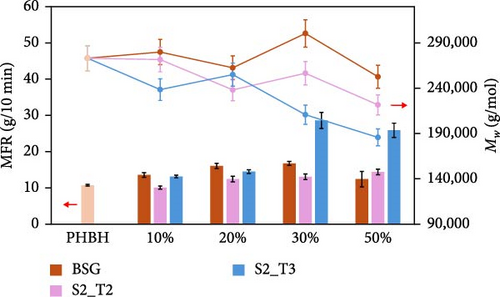
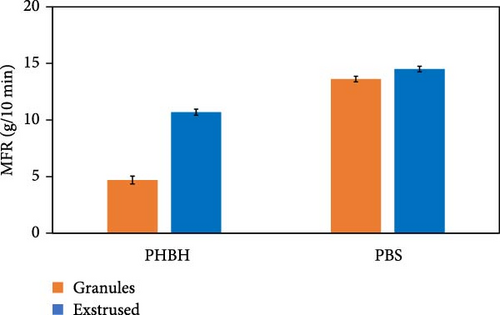
Inherent to these results, a clarification regarding the issue of thermal instability of the PHBH polymer matrix is necessary. Comparing the values of extruded PHBH (10.7 g/10 min) and PHBH granule (4.7 g/10 min), a partial thermos-mechanical degradation of the polymer matrix is observed due to the twin-screw extrusion (Figure 4c). This phenomenon can be attributed to the low thermal resistance of PHA, which is considered a common issue for this class of materials [94, 95]. High temperatures cause degradation of PHBH during extrusion by means of the cleavage of molecular chains [96]. For this reason, it was decided to use a temperature of 165°C as analysis conditions to minimize the possibility of artifacts due to polymer matrix degradation.
Regarding the GPC results of the composites containing the BSG filler (Figure 4a,b), no major change in the molecular weights was detected with the PBS and PHBH matrix. However, an increasing trend in molecular weights was observed in the PBS-based biocomposites containing the fillers treated at different pH values, although the data were not always significantly different. In contrast, PHBH-based composites showed opposite behavior related more to the thermal instability of the polymer matrix (Figure 4b).
Comparing the data collected, the decrease in MFR values in PBS-BSG composites was attributed to the presence of the filler, which limits the mobility of the polymer chains. In contrast, for the PBS-base composites with S2_T2 and S2_T3 fillers, the more pronounced reduction in MFR could be related to the above-mentioned factors and jointly to the 19% ± 5% and 14% ± 5% increase in molecular weight, respectively, compared to the PBS biopolymer. Compared with the study by Domínguez et al. [77], in which the addition of lignin up to 15 wt.% in the PBS polymer matrix causes an increase in the fluidity index, and the study by Hejna et al. [22]. where an increase in MFR values up to 100 parts by weight (pbw) of BSG filler within the poly(ε-caprolactone) (PCL) polymer matrix is noted, in this work using the conditions reported in Section 2.5.3 the natural fillers act as reinforcing agents, and this leads to a decrease in the fluidity index [97, 98]. MFR analysis was also carried out by increasing the temperature (190°C) and decreasing the weight (2.5 kg) compared to the conditions described in Section 2.5.3 (165°C–5 Kg). The results obtained are shown in Figure 4d. An increase in MFR values is observed for the composites containing the BSG filler. This phenomenon, as justified in the two literature studies mentioned, is due to the increased presence of protein content [22] as well as lignin [77] that can induce a plasticizing effect above certain temperatures during the compounding process.
3.7. Mechanical Test on PBS- and PHBH-Based Composites
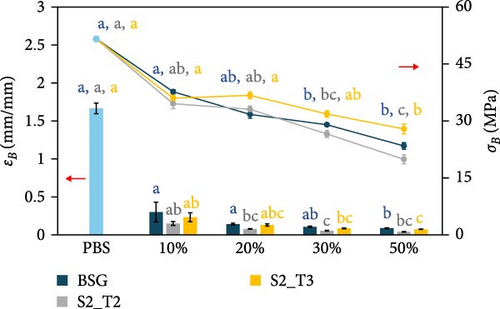
The mechanical properties of pure PBS and PHBH and different biocomposite formulations with the different filler types were evaluated by tensile tests. Figure 5 shows the effect of the different fillers as their content changes within the two different polymer matrices. Specifically, Figure 5a shows the Young’s modulus (E) of the PBS-based composite samples, while Figure 5b shows the E of the PHBH-based composites. The tensile strength (σB) and elongation at break (εB) of the PBS- and PHBH-based samples are shown in Figure 5c,d, respectively.
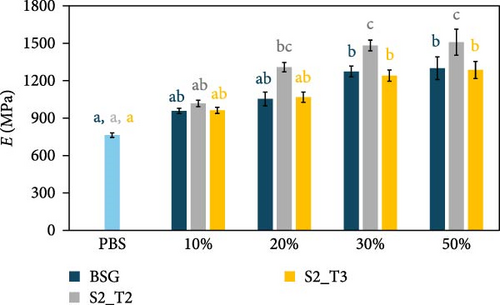

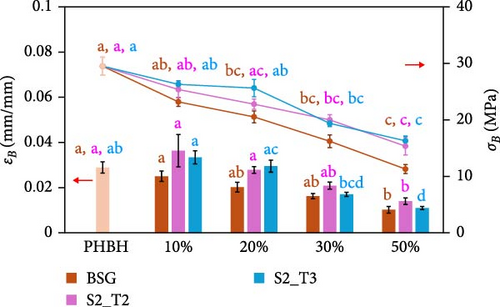
As expected, when rigid fillers are dispersed within polymer matrices, E progressively increases with increasing filler concentration [11, 52, 60, 99]. For example, in PBS-based composites with a filler content of 50 wt.% (Figure 5a), E increased by about 98% in the case of S2_T2 filler compared to the pure PBS module (70% in the case of BSG and 68% in the case of S2_T3). A similar comparison was observed in the work of Kim et al. [100]. In contrast, to when observed for the PBS-based composite samples, in the PHBH polymer matrix, the addition of fillers produced composites with a discrete E increase (Figure 5b). In this case, although there is an increasing trend in the stiffness of the materials, the highest average E value recorded (PHBH70S2T330, 2215 MPa) is found to deviate by only 20% from the pure polymer matrix (1842 MPa). These values are relatively similar to the respective composites containing the highest filler content (50 wt.%).
Similar to other works on composite materials [11, 52, 99], it can be inferred that filler loading is one of the most impacting factors on the variability of the stiffness value [101–104], unlike the other mechanical properties that are influenced more by particle size as well as the presence or absence of interactions at the matrix-filler interface [105, 106]. The E increase for PBS-based composites, can be explained by the increased hindrance of polymer molecules to orient themselves in the direction of stress during the tensile test [100]. At the same time, the behavior of PHBH-based composites may be due to the previous reason in addition to a decrease in the Mw of PHBH chains as reported by GPC analysis (Section 3.6) [94, 95].
Regarding plastic deformation and σB, the addition of fillers in the two biopolymer matrices results in a significant decrease proportionally to the increase in natural fillers [13, 107–109]. As shown in Figure 5c, inherent in PBS-based composites, σB decreases as the content of different fillers increases, as shown in the work of Hejna et al. [22] and Kim et al. [100]. With the incorporation of 50 wt.% BSG filler into the PBS matrix, there is a 56% reduction in σB, from 52 to 24 MPa, while the addition of the same concentration of S2_T2 and S2_T3 determines a 62% and 46% decrease in σB (20 MPa for S2_T2 and 27 MPa for S2_T3, respectively). In correlation with what has been observed for σB, the εB also decreases dramatically for all composite materials made (Figure 5c). Identical behavior was shown for PHBH-based composites (Figure 5d). Pure PHBH offers a lower σB (30 MPa) than pure PBS biopolymer, which decreases to 11 MPa with 50 wt.% BSG filler, to 15 MPa for S2_T2 filler, and to 16 MPa for S2_T3 filler. If one focuses on the εB of the composites with the highest filler content (50%), the very low values of the intrinsic εB of pure PHBH (0.03 mm/mm) are reduced to more than half: 0.01 mm/mm for all fillers.
These results showed clear embrittlement and loss of toughness in all composite materials [110–113]. This behavior is probably due to the filler particles that form a dispersed phase in the thermoplastic matrix that interrupts the continuity of the polymer matrix [11, 102]. Under these conditions, stress transfer between the particle and the matrix is not allowed [114]. Transfer of load at the matrix/particle interface requires a certain level of compatibility. In particular, when comparing the fillers, PBS showed lower compatibility with S2_T2, while the results for BSG and S2_T3 were comparable. With PHBH, the S2_T2 filler gave the best results with the lowest embrittlement and the highest elongation. This was also visible in the SEM images, where the voids at the interface are less pronounced for the S2_T2.
However, in general, it can be assumed from the results obtained for PBS-based composites that the effects of fillers on the PHBH polymer matrix are less pronounced.
Compared to common WPCs based on HDPE, mechanical properties are in the same range as our BSG composites. Using a compatibilizer and 40 wt.% of different wood fillers, HDPE composites showed E around 1.5 GPa, strength values around 30 MPa, and elongation values lower than 5% [56]. In that case, just based on the mechanical properties, PBS-BSG or PBS-S2T3 could be an appropriate alternative.
The use of biopolymer matrices with wood flour content has also been explored in the literature. In the work of Weng et al. [57], they made PBS-based WPCs blended up to a 30 wt.% of wood flour. The results showed that at the same filler concentration, they obtained an εB of only 4% compared to more than twice the elongation obtained by PBS70BSG30 and PBS70S2_T330 composites. On average, similar results were obtained when it comes to σB, unlike E, which increased only twice as much as in Weng’s work, in which E tripled compared to the pure PBS matrix.
More comparable results come from the work of Hongsriphan et al. [58], in which it is reported that loading the PBS polymer with a type of wood flour up to a 40 wt.% results in similar behaviors to our materials. In fact, the decrease in εB at volumes around 5 wt.% maximum elongation and decrease in σB at values around 23 MPa are observed, and an increase in Young’s modulus up to a maximum of 900 MPa compared to the average E of the PBS-based composites made in this work with a 10 wt.% higher BSG content.
Similar studies on PHA-based composites report similar behaviors. For example, in the case of PHA-wood flour blends (0–30 wt.%), results show elongation at break less than 3% and a decrease in tensile strength from 38.7 MPa to 24.3 MPa, attributed to poor interfacial compatibility between filler and matrix [59].
An interesting comparison can be made with the work of Revert et al. [60], in which PP- and BSG-based WPCs (0–40 wt.%) with 2% compatibilizer (PP-g-MA) were developed. Composites with the highest BSG content showed a modulus of elasticity of about 510 MPa, tensile strength between 18 and 19 MPa, and elongation at break around 5%. Although these results are similar in terms of mechanical properties to those obtained in the present work, the developed composites offer a significant advantage in that they are fully biobased and biodegradable, representing a sustainable option to replace traditional WPCs.
3.8. SEM Analysis of PBS- and PHBH-Based Composites
The surface morphology and interfacial compatibility of composite materials were observed via SEM. Figure 6 shows SEM micrographs of the cross-sections of pure PBS and PHBH polymer (Figure 5a,d, respectively) and its corresponding biocomposites containing 50 wt.% BSG-S2_T3 filler, as representative samples.
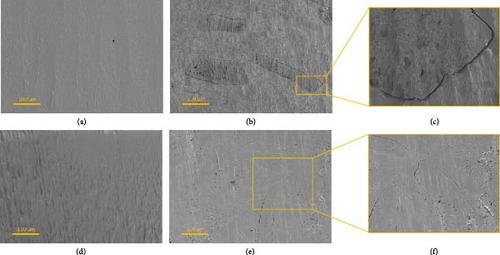
The micrographs also include enlargements of the areas of interest of composite materials. In particular, the PBS50S2_T350 composite is shown in Figure 5b, with expanded detail shown in Figure 5c. Similarly, the PHBH50S2_T350 composite is shown in Figure 5e, with relative magnification shown in Figure 5f.
In the case of the pristine PBS and PHBH (Figure 5a,d, respectively), a relatively smooth and homogeneous surface was observed. In the SEM images of the composite samples, fibers appear as discontinuities on the polished surface of the polymer matrix. Poor adhesion between filler and matrix is evidenced by the presence of a micro-gap surrounding the lignocellulosic filler particle (Figure 5c). For all compositions, micro-gaps were visible when a filler was added, indicating low compatibility between fiber and matrix and confirming the results obtained by IR spectroscopy and tensile tests. The lack of matrix adhesion to the fibers results in inefficient stress transfer to the fibers, leading to stiffening and simultaneous embrittlement of the material under mechanical stress.
In contrast to what was observed for PBS-based specimens, for PHBH-based composite specimens (Figure 5e,f), a higher wettability of the matrix on the fibers can be evidenced, probably due to a more similar polarity, between PHBH and lignocellulosic filler, than observed for PBS.
The interactions at the interphase of matrix-filler combinations should mainly occur through hydrogen bonds, but non-specific interactions are also possible. Both PBS and PHBH can interact via both polar and nonpolar interactions; the same applies to the lignocellulosic fillers [115, 116]. However, due to the hexanoate side chain of PHBH, it is more likely to have a higher compatibility with more hydrophobic functional groups of fillers. The structure of both lignocellulose and proteins is maximally complex, and due to the high number of different functional groups, the protein-rich fractions would be expected to interact more strongly via hydrophilic interactions, whereas the treated fillers tend to interact more hydrophobically based on the higher share in lignin. This would explain the higher affinity of the treated samples for PHBH (Figure 5e,f), as the longer side chain provides more opportunities for hydrophobic interactions and less H-bonding with the PHBH backbone. The morphological analyses are in line with the works reported in the literature by Kim et al. [100] and Cunha et al. [117] for the PBS polymer and Nanni and Messori [118] and Ivorra et al. [119] for the PHBH polymer, where both polymeric matrices were mixed with different types of lignocellulosic fibers.”
3.9. DSC Analysis of PBS- and PHBH-Based Composites
The thermal properties of PBS and PHBH and related composites obtained with different BSG fillers were evaluated by DSC to analyze the melting, crystallization, and glass transition behaviors. The complete results of the DSC analysis performed on the PBS- and PHBH-based composite samples are summarized in Tables 7 and 8, respectively.
| Sample | Tm (°C) | TC (°C) | Tg (°C) |
|---|---|---|---|
| PBS_WATER | 116 ± 1.6 | 87 ± 1.2 | −33 ± 0.7 |
| PBS90BSG10 | 116 ± 1.8 | 87 ± 0.3 | −33 ± 1.03 |
| PBS80BSG20 | 116 ± 2.2 | 87 ± 0.4 | −32 ± 1.7 |
| PBS70BSG30 | 115 ± 1.1 | 87 ± 0.1 | −33 ± 0.9 |
| PBS50BSG50 | 115 ± 1.6 | 86 ± 1.95 | −35 ± 2.6 |
| PBS90S2_T210 | 117 ± 0.7 | 87 ± 0.7 | −32 ± 0.4 |
| PBS80S2_T220 | 117 ± 1.1 | 87 ± 1.2 | −33 ± 3.3 |
| PBS70S2_T230 | 117 ± 0.6 | 87 ± 0.3 | −32 ± 1.1 |
| PBS50S2_T250 | 116 ± 2 | 85 ± 1.8 | −26 ± 7 |
| PBS90S2_T310 | 116 ± 0.3 | 87 ± 0.1 | −31 ± 1.3 |
| PBS80S2_T320 | 117 ± 1.3 | 87 ± 1.5 | −30 ± 1.5 |
| PBS70S2_T330 | 117 ± 0.5 | 87 ± 2.8 | −32 ± 2.8 |
| PBS50S2_T350 | 118 ± 0.9 | 86 ± 1.3 | −32 ± 1.3 |
| Sample | Tm (°C) | TC (°C) | Tg (°C) |
|---|---|---|---|
| PHBH | 147 ± 0.3 | 64 ± 2.6 | 0 ± 4 |
| PHBH90BSG10 | 149 ± 0.1 | 69 ± 4.8 | 3 ± 0.6 |
| PHBH80BSG20 | 148 ± 1 | 64 ± 0.1 | 3 ± 1.2 |
| PHBH70BSG30 | 148 ± 1.2 | 58 ± 3.6 | 4 ± 0.2 |
| PHBH50BSG50 | 149 ± 1.6 | 65 ± 0.5 | 1 ± 0.6 |
| PHBH90S2_T210 | 149 ± 0.8 | 64 ± 0.1 | 3 ± 1.5 |
| PHBH80S2_T220 | 149 ± 0.5 | 60 ± 0.1 | 3 ± 1.7 |
| PHBH70S2_T230 | 149 ± 0.6 | 55 ± 2.4 | 3 ± 0.1 |
| PHBH50S2_T250 | 150 ± 0.9 | 59 ± 2.2 | 1 ± 2 |
| PHBH90S2_T310 | 148 ± 1.2 | 69 ± 6.5 | 2 ± 1.5 |
| PHBH80S2_T320 | 148 ± 1.1 | 63 ± 0.1 | 3 ± 1.5 |
| PHBH70S2_T330 | 150 ± 0.8 | 65 ± 1.6 | 2 ± 0.1 |
| PHBH50S2_T350 | 150 ± 0.9 | 62 ± 1.3 | 1 ± 1 |
Thermal analysis results indicate that the incorporation of the three different types of fillers derived from BSG do not produce significant changes in the thermal properties of the PBS matrix. In particular, PBS-based composites containing BSG show Tm between 115°C and 118°C, values very similar to the Tm of pure PBS (116°C). The same was evidenced for PHBH-based composites, which show Tm without significant variation from the Tm of the pure polymer (147°C). Similar behavior was also observed in the study by Hejna [17], where no significant changes in Tm were found with the addition of BSG in the PCL matrix.
Similarly, the invariance of the Tc is observed for PBS- and PHBH-based composites. In addition, the dilution effect of the exothermic peak was observed as the peak height is lower in biocomposite materials than in pure PHBH. This behavior is probably due to the lignocellulosic powders not presenting a thermal transition in this temperature range [119].
As far as the glass transition temperature (Tg) is concerned, no appreciable changes were observed compared to pure PBS and PHBH. In the first analysis, the addition of the different BSG fillers to PHBH slightly increases the Tg to values in the range of 1–4°C for all composites. Considering that Tg is not a single temperature but a range of temperatures in which the material undergoes a transition from the glassy to the rubbery state, it can be assessed that these small changes in Tg are not significant, indicating that the addition of BSG fillers does not significantly affect the mobility of the polymer chains in the amorphous phase.
4. Conclusion and Outlook
The presented research aims to investigate the potential impact of BSG biofiller components on the overall compatibility of biocomposites made from PBS and PHBH as polymer matrices. Additionally, this study seeks to verify whether these biocomposite materials, PBS/BSG and PHBH/BSG, could serve as a viable alternative to traditional wood flour-based WPCs. To this end, the BSG biofiller was initially treated using different hydrolytic S/L extraction treatments at varying pH levels (9, 10.5, and 12) and lautering methods (conventional and alternative) with the goal of leaching out nonlignocellulosic impurities and making it as similar to wood as possible. These processes showed that the initial protein content was significantly reduced, while the fibrous lignocellulosic component of the BSG remained qualitatively preserved in the treated BSG samples, highlighting the effectiveness of the process.
To investigate the basic compatibilities of the different biofillers and biopolymer matrices, thermal, structural, mechanical, and morphological analyses were performed. Structural and thermal analyses intended to highlight interactions between the biofillers and biopolymeric matrices showed no noteworthy changes by means of FT-IR or DSC. However, differences in basic compatibilities between filler and matrix were concluded from mechanical testing as well as SEM. For PBS, the best compatibilities were shown for BSG as well as S2T3 composites, while PHBH showed the best results in combination with S2T2. Therefore, depending on the matrix used, a pretreatment to minimize the protein content might not always be necessary. However, changes in the melt flow at higher protein contents and higher temperatures should be kept in mind for processing. Compared to classical WPCs based on polyolefins, however, both PBS-BSG and PBS-S2T3 resulted in comparable mechanical performance.
Regarding the impact of the extrusion process on the chosen polymer-matrix systems, we saw that the different types of biofillers have a distinct influence on the MFR of both PBS and PHBH biopolymer matrices. For PBS-based biocomposites, a decrease in flowability was observed due to limited chain mobility, which was more pronounced in biocomposites containing treated biofillers. This is likely due to the lower protein content, which favored a higher degree of interaction with the biopolymeric matrix. In contrast, PHBH-based composites showed MFR values with a slight upward trend correlated to decreasing GPC values as the filler content increased. These results reflect the degradation issue encountered in the PHBH polymer matrix due to the low resistance to thermomechanical stresses during the extrusion process. Furthermore, degradation could be due to the introduction of high amounts of filler, which increases the overall shear force during the extrusion process.
As mentioned above, the main problem with incorporating biofillers into polymer matrices is the drastic change in mechanical properties, especially when there is limited compatibility between matrix and filler. Although we observed differences in the basic compatibilities for different pretreatments of the fillers, the overall performance still indicates low interactions at the particle-polymer interfaces. Further studies should, therefore, investigate the integration of plasticizers and/or a compatibilizer to improve the processability of biocomposite materials and increase wettability at the matrix-biofiller interface. Furthermore, an improved dehydration and grinding process could be developed to obtain smaller BSG powders, increasing the interaction surface and dispersion of the particles in the polymer matrix.
Conflicts of Interest
The authors declare no conflicts of interest.
Funding
The authors wish to acknowledge the financial support of the ECOSISTER project funded under the National Recovery and Resilience Plan (NRRP), Mission 04 Component 2 Investment 1.5—NextGenerationEU, Call for tender no. 3277 dated 30/12/2021, Award Number: 0001052 dated 23/06/2022; the “Initiative for Biogenic Value Creation and Smart Farming” (2021−2025), funded by the German Federal Ministry of Education and Research; and the Bavarian State Ministry of Economic Affairs, Regional Development and Energy.
Acknowledgments
The authors wish to acknowledge the financial support of the ECOSISTER project funded under the National Recovery and Resilience Plan (NRRP), Mission 04 Component 2 Investment 1.5—NextGenerationEU, Call for tender no. 3277 dated 30/12/2021, Award Number: 0001052 dated 23/06/2022; the “Initiative for Biogenic Value Creation and Smart Farming” (2021−2025), funded by the German Federal Ministry of Education and Research; and the Bavarian State Ministry of Economic Affairs, Regional Development and Energy.
Supporting Information
Additional supporting information can be found online in the Supporting Information section.
Open Research
Data Availability Statement
The data that support the findings of this study are available from the authors upon reasonable request.


