Carboxymethyl Cellulose (CMC)-Reinforced Polyvinyl Alcohol (PVA) Fibrillar Composite Membranes: Production by Centrifugal Spinning and Characterization
Abstract
The use of centrifugal spinning as a method for producing nanofibers has advantages over other methods, such as high production rates, large-scale production, and no need for high voltage. In this work, two different biodegradable materials are used in different mixture ratios to produce biodegradable composite fibrous membranes. Characterization methods demonstrated that the amount of added carboxymethyl cellulose (CMC) significantly affects the fiber formation and end-product properties. When the concentration of CMC is increased, the membranes become mechanically stronger, whereas the fiber formation ability becomes weaker. The CMC crystal clusters and their heterogeneous distribution determine the optical properties of the membranes. These fibrillar composite membranes are suitable for use in biodegradable and eco-friendly filtration systems.
1. Introduction
Due to their properties of flexibility, high surface area, superior mechanical properties, and complex pore structure, nanofibers have attracted great attention from researchers. Nanofiber production involves techniques like electrospinning, template synthesis, drawing, phase separation, freeze drying, and centrifugal spinning [1]. Electrospinning is widely preferred among these techniques because it has advantages such as easy setup, adjustable fiber sizes, and the ability to produce porous nanofiber membranes [2]. However, the low production rate and high voltages have hindered the widespread commercial use of electrospinning. Other methods of nanofiber production, such as template synthesis and phase separation, are complex, and production is limited for each polymer type [3–5].
The integration of CMC into electrospinning processes presents inherent limitations when utilized as a singular component; however, its compatibility with polymeric materials such as polyvinyl alcohol (PVA) and PVP facilitates the formation of viable composite solutions [25, 26]. Empirical investigations have demonstrated that precisely calibrated concentrations of CMC and PVP yield nanofibers exhibiting optimal morphological characteristics and dimensional uniformity [26]. Moreover, CMC demonstrates significant efficacy in enhancing coating homogeneity through the mitigation of fiber aggregation phenomena, consequently augmenting the barrier properties when applied to paperboard substrates [27].
In the context of food packaging applications, CMC-based nanofibers demonstrate considerable potential, attributable to their inherent biocompatibility, biodegradability, and adherence to sustainability principles. Experimental studies have elucidated that electrospun PVA/PVP/CMC nanofiber composites manifest uniform diameter distributions and enhanced hydrophobic properties subsequent to crosslinking procedures, rendering them particularly suitable for extended food preservation applications [28]. Furthermore, investigations into the antimicrobial properties of CMC-based nanofibers, specifically through the incorporation of silver nanoparticles (Ag NPs), have demonstrated enhanced antibacterial efficacy. The structural characteristics of these nanofibers, particularly the correlation between fiber diameter and Ag NP concentration, exhibit a direct influence on antimicrobial performance, establishing CMC/PVA/Ag NPs nanofiber matrices as viable candidates for applications in air filtration systems and wound management protocols [29].
In this study, we produced nanofibers using different ratios of CMC and PVA mixtures by centrifuge spinning. We investigated the rheology and optical parameters of the solutions before fiber formation. Additionally, we studied the morphology, mechanical, and optical properties of the solid membrane form with different mixture ratios of CMC and PVA. We characterized the CMC/PVA composite membranes using Mueller polarimetry, Raman-surface-enhanced Raman spectroscopy (SERS), Fourier transform infrared spectroscopy (FTIR), tensile tests, and rheological experiments.
- 1.
Circular birefringence (gamma): the difference in refraction between left and right circularly polarized light.
- 2.
Linear birefringence (beta): the difference in refraction of linearly polarized light with orthogonal polarization planes.
- 3.
Optical angle of linear birefringence (alpha).
- 4.
Circular dichroism (R): the difference in absorption between left and right circularly polarized light.
- 5.
Linear dichroism (D): the difference in absorption between linearly polarized light rays with orthogonal polarization planes.
- 6.
Optical rotation angle of linear dichroism (theta) [31].
Our results demonstrate that changes in the mixture ratio significantly affect the material properties and end-use of the final product.
2. Experimental Section
2.1. Bionanofiber Manufacturing
- 1.
40% PVA.
- 2.
30% PVA–1% CMC.
- 3.
20% PVA–2% CMC.
- 4.
10% PVA–3% CMC.
- 5.
4% CMC.
Initially, CMC and PVA were added to distilled water simultaneously and stirred together at 2000 rpm for 1 h using a mechanical stirrer. Subsequently, the solution was kept in an oven at 60°C for 12 h. After the dwell time, it was stirred again at 1000 rpm for 1 h using a mechanical stirrer. Then, it was kept in an oven at 60°C for another 12 h. This process was repeated three times, after which the solution was ready for centrifugal spinning.
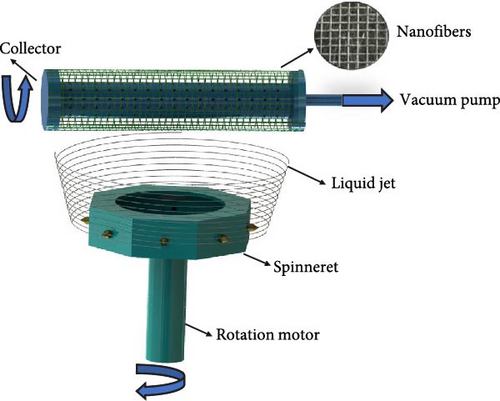
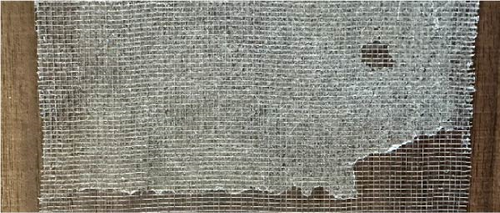
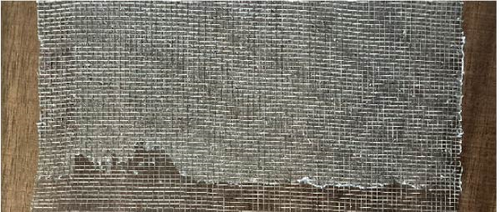
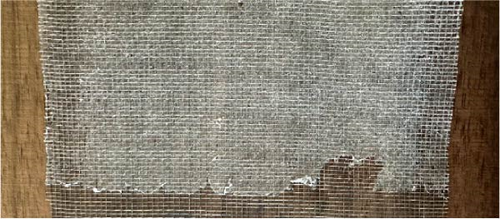
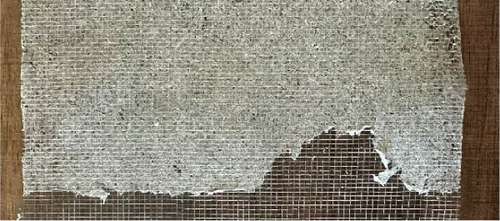
The centrifugal spinning process was carried out in a homemade device (Figure 1). The centrifugal spinneret was designed with a diameter of 12 cm and eight nozzle outlets. A collector module rotating at 3000 rpm was placed ~20 cm above the spinneret. With the help of a vacuum in the collector, the nanofibers were collected on the rotating collector. The nanofiber production parameters were an angular velocity of 11,500 rpm, a spinneret nozzle diameter of 0.2 mm, and a working distance of 20 cm. The CMC-reinforced PVA nanofibers were produced at different CMC concentrations. The fibers on the collection net are shown in Figure 2.
2.2. Characterization Methods
2.2.1. Shear Viscosity
The shear viscosity of the prepared solutions was characterized using an analog rotational viscometer with an R3 mil type.
2.2.2. SERS/Raman Experiments
- •
785 nm laser with 400 mW power.
- •
QEPro high-performance spectrometer.
- •
Mirror to collect back-scattered light.
- •
Filter to prevent elastic light from reaching the spectrometer.
- •
Fiber optic system for light transmission and collection.
Raman analysis of solutions and powder samples was performed in the range of 200–3000 cm−1 at 785 nm. For SERS, glass slides were coated with 40 μm of gold. The samples were placed on gold-coated glass slides. Raman spectroscopy measurements were taken from fiber and powder samples.
2.2.3. SEM Analysis
Fiber morphology was analyzed using a Thermo Scientific Quattro S Environmental Scanning Electron Microscope at 5000× magnification and 30 kV. The morphology of CMC in its dissolved state in water was investigated using a Thermo Scientific Quattro S Scanning Transmission Electron Microscopy at 30 kV with a 0.1% aqueous solution of CMC. Fiber diameters were calculated using the SEM software.
2.2.4. Tensile Tests
Tensile tests were performed using a homemade single-axis tensile testing machine. To observe the effect of CMC and PVA on mechanical properties, membrane samples (10 × 30 × 0.05 mm) were prepared using the same mixture ratios. Tests were performed at a tensile rate of 2.33 mm/min. All tests were conducted on a minimum of five samples, and the reported results are average values.
2.2.5. Mueller Polarimetry Experiments
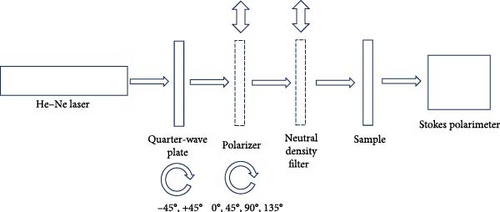
To investigate nanofiber interactions with differently polarized light, analyses were carried out using Mueller matrix polarimetry characterization (Figure 3). The system consists of the following:
- •
633 nm wavelength He–Ne laser light source (HNL050LB, Thorlabs Co.).
- •
Neutral density filter (Thorlabs Co.).
- •
Quarter-wave plate (WPQ10M-633 Thorlabs Co.).
- •
Polarizer (Thorlabs Co.).
- •
Stokes polarimeter (PAX1000VIS, Thorlabs Co.).
In measurements, linearly polarized light (0°, 45°, 90°, and 135°) is generated using the quarter-wave plate (+45°) and polarizer, then directed onto the sample. After removing the polarizer, right (+45°) and left (−45°) circularly polarized light is directed onto the sample using only the quarter-wave plate. A neutral density filter maintains 1 mW light intensity on samples. Polarized light passing through the sample is collected in the polarimeter, and S0, S1, S2, and S3 Stokes vectors are obtained via commercial software. Optical parameters were calculated from these vectors using MATLAB.
Since PVA showed no effect on optical properties, only CMC solutions (0.2%–3% at 0.2% intervals) were prepared for Mueller matrix measurements.
3. Results and Discussion
3.1. Shear Viscosity
The rheological properties affect fiber formation in nanofiber production. In shear stress measurements, the highest value was measured as 264,000 mPa·s in 40% PVA solution, while the lowest value was 124,000 mPa·s in 4% CMC solution. The results demonstrated that shear stress increases as the PVA ratio increases (Figure 4). This increase positively affects nanofiber formation.

3.2. Raman Spectroscopy, SERS, and FTIR
Figure 5 demonstrates the Raman shifts of pure and composite samples. The intensity of the CH stretching vibration band of PVA at 2910 cm−1 decreases with CMC addition. The stretching vibration band of the acetate carbonyl group appears weakly at 1710 cm−1 in the PVA solution’s Raman spectrum. Similarly, the CH and OH bending and CH2 wagging bands of pure PVA at 1440 and 1360 cm−1 decreased and shifted to 1437 and 1324 cm−1, respectively, upon mixing with CMC. The bands of pure PVA at 1144 and 1090 cm−1 indicated C─C and C─O stretching vibrations and C─O stretching vibrations with O─H bending, respectively [32, 33]. These bands overlapped and appeared at 1126 cm−1 in the 40% aqueous mixture, shifting to 1120 cm−1 with CMC addition. In solid PVA’s Raman spectrum, the C─C stretching vibration bonds appeared at 916 and 848 cm−1 [32, 33]. CMC incorporation shifted these bands to 910 and 827 cm−1, respectively. The Raman peak at 481 cm−1, indicating CO bending and out-of-plane CH bending, decreased in the composites.

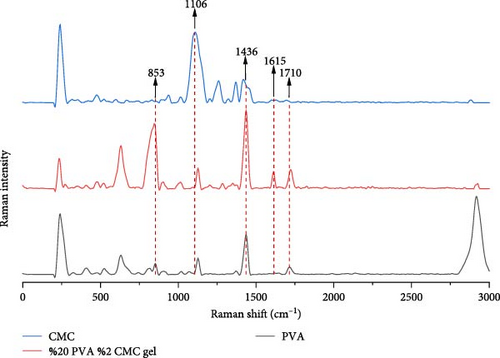
Figure 6 shows SERS results for pure PVA, CMC, and a mixture of 20% PVA and 2% CMC. In solid PVA’s Raman spectrum, the acetate carbonyl group’s stretching vibration band appears at 1710 cm−1. The band at 1615 cm−1 in the nanocomposite spectrum results from C═O group formation after hydrogen bonding interactions between PVA and CMC [34]. The CH and OH bending band of PVA shifts from 1436 to 1417 cm−1 after CMC addition. The carboxymethyl substitution peak of CMC shifts from 1106 to 1127 cm−1 with lower intensity, indicating molecular interactions. While solid PVA’s C─C stretching vibration band appears at 853 cm−1, this band shifts to 845 cm−1 with higher intensity in the PVA/CMC mixture. These spectral shifts indicate interactions between PVA and CMC [35].
FTIR results (Figure 7) confirm the previous vibrational spectroscopy results [28]. When examining the absorption bands of 40% PVA, 30% PVA/1% CMC, 20% PVA/2% CMC, and 10% PVA/3% CMC mixtures, it was observed that the bands display a bathochromic shift in the spectrum of CMC/PVA blends compared to their position in the spectra recorded from the “pure” form of both polymers [29]. For example, the CH stretching band of PVA at 2942 cm−1 shifted to 2930 cm−1 when 3% CMC was incorporated into the PVA solution for nanocomposite formation. The decrease in peak intensity at 2942 cm−1 is related to PVA concentration in the mixtures [36]. The shift to lower intensity of the ─CH stretching in PVA/CMC mixtures is consistent with the findings of Pratinthong et al. [36]. The intensity of the characteristic ─COO asymmetric band of CMC at 1603 cm−1 increased with rising percentages of CMC in the mixture. The region assigned to the ─COO functionality indicates the formation of intermolecular hydrogen bonding between the PVA and CMC mixtures [32].

3.3. SEM/TEM Analysis
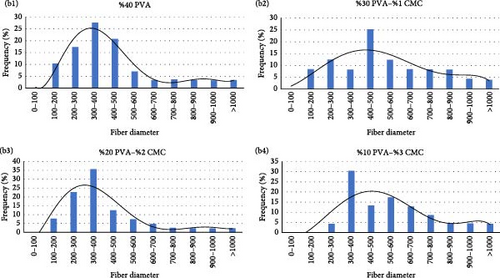
Examination of the SEM images (Figure 8a) shows that nanofiber formation occurred in all mixtures. The CMC ratio did not significantly affect the diameters of the nanofibers. However, the CMC ratio negatively affected nanofiber formation. Nanofiber formation did not occur in the solution containing only pure CMC. In all mixtures, the nanofibers were predominantly in the range of 300–500 nm (Figure 8b).

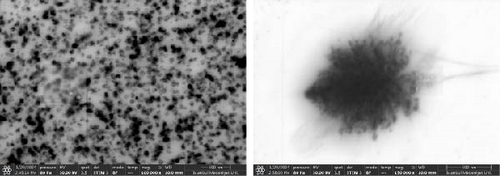
Examination of TEM images revealed the presence of CMC nanocrystals and nanofibers after dissolution in water (Figure 9). While nanocrystals were predominant, nanofibers surrounded by agglomerated nanocrystals were detected in some regions. The presence of cellulose nanocrystals in the solution explains the enhanced mechanical properties observed with increasing CMC ratios.
3.4. Tensile Test Results
The presence of CMC in the composite fibers is expected to improve mechanical properties with increasing CMC ratios. While nanofiber or thin film formation did not occur above a certain CMC mixture ratio, membranes were produced at the previously mentioned ratios to investigate mechanical properties. The pure CMC solution did not exhibit any nanofiber formation.
Figure 10 shows the mechanical properties of the CMC/PVA composite membranes. According to tensile test results, pure PVA exhibited a maximum stress of 34.05 MPa, Young’s modulus of 9.99 MPa, and elongation at a break of 25.31%, which is consistent with literature findings [37]. With increasing CMC ratios, both maximum tensile strength and Young’s modulus increased while elongation at break decreased. The 3/10 (wt%) CMC/PVA composition, which demonstrated the highest tensile stress and Young’s modulus, achieved tensile stress of 64.13 MPa and Young’s modulus of 21.51 MPa, though elongation at break decreased to 11.66% (Figure 10a–d).

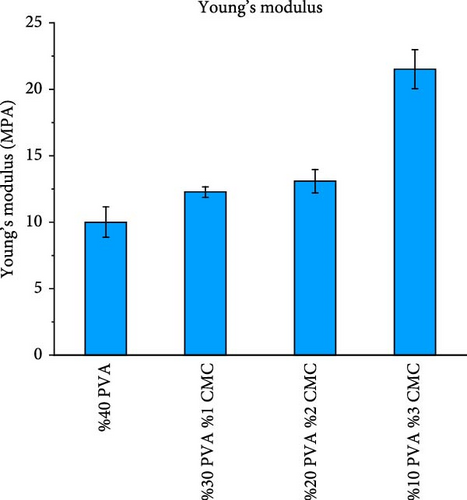
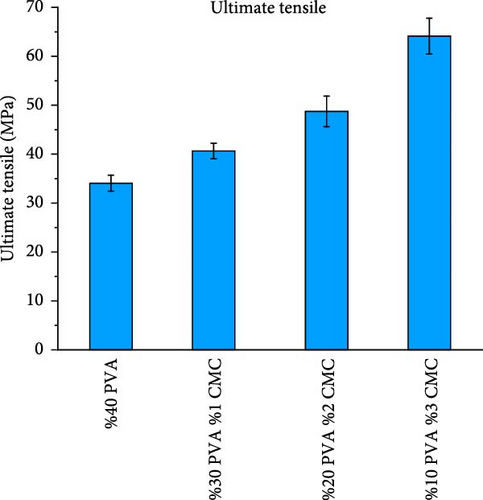
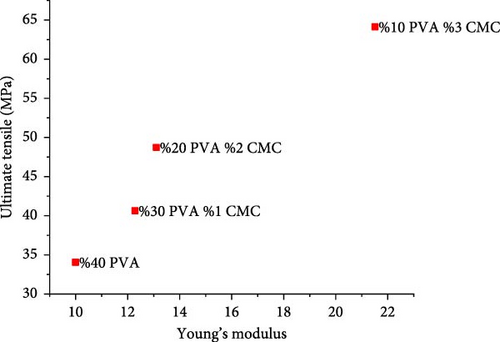
These results clearly demonstrate that increasing the CMC ratio enhances the mechanical properties of composite membranes. These findings align with studies by Tongdeesoontorn et al. [38] and Ghanbarzadeh et al. [39]. The improvement in mechanical properties likely results from molecular interactions between CMC and PVA, as evidenced by FTIR and Raman spectroscopy [40].
3.5. Mueller Matrix Polarimetry
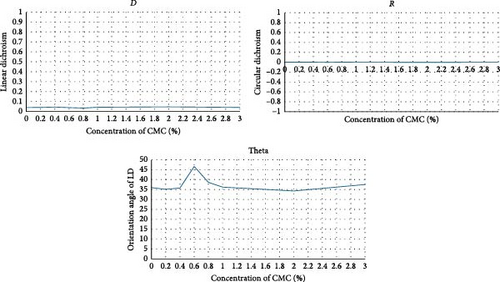
The optical parameters of CMC were measured using Mueller polarimetry as a function of concentration (Figure 10a,b). The results showed that CMC exhibits neither circular dichroism (R) nor linear dichroism (D). Since the dichroism values are zero, the optical angle value of linear dichroism (θ) displays an almost linear relationship (Figure 11a).
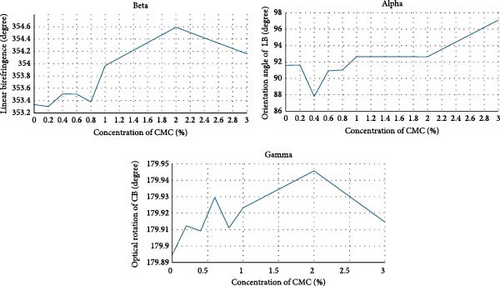
An increase in both birefringence values and angle was observed as a function of concentration. However, as shown in Figure 11b, this change was not linear or parabolic due to random crystal structures present in the solution and distributed heterogeneously (Figure 9). The molecular structure of CMC both refracts and rotates the incoming light. CMC molecules refract light, observable via β parameters, and rotate light, observable via γ parameters, depending on the concentration (Figure 11b). However, due to randomly aggregated CMC crystals/fibrils within the solution, the refractive and rotational effects of light vary depending on the light’s path through the sample.
4. Conclusions
Biodegradable polymer nanofibers were successfully produced using the centrifugal spinning method. Since CMC alone cannot form nanofibers, nanofiber formation was enhanced by adding PVA to the CMC solution. Analyses were performed at every stage of the production process to maintain better control over composite nanofiber formation from the CMC–PVA solution. It was observed that increased solution viscosity led to increased nanofiber formation. As the concentration of CMC increased in the mixture solutions, membrane strength increased significantly; however, the nanofiber formation ability of the mixtures decreased. The presence of nanocrystal clusters in the solutions dramatically affected the optical properties of the composite membranes. All characterization results demonstrated that the admixture ratio of CMC crystals had a significant effect on the final properties of composite nanofiber membranes.
Conflicts of Interest
The authors declare no conflicts of interest.
Author Contributions
Enes Ataş: data curation, sample preparation, methodology, formal analysis, software, writing–original draft, resources, funding acquisition. Abdulbaki Belet: sample preparation, data analysis. Murat Kazanci: conceptualization, methodology, supervision, writing–review and editing.
Funding
The authors acknowledge the support provided by IMU BİLTAM Research Center for laboratory space. This study was financially supported by BAP (Project No: F-ALT-2020-1687) and TÜBİTAK 1512 (Project No: 2200126).
Acknowledgments
We thank IMU BİLTAM research center for providing lab space, BAP (Project No: F-ALT-2020-1687), and TÜBİTAK 1512 (Project No: 2200126) for their financial support.
Open Research
Data Availability Statement
The data that support the findings of this study are available on request from the corresponding author. The data are not publicly available due to privacy or ethical restrictions.


