Artificial Neural Network (ANN)–Based Prediction Model of Demolding Force in Injection Molding Process
Abstract
In this study, an artificial neural network (ANN)–based method is presented to predict the experimental effective demolding forces (EDFs) produced during the injection molding of a polycarbonate polymer material. To evaluate the prediction accuracy and capability of the proposed method, three different algorithms, namely Levenberg–Marquardt (lm), BGFS quasi-Newton (bfg), and scale conjugate gradient (scg), were included in the proposed model. The generated models were validated by comparing the experimental and ANN results, which showed good quantitative agreement. The performance of the algorithms was evaluated using the R2 and root mean square error (RMSE) values, which indicated that scg exhibited the best performance with an R2 of 0.9655 and an RMSE of 0.0223. The relative contribution plot of the ANN models showed that packing pressure had a stronger influence than mold temperature, filling time, and melt temperature. These results will form the basis for predicting the EDF of a comparable molded part using ANN and will help to significantly improve the demolding properties of polymer materials.
1. Introduction
Injection molding process is one of the most efficient, preferred, and widely used techniques for part replication in the mass production of polymer products because of its ability to produce complex-shaped plastic products with good dimensional accuracy and short processing time. As a low-cost and dependable production process, injection molding employs advanced manufacturing technologies. It is possible to produce diverse complex structures and precise product sizes with injection molding, and the application domains of this process include aerospace, automobiles, and medical devices [1–4].
However, there are two important challenges affecting the injection molding process that warrant attention to ensure the production of molded parts with high-quality features [5]. The first challenge is ensuring complete filling of cavities with high-quality features during the mold-filling stage, which is determined by several processing parameters [6–9]. The high-quality features of the design parts will probably cause early solidification of the resins, which can slow the speed of filling of cavities [5]. The second challenge is the demolding of molded parts in cavities. The strong demand for products that have high-quality molding features with well-defined tolerances and dimensional features requires that significant attention should be paid to the demolding phase in terms of the demolding force required to demold a part from a mold cavity [5]. This force can affect the mechanical properties of the manufactured components or products, where an excessive or unbalanced demolding force can change the designed features or even severely damage the parts or features [5, 10].
Moreover, the thermal behavior of resin differs from that of the mold core, which causes polymer melt to shrink onto the cavity walls. As a result, the replication tool constrains the desired features during the solidification process and prevents them from shrinking. This shrinkage barrier causes stress accumulation in the cross-section of the molded part and generates a force normal to the part surface. This stress is directly proportional to the normal pressure, part stiffness, shrinkage, and mold packing [5, 10, 11]. Consequently, a suitably large tangential force is required to break the bond between the polymer and the mold core without destroying the part features or introducing additional internal stresses in the molded component through plastic deformation [5]. In addition, the possibility that a part deforms or even destructs depends not just on its geometry, design of its part features, and constituent polymer materials but also on the number and location of ejector pins and distribution of applied forces [5, 10, 12, 13]. The interactions between part geometry, mold geometry and material, molding materials, and process conditions affect the required demolding force.
Several of the parameters that influence demolding force have been examined [14–16] and utilized to develop a prediction model by using the traditional approach. Griffiths et al. [10] investigated the influence of melting temperature, mold temperature, hold pressure, and injection speed on the demolding force required for cyclic olefin copolymer microfluidic components. Their findings revealed that hold pressure and mold temperature had the strongest effects on demolding force. Su and Gilchrist [5] investigated the influence of melt temperature, mold temperature, packing pressure, and packing time on the demolding force required for microstructured components manufactured from polypropylene homopolymer. They reported that mold temperature had the strongest influence on demolding force, and the demolding force decreased as the mold temperature increased. Sorgato, Masato, and Lucchetta [17] analyzed the influence of mold temperature, injection speed, and holding pressure on the demolding force required for cyclic olefin copolymer material on two distinct machined surfaces. Their results indicated that mold temperature and holding pressure had the most significant effects on the demolding force in terms of promoting replication of the molded parts. Masato et al. [18] examined the effects of packing pressure, cooling time, injection speed, mold temperature, and melt temperature on the demolding force required for microstructured parts of polystyrene and cyclic olefin copolymer materials. Their findings revealed that the effects of cooling time and injection speed were less significant than those of the other parameters in considerably improving the demolding phase.
Artificial neural networks (ANNs) have made significant advancements in the field of injection molding and related scientific and engineering domains. They offer valuable insights, predictive capabilities, and optimization strategies. In practical applications, Dong et al. [19] utilized a self-learning parameter optimization approach to evaluate the weight of injection-molded products. Similarly, Li et al. [20] employed an improved intelligent technique to optimize the quality, manufacturing costs, and molding efficiency of plastic production. The findings emphasize the significance of artificial intelligence (AI) in solving multiobjective optimization problems. Yu et al. [21] utilized a support vector machine classifier to evaluate the reliability and importance of an injection molding process window. The AI demonstrated consistent part quality with low cost and high efficiency. In scientific studies related to predicting water retention capacity [22], yarn quality properties [23], shear strength [24], fiber diameter [25, 26], specific wear rate [27], mechanical properties [28], and high-quality terephthalic acid [29], the use of AI has demonstrated robustness in effectively predicting using the developed models.
Although ANNs have been widely used to investigate shrinkage, warpage, and material properties in injection molding, demolding force has not been adequately addressed in previous studies [3, 30–34]. Most current research focuses on optimizing material selection or mold design, often overlooking predictive modeling that targets demolding force. Furthermore, although various ANN optimization algorithms, including Levenberg–Marquardt (lm) and Broyden–Fletcher–Goldfarb–Shanno (bfg), have been extensively used, their effectiveness compared to the scaled conjugate gradient (scg) approach has not been investigated [35–37].
Therefore, this study aims to fill these gaps by establishing an ANN-based model for predicting demolding force in injection molding. The influence of various processing parameters on demolding force was investigated, which is required to optimize the ejection stage. The injection mold including a load cell was prepared and used in the injection molding experiment, allowing accurate monitoring of the demolding force. Polycarbonate was used in the experiment because it has several advantages for injection-molded microfluidic chips. The frictional effects at the part–mold interface during the injection molding cycle were analyzed. Then, by using ANN, a new model for predicting the demolding force was developed. The developed model was used to optimize processing parameters for a more efficient injection molding process. In addition, the effectiveness of three different ANN optimization algorithms, such as lm, bfg, and scg, were evaluated to determine the most effective and accurate prediction method.
2. Proposed Model
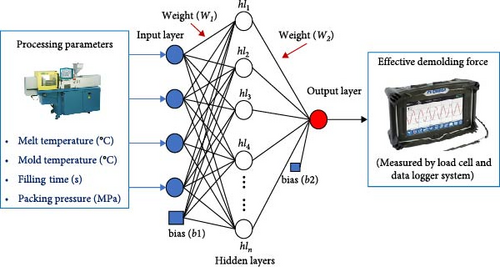
In this study, we develop an ANN-based model for predicting the effective demolding force (EDF), as shown in Figure 1, and the optimized parameters for the ANN model are shown in Table 1. ANN is a powerful computer-based tool with unique features such as data storage, processing, and interpretation on the basis of previously provided information or predictions. Owing to its functionality, ANN is an extremely simple representation of predictive analytics [38]. The neural network control system is divided into input variables, which are the processing parameters, and output variable, which is the EDF. In the proposed model, an ANN network structure with a single hidden layer and 20 neurons is used. There are no general rules or precise methods for determining the number of neurons to be included in the hidden layer of an ANN [39]. The network is trained on a logsig transfer function [40] by using lm [41, 42], scg [43], and bfg algorithms [44] (Equation 1). Furthermore, the collected data are normalized between 0 and 1 to minimize the root mean square error (RMSE) values and to increase the convergence speed and input-scale validity [45–47], using Equation (2). The RMSE (Equation 3) and coefficient of determination (Equation 4) are used to properly evaluate model performance [46, 48, 49]. By denormalizing the dataset, the newly developed model can convert the normalized predicted outputs to their actual scale, as depicted in Equation (5) and Equation (6), the normalized EDF.
| Parameters | Value |
|---|---|
| Input layer neurons | 4 |
| Output layer neurons | 1 |
| Hidden layers | 1 |
| Hidden layer neurons | 20 |
| Training method | Levenberg–Marquardt (trainlm), BFGS Quasi-Newton (trainbfg), and scaled conjugate gradient (trainscg) |
| Error goal | 0.015% |
| Epochs | 1000 |
| Data division | 75% training and 25% testing |
| Momentum (μ) | 0.001 |
| Transfer function of hidden layer | Logsig |
| Learning rate | 0.4 |
3. Experimental
A set of experiments was conducted to develop EDF prediction model for a molded part by considering the effects of its process parameters.
3.1. Injection Molding and Part Design
The material used in this research was grade ML-1020R polycarbonate trademarked as Infino. ML-1020R is manufactured using an eco-friendly nonphosgene process, and it has excellent impact resistance and transparency. Therefore, it is recommended for use in the manufacturing of enclosures for electrical and electronic products, medical devices, automotive headlights, glazing, and extruded sheets. All experiments were conducted using a BOY 25E (Dr BOY GmbH & Co. KG) injection molding machine (Figure 2).
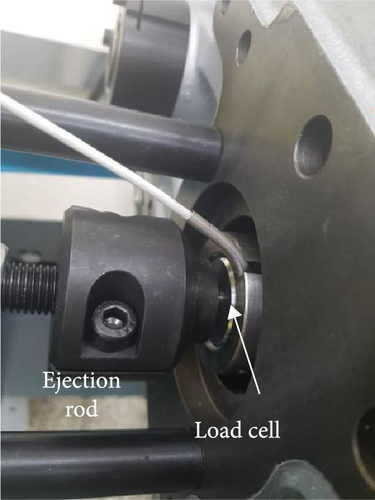
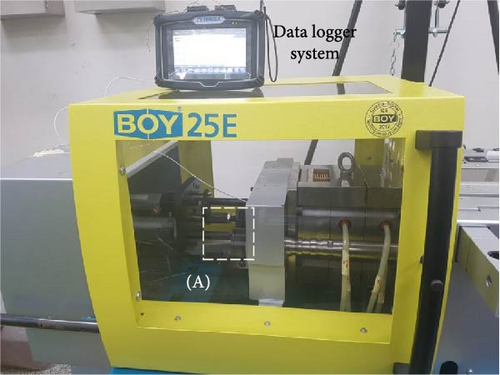
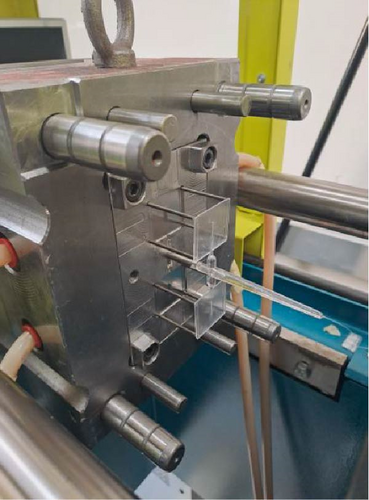
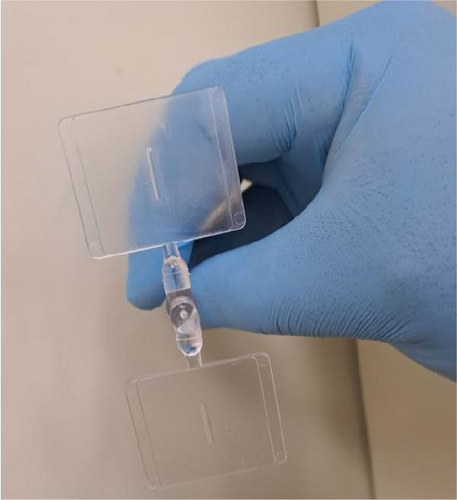
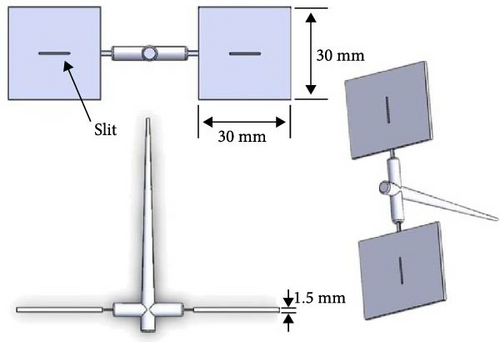
The part design used in this study is depicted in Figure 2. The overall dimensions of the molded part were 30 mm × 30 mm × 1.5 mm, and the dimensions of the slit on the part were 10 mm × 0.5 mm × 1.5 mm.
3.2. EDF Measurement
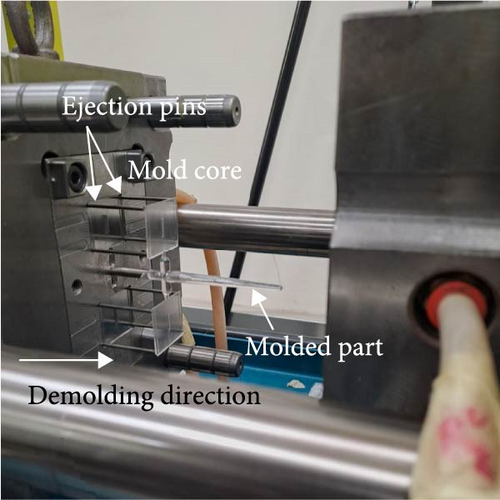
An LCMGD-series load cell (OMEGA) connected to an OM-DAQXL-series data logger (OMEGA), as illustrated in Figure 2, was used in conjunction with the ejector rod behind the demolding plate of the mold core to measure the demolding force. To perform load measurements, the mold was manufactured to accommodate the support of the load cell on the ejector rod. When the ejection rod and plates moved forward, the molded part was removed from the cavity, and the load cell was subjected to a mechanical load that generated an electric potential. The measurement range of demolding force was between 0 and 5000 N with a sampling rate of 50 samples per second (i.e., in time steps of 0.02 s). The sensor output signals were downloaded onto a PC from a memory card.
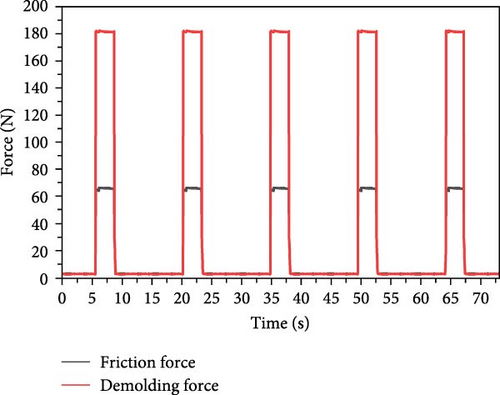
The actual demolding force required to separate the molded part from the mold is not easy to measure. The demolding of a molded part with designed features can usually be challenging because it involves several contributing factors. Among them, as illustrated in Figure 3, a frictional force is generated by the relative motion of the ejection components during the demolding stage. In usual, this frictional force is included in the total demolding force measured by the load cell installed on the injection mold. Therefore, in this study, the frictional force was measured independently by the separate dummy injection molding experiment with the empty mold cavity. The average frictional force measured from several consecutive runs were found to be ~65 N in our mold (Figure 4). While the demolding force was measured during the actual molding process, it includes the effect of the frictional force, as described. Therefore, the difference between the measured demolding force and the average frictional force was considered the actual EDF required to demold the designed component, and this force was computed indirectly as follows:
It should be noted that the frictional force from the movement of the ejection components was found to be less than the EDF, which is generated by the constraining effect of the molded parts on the mold core. Thus, only the EDF is considered in this study, neglecting the other frictional effects.
3.3. Design of Experiments
The experiments conducted in this study were designed based on the central composite design (CCD) technique because CCD has better flexibility and efficiency than other experimental designs. The factorial portion of the CCD was a full factorial design with all combinations of the factors at two levels (high [+1] and low [−1]), and it was composed of eight star-points and six central-points (coded level [0]). The central point was the midpoint between the high and low levels. The “face-centered CCD” involved 30 experimental observations for four independent process parameters. This allowed efficient training and evaluation of the ANN models in this study. Table 2 lists the coded and actual values of the four processing parameters and their possible ranges. The experimental design runs that were used in this study are summarized in Table S1. It should be noted that the packing time and cooling time were set to 3 s and 10 s, respectively. In addition, the filling times of 0.25, 0.50, and 0.75 s correspond to the injection speeds of 57.9, 40.8, and 23.7 mm/s, respectively.
| Symbol | Process parameter | Level | ||
|---|---|---|---|---|
| −1 | 0 | + 1 | ||
| A | Melt temperature (°C) | 280 | 300 | 320 |
| B | Mold temperature (°C) | 80 | 100 | 120 |
| C | Filling time (s) | 0.25 | 0.50 | 0.75 |
| D | Packing pressure (MPa) | 80 | 100 | 120 |
4. Results and Discussion
4.1. EDF Prediction Using ANN
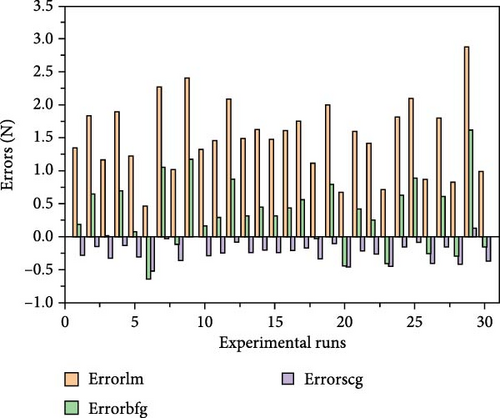
Figure 5a–c depicts the predictions of the EDF generated with the different training algorithms considered herein, such as lm, bfg, and scg. A clear correlation between the estimated and actual EDF values can be seen in the plotted graphs, thereby confirming the effective training by the ANN models. It should be noted that the lower RMSE usually indicates the better prediction performance. Therefore, in this study, the scg algorithm exhibited the best prediction performance with the lowest RMSE value of 0.0223 while the lm and bfg algorithms had the RMSE values of 0.3643 N and 0.0879 N, respectively. However, because significant errors can distort the results, typically, the RMSE does not accurately reflect the ANN’s error. This led us to evaluate the error effects of the different algorithms used herein, as illustrated in Figure 6. The values that heavily influenced the RMSE values were responsible for the variations in the error plot, which are apparent from the gap trends of the different algorithms. These errors, which are usually unavoidable but controllable, as can be inferred from the lower error values, are related to the mechanical system of the injection molding machine during the acquisition of the demolding force data.
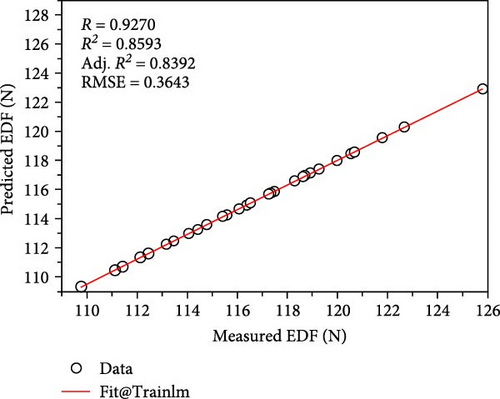
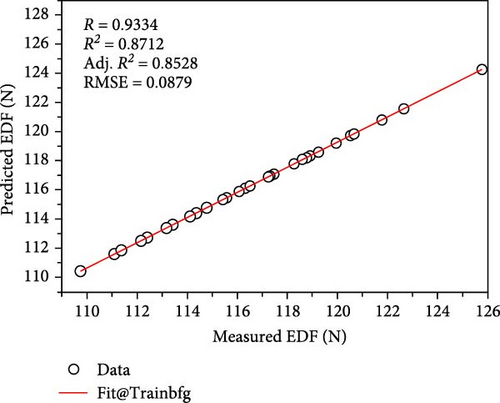
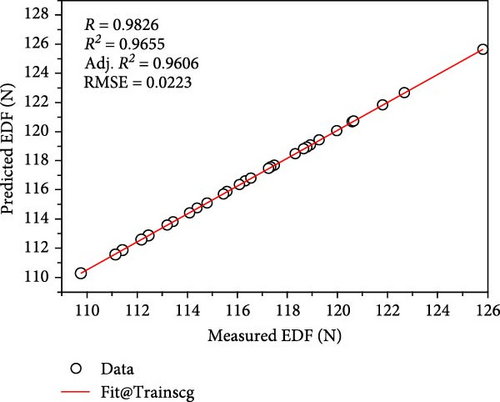
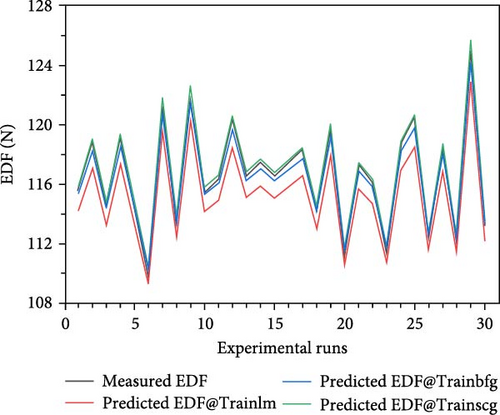
Additionally, the ANN model was able to predict the EDF by using various algorithms and the selected processing parameters, namely melt temperature, mold temperature, filling time, and packing pressure, with a statistically acceptable level of accuracy, as indicated by the significant R-squared values. To ensure that the prediction model is accurate, a significantly high R-squared value is required. Moreover, a comparison between the EDF predicted using the ANN prediction models and the experimental data revealed that the two sets of results agree well, as illustrated in Figure 7.
4.2. Relative Importance Contribution Analysis
The trends observed in the EDF emphasize the significance of balancing and optimizing the injection molding process parameters to achieve the desired part quality and minimize demolding force (Figure 8). The thermal characteristics of the materials are influenced by both melt temperature and mold temperature. An increase in temperature typically results in a decrease in material viscosity, which affects the demolding force. To optimize the demolding force, it is important to carefully control the interactions between melt and mold temperatures. Material flow and packing inside the mold are influenced by both packing pressure and filling time. While higher pressure and longer filling times contribute to better material packing, they also result in higher demolding forces. Therefore, it is crucial to balance these factors to achieve the desired part quality.
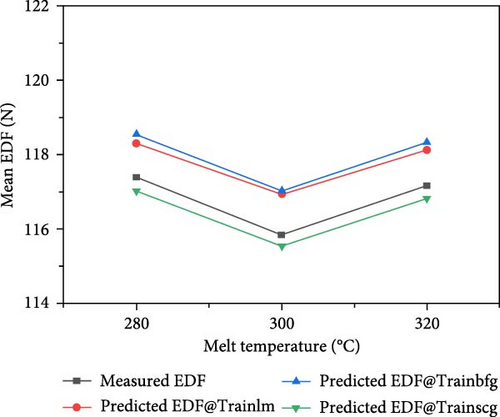
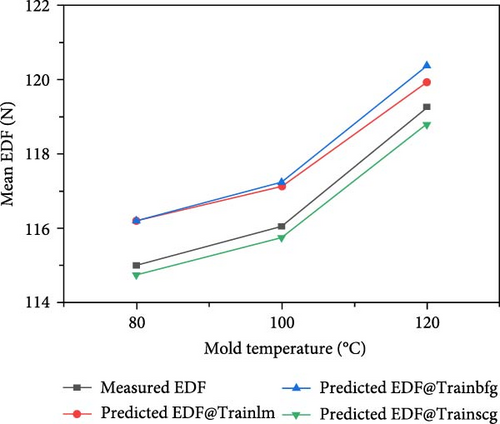
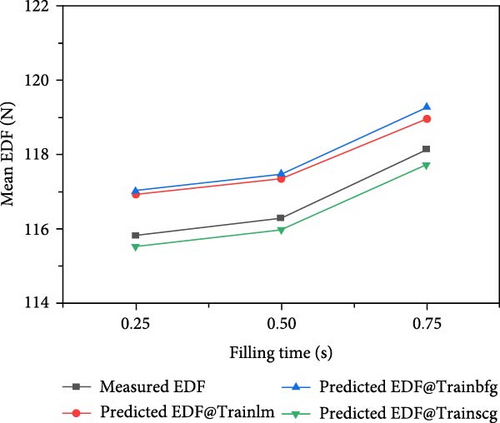
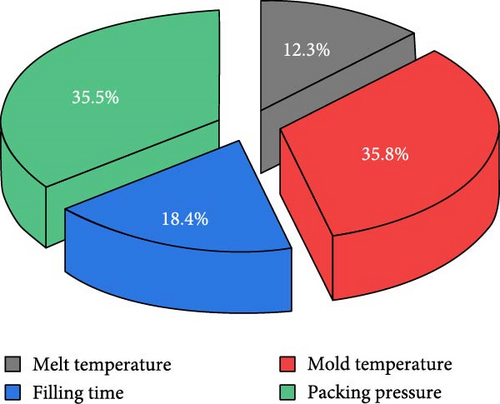
The influence of processing parameters on the EDF was evaluated by performing a relative importance analysis of the mean values. As shown in Figure 9, packing pressure accounted for 35.5% of the influence on the demolding force, which was higher than those of mold temperature (33.8%), filling time (18.4%), and melt temperature (12.3%). The reason for this is the low effect of residual stress in the molded samples. When the packing pressure is increased along with the molding and melting temperature, the polymer melt has more time to cool before solidifying. This gave the polymer melt more time to relieve residual stress caused by the rapid flow of injection molding. The lower temperature difference between polymer melts and mold temperature causes the polymer melt to cool more slowly, giving more time for residual stresses to dissipate. Insufficient packing pressure can cause short shots and excessive shrinkage on demolding. However, after demolding, the demolded parts exhibit good, visible molded quality.
4.3. Evaluation of Processing Parameters With EDF
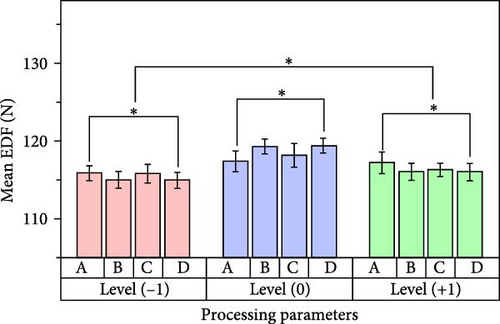
As shown in Figure 10, bar graphs displaying the paired t-test results of the mean values of the EDF were evaluated. The evaluation was important because it helped us to understand the effects of variations in the selected processing parameters on the EDF at each design level. Figure 10 shows a statistically significant relationship between the EDF and the processing parameters tested at the 0.05 significant level. This implies that the considered processing parameters are important in minimizing the EDF during the demolding of the molded part. The results indicate satisfactory interaction effects of the processing parameters in ensuring the best performance of the prediction models (Table S5).
It should be noted that processing conditions that minimize the EDF allow for a more efficient and optimized injection molding process. As the demolding force required to separate the molded part is minimized under these conditions, the generation of defects in the part due to excessive force can be reduced. Energy consumption during operation is also reduced with longer machine and mold life. This would be useful in achieving an efficient and sustainable injection molding process.
4.4. Validation of EDF Prediction Using ANN Model
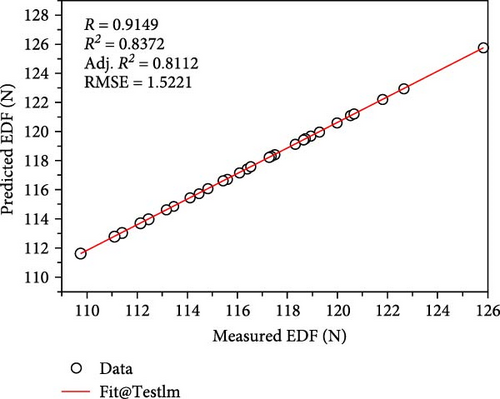
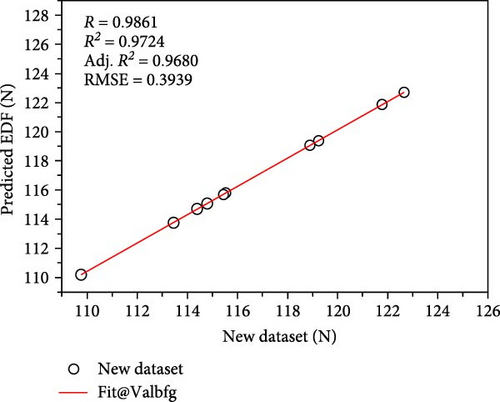
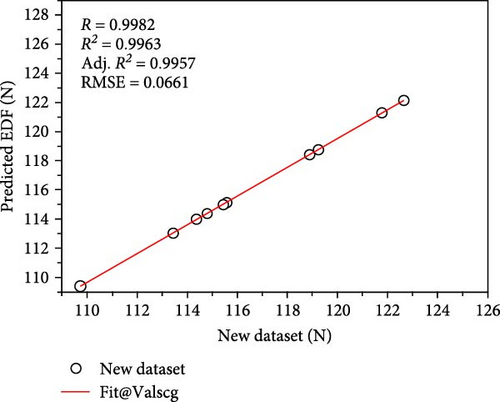
A new model was developed using the three algorithms based on the results obtained using the training and testing datasets. The newly developed prediction model considered normalized inputs, which were the selected processing parameters, as well as the output, which was the EDF. The biases and weights of neurons-connections among the input, hidden, and output layers were used in the ANN model. Equations (5) and (6), along with the optimized coefficients shown in Tables S2–S4, were used to compute the normalized value of the EDF. Denormalizing Equation (6) yielded the finalized EDF model for the three different algorithms, as summarized in Table 3. To verify the newly developed EDF correlation, we applied the ANN model to the test dataset, as shown in Figure 11. The results indicated that the proposed prediction model yielded accurate predictions of the demolding force.
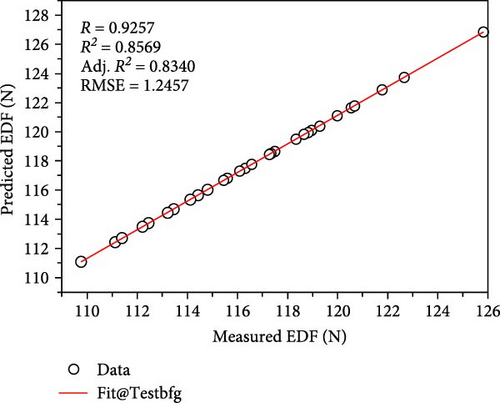
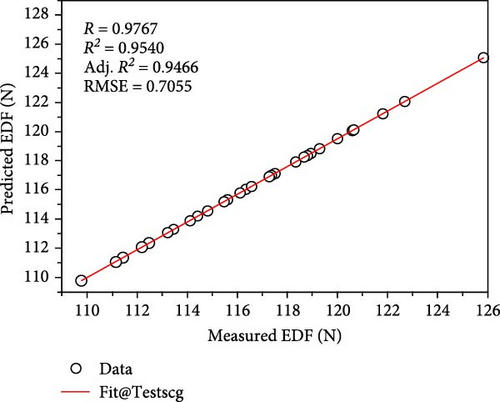
| Algorithms | EDF model (N) | |
|---|---|---|
| Normalization | Denormalization | |
| LM model | (0.85 × MD) + 16 | |
| BFGS model | (0.86 × MD) + 16 | |
| SCG model | (0.96 × MD) + 4.9 | |
- Abbreviation: MD, measured dataset.
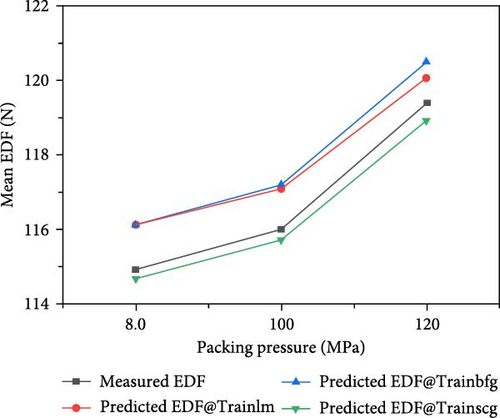
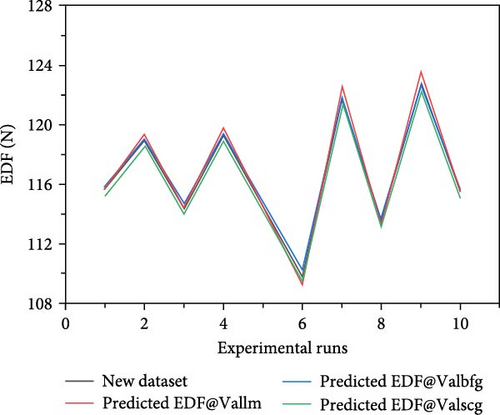
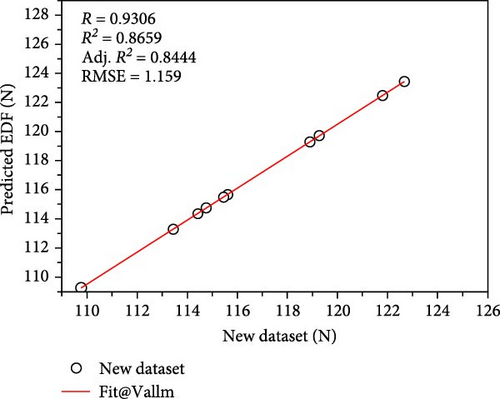
In addition, to validate the model, a new dataset that was not included in the training dataset was collated. In other words, this dataset was never used for developing the present ANN model. The sample size of the validation dataset was 10, along with the corresponding EDF values. The findings depicted in Figures 12 and 13 show that the developed ANN models were able to predict the EDF with a high degree of accuracy and with minimal error (Figure 14).

5. Conclusions
- •
Compared to the experimental findings, the ANN model yielded satisfactory results in terms of the selected processing parameters. Consequently, the proposed ANN model can be used to predict the EDF.
- •
The scg learning algorithm generated the most satisfactory estimates of the EDF because it had the lowest RMSE value of ~0.0223 compared to the other algorithms considered herein.
- •
The relative contribution plot of the ANN models revealed that the packing pressure had the strongest influence on the EDF.
- •
For the ANN models, the bar plot of the mean value obtained from the paired t-test of the selected processing parameters with the EDF demonstrated a good interaction effect for prediction performance at the 5% significance level.
- •
The proposed prediction model was validated by using a new dataset and applying the trained algorithms to it. The estimated results were satisfactory. This demonstrated that the proposed ANN model possessed a robust learning ability in terms of predicting the EDF.
It should be noted that the current model may show a different efficiency when a part geometry and/or molding material is changed. As these factors inherently influence the demolding behavior and the resultant demolding force, the detailed characteristics of the prediction model may change with respect to the used geometry and material. Therefore, a sensitivity or effect of these factors on a prediction efficiency needs to be investigated further. In this manner, a more reliable and versatile prediction model based on the current approach can be established for real-time process monitoring and prediction in injection molding.
Conflicts of Interest
The authors declare no conflicts of interest.
Funding
This research was supported by the National Research Foundation of Korea (2020R1A2C2007603 and RS-2024-00357288).
Acknowledgments
This work was supported by the National Research Foundation of Korea (NRF) grant funded by the Korea Government (MSIT) (2020R1A2C2007603, RS-2024-00357288).
Supporting Information
Additional supporting information can be found online in the Supporting Information section.
Open Research
Data Availability Statement
All required data are included in the article and/or in the supporting information. The data that support the findings of this study are available from the corresponding author upon reasonable request.


