Diabetic Retinopathy Detection Using DL-Based Feature Extraction and a Hybrid Attention-Based Stacking Ensemble
Abstract
Diabetic retinopathy (DR) poses a significant threat to vision if left undetected and untreated. This paper addresses this challenge by utilizing advanced deep learning (DL) algorithms with established image processing techniques to enhance accuracy and efficiency in detection. Image processing extracts critical features from retinal images, acting as early warning signs for DR. Our proposed hybrid model combines image processing and machine learning (ML) strengths, leveraging discriminative abilities and custom features. The methodology involves data acquisition from a diverse dataset, data augmentation to enrich training data, and a multistep image processing pipeline. Feature extraction utilizes ResNet50, InceptionV3, and visual geometry group (VGG)-19 and combines their outputs for classification. Classification employs a decision tree (DT), K-nearest neighbor (KNN), support vector machine (SVM), and a modified convolutional neural network (CNN) with a spatial attention layer. Our work proposed a hybrid attention-based stacking ensemble with the mentioned models in the base layer and logistic regression model as meta layer, which further enhanced accuracy. The system, evaluated through metrics like confusion matrix, accuracy, and receiver operating characteristic (ROC) curve, promises improved diagnostic capabilities. The proposed methodology yields an accuracy of 99.768%.
1. Introduction
Diabetic retinopathy (DR) is an eye condition that can develop over time and damage the blood vessels (BVs) in the retina, resulting in vision loss if left untreated. It is a by-factor of diabetes. Routine screenings and timely treatment are essential for early detection and successful prevention.
According to Sun et al. [1], the global diabetes epidemic underscores an urgent need for ophthalmologists, as highlighted by the International Council of Ophthalmologists (data on ophthalmologists worldwide, n.d.). By 2045, approximately 780 million people are expected to have diabetes, with an estimated 35% developing DR. Among them, 86 million individuals (11%) are projected to experience severe sight-threatening retinopathy. Currently, researchers have combined the strengths of advanced deep learning (DL) algorithms with well-established image processing techniques to produce a system that improves detection accuracy and efficiency.
Datasets of retinal fundus images, such as APTOS, EyePACS, and Messidor, are widely used for DR detection, providing labeled images across various DR severity levels. Additionally, platforms like Kaggle host several open-source datasets facilitating research and development in automated DR detection. Several researchers also contribute by developing and presenting new datasets tailored to specific challenges in DR detection. Bidwai et al. [2] introduced a multimodal dataset comprising 222 images, including 111 optical coherence tomography angiography (OCTA) and 111 color fundus images, collected at the Natasha Eye Care and Research Institute in Pune, India. The dataset was acquired using nonmydriatic imaging techniques with the Eidon widefield fundus imaging and Optovue Avanti Edition machines. Categorized by experienced ophthalmologists, the dataset is intended to support the identification of nonproliferative DR (NPDR) stages.
Critical features from retinal pictures, such as anomalies in BVs, microaneurysms, hemorrhages, and exudates, can be extracted using image processing techniques. These characteristics act as crucial warning signs for the development of DR. Image processing offers the groundwork for diagnosing and measuring pathogenic alterations by methodically examining retinal pictures’ textural, morphological, and color-based properties.
Convolutional neural networks (CNNs) demonstrate a remarkable capacity to learn sophisticated patterns and hierarchies straight from images as a complement to this. CNNs are particularly well-suited for detecting DR because of their extraordinary ability to distinguish fine details and complex structures in retinal pictures. DL models become skilled at classifying retinal pictures into various phases of DR through prolonged training on annotated datasets, enabling early intervention and efficient disease management. Combining DL and image processing produces a hybrid methodology, which takes advantage of both fields’ advantages. Thanks to this synergy, the system may take advantage of the discriminative ability of DL models and the custom features collected by image processing. Combining these insights allows the hybrid technique to improve accuracy, robustness, and generalization capability, opening up a promising new path for practical applications to diagnose DR.
Through this paper, we propose a system that uses image processing techniques, like noise removal, contrast enhancement, and segmentation; feature extraction using different architectures of CNN models; and classification using a hybrid attention-based stacking ensemble with CNN and various ML models as the base layer and logistic regression as meta layer to achieve better accuracy in DR detection.
2. Literature Survey
Automation of DR contributes to early and efficient diagnosis, enabling timely treatment. Over the years, various techniques and models have been experimented with for DR detection. Some relevant works include machine learning (ML)–based approaches, enhanced image processing techniques, DL or DL–based approaches, and hybrid models. Senapati et al. [3] conducted a systematic literature review (SLR) to analyze state-of-the-art methodologies for DR detection using artificial intelligence (AI). The study discusses challenges such as computational complexity, class imbalance, and high maintenance costs associated with existing AI–based systems. The authors reviewed ML and DL techniques for fundus image analysis and emphasized the need for robust and efficient models to detect DR in its early stages. They also analyzed performance evaluation metrics, feature extraction methods, and datasets commonly used in DR detection. Additionally, the study provided future research directions to develop novel, time-efficient, and error-prone systems for early DR diagnosis. This work aims to guide researchers in overcoming the limitations of current methodologies and improving diagnostic outcomes.
Improved image processing techniques can help enhance contrast, remove noises, and segment and extract essential features in fundus images. Yu, Xiao, and Kanagasingam [4] developed a ML–based system for automatic detection of neovascularization in the optic disc (OD) region (NVD) in color fundus retinal images. Neovascularization, a critical indicator of proliferative DR (PDR), involves fragile new vessels that can lead to sudden vision loss. The proposed system uses a multilevel Gabor filter for vessel segmentation, extracting 42 morphological and texture features. Feature selection reduced these to 18 optimal features, which were used to train a support vector machine (SVM) classifier. Testing on a dataset of 424 retinal images (134 NVD and 290 non-NVD) yielded an accuracy of 95.23%. Abdelsalam and Zahran [5] introduced a novel method for early DR detection using multifractal geometry analysis on OCTA macular images. The study focused on diagnosing early NPDR by analyzing the retinal microvascular network’s multifractal features. Seven features were extracted, including singularity spectrum parameters, lacunarity, and generalized dimensions describing retinal morphological changes. These numerical features were used as input to a SVM classifier, achieving an accuracy of 98.5%. Rodrigues, Conci, and Liatsis [6] proposed ELEMENT, a multimodal retinal vessel segmentation framework that combines region growing and ML to enhance segmentation accuracy and efficiency. By integrating grayscale intensity and vessel connectivity features, ELEMENT ensures seamless propagation of connectivity information during classification, reducing inconsistencies. Tested on multiple ocular imaging modalities, including fundus photography and fluorescein angiography, the framework achieved a high accuracy of 97.40% on the DRIVE dataset, outperforming 25 out of 26 state-of-the-art methods. This demonstrates ELEMENT’s potential in advancing automated retinal disease diagnostics.
ML–based approaches are the most common approach for classification and regression problems. The performance of ML or ML models has been decent within the scope of DR detection. Revathy et al. [7] proposed an automated DR detection system using a hybrid ML approach to address the limitations of manual DR diagnosis. The system extracts three key features (exudates, hemorrhages, and microaneurysms) from fundus images and classifies them using a combination of classifiers, including SVM, K-nearest neighbor (KNN), random forest, logistic regression, and multilayer perceptron network. The hybrid model achieved an accuracy of 82%, with a precision score of 0.8119, recall score of 0.8116, and F1 score of 0.8028. The study highlights the potential of automated systems to provide timely DR detection and aid in preventing severe visual impairment.
Recently, DL or DL models have excessively been used for DR detection. The performance of the various types of CNN architecture-based works is on par with that of ML–based approaches. Alyoubi, Shalash, and Abulkhair [8] reviewed recent advancements in automated DR detection using DL techniques. The study emphasized the dominance of CNNs for DR classification and lesion detection, with approaches utilizing both custom architectures and transfer learning (TL). While custom CNNs demonstrated superior accuracy, TL offered efficiency, and ease of implementation. Challenges such as limited dataset sizes and imbalance were addressed using techniques like data augmentation and dataset combination. The review highlighted a critical research gap in systems capable of accurately classifying all five DR stages and detecting lesion types, stressing the importance of such advancements for effective patient monitoring and vision preservation. Das, Biswas, and Bandyopadhyay [9] proposed a computerized diagnostic system using DL–based CNNs for DR detection. Their model evaluates the performance of 26 state-of-the-art DL networks for feature extraction and classification of fundus images. The study found that ResNet50 exhibited the highest overfitting, while Inception V3 showed the lowest overfitting on the Kaggle EyePACS dataset. EfficientNetB4 emerged as the most optimal algorithm, achieving 99.37% training accuracy and 79.11% validation accuracy. Other notable performers included InceptionResNetV2, NasNetLarge, and DenseNet169. Although DenseNet201 achieved the highest training accuracy (99.58%), its validation accuracy (76.80%) was less compared to the top-performing models. The models demonstrated higher accuracy on the training data, but showed a significant decline in performance when tested on the validation data. The results highlight EfficientNetB4’s reliability and efficiency for DR detection. Sait [10] developed a lightweight DL–based system for DR severity grading to address challenges like high computational costs and dataset imbalance in existing systems. The model utilized image preprocessing to reduce noise and artifacts in fundus images, followed by feature extraction using the Yolo V7 technique. A quantum marine predator algorithm (QMPA) was tailored for optimal feature selection, and a hyperparameter-optimized MobileNet V3 model was employed for severity prediction. The model was validated on the APTOS (5,590 images) and EyePACS (35,100 images) datasets, achieving accuracies of 98.0% and 98.4% and F1 Scores of 93.7% and 93.1%, respectively. The lightweight architecture demonstrated reduced computational complexity, requiring fewer parameters, FLOPs, and training time, making it suitable for deployment in resource-constrained settings. Chaurasia et al. [11] proposed a DR detection system where ROI was extracted from the images using the brightest spot algorithm, image cropping, and the Xception model with some hyperparameter tuning for classification. Then, they compared this proposed system with the performance of other DL models like DenseNet-169, visual geometry group (VGG)-19, ResNet 101, MobileNet, Inception V3, and EM-D1. Results showed that the performance of the proposed system (Xception with hyperparameter tuning) was better. Minija, Rejula, and Ross [12] recommended using a gray wolf optimizer while training the optimized CNN model to enhance the CNN model’s hyperparameters. Yadav et al. [13] compared the performance of various CNN architecture-based models like Xception, VGG-19, InceptionResNetV2, InceptionV3, MobileNetV2, and DenseNet201. TL was included in these fundamental models through additional layers such as batch normalization, dropout, and dense layers to increase the model’s effectiveness and accuracy for the given task. Various factors, like accuracy, confusion matrix, receiver operating characteristic (ROC)-area under the curve (AUC) curve, et cetra, showed that InceptionResNetV2 was the best model for DR detection. Mercaldo et al. [14] introduced an approach for the dependable and easily understandable automated detection of DR. The technique encompassed various stages: gathering data that included labeled instances of both healthy and DR-affected eye images; performing preprocessing through Gaussian filtering and cropping to ensure image uniformity; augmenting data to expand the dataset; choosing DL models such as StandardCNN, VGG-16, AlexNet, and MobileNet; conducting model training and testing with assessment metrics like AUC, precision, accuracy, recall, and F-measure; generating interpretive heatmaps using class activation mapping (CAM) algorithms; and assessing robustness using the structural similarity index method (SSIM) to compare CAM heatmap variations.
Some papers have presented hybrid models and ensemble approaches showing significantly improved performance. Wong, Juwono, and Apriono [15] introduced a TL–based framework for automated DR detection and grading using fundus images. The method combines pretrained ShuffleNet and ResNet-18 models to leverage diverse feature representations, followed by an error correction output code (ECOC) ensemble for classification. Adaptive differential evolution (ADE) is employed for simultaneous feature selection and parameter tuning, optimizing classification performance without manual intervention. Evaluations on APTOS and EyePac + Messidor-2 datasets demonstrated competitive accuracy, achieving 96% for APTOS 2-class grading and 75% for EyePac + Messidor-2 3-class grading, showcasing the potential of TL and optimized ensembles in DR diagnostics. Oulhadj et al. [16] combined the modified inception block and capsule network using the pyramid hierarchy of the discrete wavelet transform of the retinal eye image, along with an innovative deep hybrid model that combined the inception block with capsule networks. This system achieved a testing accuracy of 86.54%. Nahiduzzaman et al. [17] proposed a novel automated technique for DR detection using a combination of a parallel CNN (PCNN) for feature extraction and an extreme learning machine (ELM) for classification. Fundus images were preprocessed with contrast limited adaptive histogram equalization (CLAHE) to enhance lesion visibility. The PCNN architecture, designed with fewer parameters and layers than conventional CNNs, minimized the feature extraction time. The model achieved accuracies of 91.78% and 97.27% on the Kaggle DR 2015 (34,984 images) and APTOS 2019 (3662 images) datasets, respectively. Kobat et al. [18] introduced a novel patch-based hybrid approach for automated DR detection using fundus images, employing horizontal and vertical patch division with the DenseNet201 architecture. The method used nonfixed-size patch division to enhance classification performance, coupled with TL to extract deep features and neighborhood component analysis for feature selection. These features were classified using a shallow cubic SVM. The model was evaluated on two datasets: a newly collected three-class dataset (normal, NPDR, and PDR; 2355 images) and the five-class APTOS 2019 dataset (3662 images). For three-class classification, the new dataset achieved accuracies of 94.06% (80:20 validation) and 91.55% (tenfold cross-validation). For five-class classification on the APTOS dataset, the model achieved 87.43% and 84.90% accuracy with the same validation approaches, outperforming prior models on the APTOS dataset by over 2%. The study demonstrates the effectiveness and robustness of the patch-based deep-feature engineering model for DR classification. Chen et al. [19] introduced DR-Net, a two-phased classifier. The first phase used ResNet50 with some modifications to classify NPDR and PDR. The subsequent phase executed the segmentation process of various lesions using a combination of CNN and vision transformer with some modifications, followed by categorization of processed NDPR images using RepVGG. This system obtained 90.75% accuracy on the DDR dataset. Kasim [20] performed CLAHE on images from APTOS 2019, Messidor, and DDR datasets. Due to the unbalanced distribution of features extracted through TL on images, the data was arranged using the synthetic minority over sampling (SMOT) technique. Feature selection was done using minimum redundancy and maximum relevance, and an ensemble classifier was used for classification. The proposed methodology achieved 88.95%, 98.6%, and 97.46% accuracy on APTOS 2019, Messidor, and DDR datasets, respectively, for early diagnosis. Bhuvaneswari and Vaidyanathan [21] trained an ensemble classifier with SVM, Adaboost, and random forest as the base classifiers using the features extracted by CNN for categorization and grading. The accuracy was 95.8% on the E-ophtha dataset and 96.2% for the Messidor dataset. Bilal et al. [22] proposed a novel two-stage approach for automated DR classification. They employed preprocessing techniques, including scaling and green channel extraction, to enhance retinal images. Two U-Net models were utilized for segmenting the OD and BVs. In the second stage, a hybrid CNN–SVD model was applied for feature extraction and dimensionality reduction, followed by DR detection using an Inception-V3 model based on TL. The methodology was tested on EyePACS-1, Messidor-2, and DIARETDB0 datasets, achieving state-of-the-art performance with average accuracies of 97.92%, 94.59%, and 93.52%, respectively. Bilal et al. [23] introduced an advanced AI-driven approach for diagnosing DR, utilizing the hierarchical block attention (HBA) and HBA-U-Net architecture to enhance image segmentation. The multistage method, which includes data preprocessing, feature extraction with a hybrid CNN–SVD model, and classification using ISVM–RBF, DT, and KNN, was tested on the IDRiD dataset. The model achieved exceptional results with 99.18% accuracy, 98.15% sensitivity, and 100% specificity in detecting vision-threatening DR (VTDR), demonstrating a significant improvement in automated DR diagnosis. Bilal et al. [24] presented a novel framework using edge computing and DL, enhanced by 5G technology, for detecting VTDR using retinal fundus images. The framework includes image preprocessing, data augmentation, feature extraction with a hybrid CNN–SVD model, and classification using an enhanced SVM–RBF combined with decision tree (DT) and KNN classifiers through majority voting. Validated on the IDRiD dataset, the model achieved an impressive accuracy of 99.89%, with a sensitivity of 84.40% and a specificity of 100%. The 5G technology facilitated efficient transmission and processing of large image datasets in real-time, enabling quick and accurate analysis.
The following problems can be identified in the existing approaches. Most papers trained their models on a limited dataset without data augmentation, which could have led to underfitting or overfitting. The preprocessing of the images could have been more detailed and elaborate in some papers. Some papers did not use CNN architecture-based models for feature extractions, which have shown exceptional performance when used for this purpose. The testing/validation accuracies obtained in most of the works indicate a scope for improvement.
3. Proposed Methodology
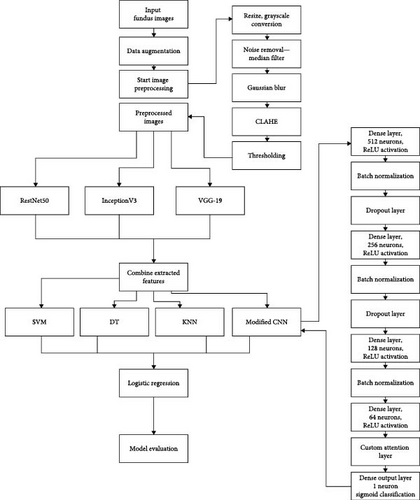
The architecture of the proposed methodology, as shown in Figure 1, depicts a comprehensive approach to DR detection. It involves data acquisition from the ocular disease intelligent recognition (OCIR) dataset, balanced dataset creation, extensive data augmentation, and systematic image processing. Feature extraction using ResNet50, InceptionV3, and VGG-19 and a hybrid attention-based stacking classifier ensemble for final classification ensure robust and accurate predictions.
3.1. Data Acquisition
The OCIR database is an organized dataset containing records of over 5000 patients. It represents a “real-life” collection of patient data accumulated from several different hospitals or medical centers in China by Shanggong Medical Technology. The records contain patient age, color fundus photographs from the left and right eye, as well as doctors’ diagnostic keywords from doctors. It also includes the right and left fundus images of individuals with or without retinal diseases. This dataset is available on Kaggle.
The records have been classified into eight categories: normal eyes, cataracts, pathological myopia, diabetes retinopathy, muscular degeneration, glaucoma, age-related, hypertension, and others.
The “full_df.csv” dataset is made up of 19 columns. “ID” stores the patient’s unique identifier. “Patient-Age” contains the age or years since the patient’s birth. “Patient-Sex” indicates the sex or gender of the patient. Then, we have the “Left-Fundus” and “Right-Fundus” columns, which store the name of the patient’s left and right eye fundus image file. “Left-Diagnostic Keywords” has all the keywords associated with the left eye retinal image of the patient, and “Right-Diagnostic Keywords” has all the keywords associated with the right eye retinal image of the patient. Depending on the diagnosis, these keywords can be cataract, laser spot, normal, et cetera. There are eight columns: “N,” “C,” “M,” ”D,” “A,” “G,” “H,” and “O,” which indicate how the patient’s fundus image has been categorized, as normal eyes, cataract, pathological myopia, diabetes retinopathy, age-related muscular degeneration, glaucoma, hypertension, or others. “file path” columns store the file path for each image. “labels” stores the image category label like N, G, D, et cetera and the “target” column stores the values of “N,” “C,” “M,” “D,” “A,” “G,” “H,” and “O” columns as a vector. “Filename” stores the name of the file.
3.2. New Dataset Creation
Since we have only focused on the fundus images in the diabetes retinopathy and normal categories, a new dataset was created containing an almost identical number of normal fundus images and DR images. It was checked if the keywords in the “Left-Diagnostic Keywords” or “Right-Diagnostic Keywords” columns contained “DR” or “retinopathy.” If they did, they were selected as DR-positive images. For extracting normal images, the “N” column value was used.
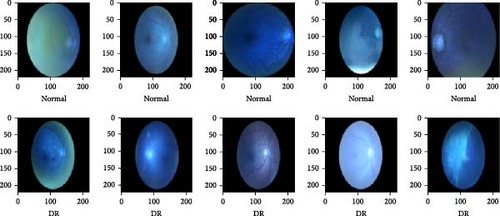
Ninety-six left and right eye images with DR were in the “full_df.csv” dataset. Figure 2 shows the file name of some of the DR images in the dataset, and Figure 3 shows the total count of DR images present. To ensure that the new dataset is balanced, 100 normal fundus images were extracted from the dataset along with the 96 DR images. Figure 4 shows some of the normal fundus images extracted from the dataset. So, the new dataset consisted of a total of 196 fundus images. Finally, all the images were stored in an “organized_dataset” (Supporting Information) directory with two subdirectories—“0” which stores normal images and “1” which stores DR images. Figure 5 shows some of the images from this new dataset.


Analysis of the new dataset of fundus images categorized as DR positive and negative revealed that DR is more common in males than females, with 63.3% of patients being male and 36.7% being female. The age distribution of patients in the new dataset showed that the majority are aged 60–70 (44.2%), followed by those aged 50–60 (26.9%), 40–50 (15.9%), above 70 (7.5%), and below 40 (5.5%).
3.3. Data Augmentation
The need for data augmentation arises from the limited availability of labeled training data, which only encompass part of the range of variability in the target domain. It is especially helpful when DL models are being used, as DL models exhibit superior performance with larger datasets for training the model. It also aims to mitigate overfitting in ML models and improve their generalization capabilities. This technique is particularly valuable in image classification tasks, where a model trained on diverse augmented data is better equipped to handle variations in orientation, lighting conditions, and other factors present in real-world images. Some common methods of image data augmentation are rotating, flipping, cropping, resizing, color jittering, translation, shearing, et cetera.
Since the new dataset contained only 196 images, data augmentation was performed. Algorithm 1: Data augmentation is a combination of various image data augmentation techniques, as discussed by Yang et al. [25]. The input and output directories were specified as “organized_dataset/” and “augmented_dataset/,” respectively. The output directory was created if it did not exist. The function to execute data augmentation on a single image was defined. The image was augmented, including rotation at angles from 0° to 360° with an increment of 100, horizontal flipping, and adding Gaussian noise five times. The defined data augmentation function was applied for images in both classes (“0” and “1”). The augmented images and the original image were stored in the output directory. Therefore, data augmentation created 196 images ∗ (four angle rotated + one horizontally flipped + five Gaussian noise added) = 1960 images, and the output directory finally consisted of 196 original images + 1960 augmented images = 2156 images. The images were saved as .npy files in the output directory. This output directory containing the resultant augmented images is provided as Supporting Information.
-
Algorithm 1: Data augmentation.
-
1: function AUGMENT_IMAGE (image)
-
2: Input:
-
3: image—Input image to be augmented
-
4: Output:
-
5: augmented_images—List of augmented images
-
6: augmented_images ← [image]
-
7: for angle in range (10, 360, 100) do
-
8: rotated ← rotate_image (image, angle)
-
9: augmented_images.append (rotated)
-
10: end for
-
11: flipped ← flip horizontal (image)
-
12: augmented_images.append (flipped)
-
13: for _ in range (5) do
-
14: noisy ← add_gaussian_noise (image, 0, 10)
-
15: augmented_images.append (noisy)
-
16: end for
-
17: return augmented_images
-
18: end function
3.4. Image Processing
Image processing is crucial for DR detection through fundus images as it enhances diagnostic accuracy by extracting subtle abnormalities like microaneurysms and hemorrhages. Image processing techniques aid in segmenting complex retinal structures, facilitating a focused analysis of critical regions for pathology. These processed images allow for a quantitative study to assess disease severity and progression objectively. By leveraging image processing techniques, the detection process becomes more efficient and reliable, aiding early intervention and timely patient care. The importance lies in the ability to uncover critical indicators of DR and ensure a comprehensive approach to detection without the need for complex segmentation processes.
Python’s Opencv library was used to perform image processing. The input and output directories were specified as “augmented_dataset/” and “processed_dataset/,” respectively. The output directory was created if it did not exist. The following image processing techniques were applied for every image of both classes (“0” and “1”), and the resultant processed images were stored in the output directory. This output directory containing the resultant processed images is provided as Supporting Information. Figure 6 shows some of the processed eye images.
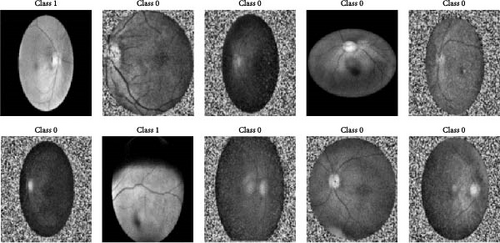
Image resizing is a fundamental image processing task that involves altering the dimensions of an image, either to reduce or enlarge its size. This is commonly done to meet specific requirements. Proper resizing techniques are essential to preserve image quality and aspect ratio, ensuring optimal visual representation across different platforms and applications. In the implementation, all the images were resized to 512 × 512 to maintain uniformity.
Grayscaling is a simple yet powerful image processing technique that involves converting a color or RGB image into shades of gray. This process eliminates color information and retains only the intensity, resulting in a black-and-white representation. Grayscaling simplifies images, reducing complexity and aiding in various computer vision tasks. In this work, the resized RGB images were converted to grayscale.
: output of the median filter at the pixel location (x, y),
(s, t): variables representing the coordinates of pixels within a certain neighborhood around the pixel (x, y),
Sxy: set of neighborhood pixels centered around the pixel at (x, y),
g(s, t): the value of the pixel at coordinates (s, t) in the input image g.
: normalization factor that ensures the total sum of the Gaussian filter’s weights equals 1,
σ: standard deviation of the Gaussian distribution,
e: exponential base of the natural logarithm, approximate value is 2.71828,
(x, y): coordinates of a pixel relative to the center of the Gaussian filter,
: exponent in the Gaussian function, which determines how the weight decreases as the distance from the center increases.
CLAHE proves to be a robust technique for enhancing contrast in images, especially valuable in medical imaging scenarios like the analysis of DR. The image is divided into small, overlapping tiles, and the histogram equalization is applied independently to each tile in the CLAHE methodology. This adaptive approach prevents overamplification of noise in regions with low contrast. The contrast enhancement achieved by CLAHE is especially beneficial in highlighting subtle features in DR images, where detailed examination is crucial for accurate diagnosis. By limiting the contrast enhancement locally, CLAHE ensures a balanced enhancement across the entire image, avoiding artifacts and maintaining a natural appearance. The algorithm is widely employed to enhance the visibility of retinal structures and abnormalities, improving diagnostic accuracy in medical image analysis. In this implementation, a CLAHE object was created with a grid dimension of (8, 8) for tiles and a threshold of 2.0 using the OpenCV library. Subsequently, the image that had undergone Gaussian blurring was utilized as the input, and CLAHE was applied to produce a contrast-enhanced image.
In the process of thresholding, an essential step in image analysis, pixel values in an image are categorized based on a specified threshold value. This categorization helps to create a binary image, where pixels with values above the threshold are assigned one intensity (commonly white), and those below the threshold are assigned another intensity (typically black). This technique is pivotal in segmenting images and separating objects or features from the background. The thresholding process aids in highlighting regions of interest, such as lesions or anomalies in medical images like those in DR analysis. Thresholding contributes significantly to image interpretation and subsequent computational analysis by effectively distinguishing between foreground and background elements, playing a crucial role in diverse fields, including computer vision and medical imaging. This work obtained the thresholded image by applying Otsu’s thresholding method to the contrast-enhanced image created using CLAHE. This method is valuable for automatically determining an optimal threshold, particularly beneficial in scenarios where the image’s histogram may not have a distinct separation between foreground and background intensities.
3.5. Feature Extraction
The methodology or process of transforming or changing raw data into a set of meaningful and representative features, highlighting relevant information for a given task, is known as feature extraction. Feature extraction in image processing refers to the process of capturing and representing important information from images to facilitate analysis or pattern recognition. It involves transforming raw pixel data into a more meaningful and compact set of features. Feature extraction is crucial in processes such as image classification, object detection and recognition, and computer vision, as it helps reduce dimensionality and highlight relevant information for further analysis or ML models.
In DR, fundus examination reveals several characteristic signs. Microaneurysms, which are tiny bulges in the retinal BVs that can leak fluid, often represent the earliest visible indication of the disease. Hemorrhages occur when BVs rupture, causing dark spots or streaks on the retina, signaling disease progression. Hard exudates appear as yellowish-white deposits of lipids and proteins due to leakage from BVs, frequently forming a ring-like pattern. Cotton wool spots, or soft exudates, are white and fluffy patches resulting from microinfarctions in the nerve fiber layer, indicating localized retinal ischemia. Intraretinal microvascular abnormalities (IRMAs) are dilated and tortuous BVs within the retina that often precede PDR. Venous changes, such as beading or looping of the retinal veins, indicate increased retinal blood flow and pressure. Arterial changes involve the narrowing or alteration of retinal arteries, typically linked to chronic high blood pressure and diabetic damage. Finally, neovascularization, the formation of new and fragile BVs on the retina or OD, can lead to severe vision loss due to their propensity to bleed if left untreated.
Unlike existing methods that often rely on a single model for feature extraction from the images from the “processed_dataset” directory, our approach integrates features from three different pretrained RestNet50, InceptionV3, and VGG-19 models to ensure that all the signs of DR are taken into consideration. The features obtained from these models were combined into a single feature metric and used for classification. This matrix represents a rich and diverse set of features extracted from the retinal images, encompassing both local details and broader patterns.
The above models used global average pooling, which condensed spatial information in the final convolutional layer, facilitating a more compact representation. The models are typically pretrained on large datasets like ImageNet and then fine-tuned on a DR dataset to make them sensitive to these specific features. Intermediate layers of these models capture various patterns and textures at different levels of abstraction. The exclusion of fully connected layers made the models suitable for feature extraction. This was achieved by setting the include_top parameter as false. The expected dimensions of input images were specified using the input_shape parameter.
The InceptionV3 model was developed by researchers at Google and introduced in 2015. It was characterized by its innovative use of inception modules, which incorporated parallel convolutional operations of different filter sizes. A significant advancement at the time, InceptionV3 excelled in capturing diverse features at various scales within an image, promoting richer representations for image classification tasks. InceptionV3, with its multiscale convolutions in Inception modules, captures features at different scales, allowing for the detection of diverse features like microaneurysms, hemorrhages, neovascularization, and cotton wool spots due to its varied receptive fields. This model extracts low (edges in different orientations), mid (basic geometric shapes and contours), and high-level features (complex structures and patterns) by combining different convolutional filter sizes within the same module, enabling a comprehensive analysis of the images.
ResNet50 is a deep CNN with 50 layers, renowned for its proficiency in image classification tasks. It introduces residual blocks with identity shortcut connections, mitigating the vanishing gradient problem. The model employs a bottleneck architecture for computational efficiency. Its innovative design, featuring residual connections, has influenced the development of subsequent deep neural network architectures. ResNet50, utilizing residual blocks, retains important features at various depths, enhancing the capture of hierarchical features such as venous and arterial changes and IRMA, while reducing the risk of vanishing gradients. It extracts both mid and high-level features, as the residual connections allow information to flow through multiple layers without degradation.
The VGG-19 model, a variation of the CNN model, originated from the VGG at the University of Oxford and was introduced in 2014. Renowned for its simplicity and depth, the architecture comprised 19 weight layers using small filters of 3 × 3 convolutional kernels. The model’s strength lies in its ability to learn intricate hierarchical features from input images, contributing to its success in several computer vision processes or tasks, particularly image categorization. VGG-19 fulfilled a central role in the evolution of DL architectures, influencing subsequent models due to its straightforward design and effectiveness in feature extraction. VGG-19, with its deep and uniform architecture, effectively captures detailed features in preprocessed images, making local features like microaneurysms, hard exudates, and hemorrhages more prominent. This model primarily extracts high-level features like complex structures and patterns due to its deep layers, which progressively abstract and refine image details.
Feature scaling is a data preprocessing technique in ML that entails transforming the numerical values of different features into a standardized range. The goal is to ensure that each feature contributes equally to the learning process of ML algorithms. Common methods for feature scaling include normalization, where values are scaled to a range between 0 and 1, and standardization, standardizing the data with a mean of 0 and a standard deviation of 1. In this paper, standardization was performed to the combined extracted features to ensure consistent scaling. This was done using the Standard Scalar available in Python’s scikit-learn library. This process involved subtracting the mean of each feature from its individual values and dividing by the standard deviation. The standardized features obtained had a mean of zero and a variance of one, aiding in the normalization of diverse features to a uniform scale. Figure 7 shows the shape of the feature matrix with 2156 labels.

3.6. Train–Test Split
The train–test split is a fundamental step in assessing the performance of ML and DL models. By partitioning the dataset into a testing set and a training set, it enables the model to learn from one subset and be evaluated on another. This practice helps ensure the model’s ability to generalize effectively to new and unseen data, a crucial aspect of its practical utility. During training, the model refines its parameters based on the patterns in the training set. The test set then serves as a proxy for real-world scenarios, allowing us to gauge how effectively the model can predict new and unseen instances. This evaluation assists in pinpointing potential issues or problems, such as overfitting or underfitting, guiding decisions regarding model refinement.
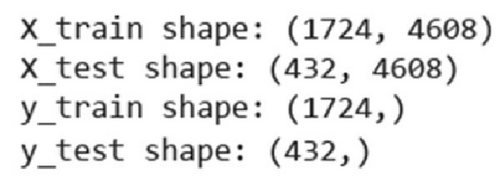
This paper uses an 80–20 train–test split, assigning 80% of the data for training the models and classifiers and setting aside the remaining 20% for testing their performance. Additionally, a random seed of 42 was set to ensure reproducibility. Every time the dataset is split, the same subsets are generated, enabling consistent results across different executions. Figure 8 shows the dimensions of the train and test datasets created by the split.
3.7. Classification/Detection
In DR, classification involves determining whether an eye image exhibits signs of DR. This process typically employs ML or DL algorithms trained on a labeled image dataset. Ensemble methods, especially Stacking ensembles, have not been explored much for DR detection in the existing methods. A stacking classifier combines multiple base classifiers to enhance predictive performance. This ensemble technique involves training a metaclassifier on the outputs of diverse base classifiers, leveraging their complementary strengths. Stacking improves generalization by learning to combine the predictions of individual models effectively. It improves predictive performance, leverages complementary strength, reduces overfitting, and provides versatility and flexibility.
Our proposed methodology employs a custom hybrid attention-based stacking ensemble. ML or ML models, like SVM, KNN, and DT, and DL or DL models, like modified CNN with spatial layer, were employed as the base classifiers. The metalearner used was logistic regression. First, a HybridAttentionStackingEnsemble class was initialized with the base learners, logistic regression as the metalearner, and a fivefold cross-validation setup. During the fitting process, the training data was split into folds, and each base learner was trained on the training folds and validated on the validation fold, capturing predictions. The reliability of each base learner was assessed by averaging the accuracy scores across all folds, storing these as reliability scores. The predictions of each base learner were compiled into a metafeature matrix, which was then used to train the logistic regression metalearner. For making predictions, the metafeatures for the test data were created by compiling the predictions from each base learner. These metafeatures were weighted by the previously computed reliability scores, and the final prediction was made by the metalearner. The model was trained on the training dataset and used to predict the test dataset labels. The accuracy of the predictions was then evaluated.
x: independent variable or predictor,
p(x): the predicted probability that the dependent variable y equals 1 (i.e., the event of interest occurs), given the input x,
e: base of the natural logarithm, approximate value is 2.71828,
β0: intercept term (also known as the bias) in the logistic regression model,
β1: coefficient (also known as the weight) associated with the independent variable x.
The base classifiers were defined as follows: a KerasClassifier representing a CNN base model with attention, an SVM classifier configured with parameters C = 1.0, kernel = “rbf,” gamma = “scale,” and class_weight = “balanced,” a DecisionTreeClassifier with criteria “gini,” maximum depth as “None,” and minimum samples split as 2, and a KNeighborsClassifier with parameters n_neighbors = 5, weights = “uniform,” p = 2, and leaf_size = 30. The base classifiers were trained on the training data: the CNN base model with 10 epochs and a batch size of 32, the SVM classifier, the DT classifier, and the KNN classifier.
DTs are a popular and interpretable ML classifier or algorithm for classification and regression tasks. In the context of DR detection, DTs prove valuable for their capability to handle complex datasets with diverse features. A DT recursively partitions the input space based on the most informative features, creating a tree-like structure of decision nodes and leaves. Every decision node represents a feature and a corresponding decision rule, while the leaves denote the predicted outcome. DTs are adept at capturing nonlinear relationships and interactions between variables, making them suitable for medical image analysis.
KNNs or KNN is a versatile and intuitive ML classifier or algorithm commonly employed in various applications, including DR detection. In the context of analysis of medical images, KNN operates on the principle of proximity, where an unseen data point is classified or categorized based on the majority category of its KNNs within the feature space. For DR, KNN can effectively capture local patterns and similarities in retinal images, making it suitable for tasks where neighboring pixel information is significant. One notable advantage of KNN lies in its simplicity and ease of implementation. In the realm of DR, KNN can provide a straightforward and interpretable approach to image classification.
SVM or SVMs are powerful classifiers widely applied in various domains, including DR detection. SVM excels in binary classification tasks, striving to identify the optimal hyperplane that maximally separates distinct classes within the feature space. In the backdrop of retinal image analysis, SVM can successfully discern complex patterns and structures associated with DR. One key strength of SVM lies in its capability to handle high-dimensional data, making it well-suited for tasks where numerous features represent images. SVMs are particularly effective in capturing nonlinear relationships using kernel functions, enabling them to operate in more complex feature spaces.
- 1.
Dense layer with 512 neurons and ReLU activation.
- 2.
Batch normalization layer.
- 3.
Dropout layer for regularization.
- 4.
Dense layer with 256 neurons and ReLU activation.
- 5.
Batch normalization layer.
- 6.
Dropout layer for regularization.
- 7.
Dense layer with 128 neurons and ReLU activation.
- 8.
Batch normalization layer.
- 9.
Dropout layer for regularization.
- 10.
Dense layer with 64 neurons and ReLU activation.
- 11.
Custom attention layer (SpatialAttentionLayer).
- 12.
Dense output layer with one neuron and sigmoid activation for binary classification.
-
Algorithm 2: Custom spatial attention layer.
-
1: function INITIALIZE_SPATIAL_ATTENTION_LAYER (inputs)
-
2: Input:
-
3: inputs—The input tensor with spatial dimensions
-
4: Output:
-
5: kernel—The weight matrix for the attention layer
-
6: filters = inputs.shape[−1] # Get the number of filters from the input
-
7: kernel = glorot_uniform ((filters, 1)) # Glorot uniform initializer
-
8: end function
-
9: function FORWARD_PASS (inputs)
-
10: Input:
-
11: inputs—The input tensor with spatial dimensions
-
12: Output:
-
13: output—The output tensor after applying spatial attention
-
14: attention_weights = matrix_multiplication (inputs, kernel)
-
15: attention_weights = softmax (attention_weights, axis = 1) # Normalize along 2nd axis
-
16: output = inputs ∗ attention_weights # element-wise multiplication
-
17: end function
-
19: return FORWARD_PASS (inputs) # Call forward pass during usage
3.8. Evaluation
Evaluation metrics serve as quantitative benchmarks for assessing the efficacy of ML models. In this research, the effectiveness of the proposed system underwent scrutiny using standard performance metrics, including the confusion matrix, accuracy, precision, F1 score, recall, ROC curve, and AUC curve.
3.8.1. Confusion Matrix
Employed in classification tasks, a confusion matrix is a tabular representation essential for appraising a ML model’s performance. This matrix furnishes a detailed breakdown of the model’s predictions, classifying them into true positives (TP; accurately predicted positives), true negatives (TN; accurately predicted negatives), false positives (FP; incorrectly predicted positives), and false negatives (FN; incorrectly predicted negatives). As a fundamental tool, the confusion matrix forms the basis for computing diverse evaluation metrics such as accuracy, precision, recall, and F1 score.
3.8.2. Accuracy
3.8.3. Precision
3.8.4. Recall
3.8.5. F1 Score
3.8.6. ROC–AUC Curve
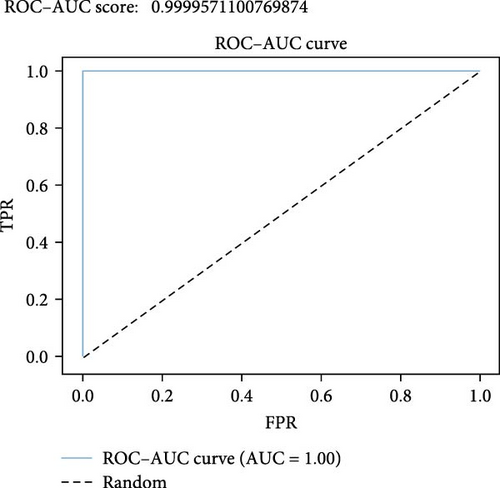
ROC and AUC are widely used metrics in binary classification tasks to evaluate model performance. The ROC curve visually depicts the model’s TPR (sensitivity) versus its FP rate (FPR; 1 − specificity) across various threshold settings. This graphical representation illustrates the balance between sensitivity and specificity, assisting in choosing an optimal threshold based on specific problem requirements. The AUC calculates the area beneath the ROC curve, providing a singular numerical value that summarizes the overall effectiveness of the model.
4. Results and Discussion
The attainment of high accuracies can be attributed to the judicious application of image processing techniques and the usage of DL models for feature extraction. Image Processing techniques such as Gaussian blur ensured data normalization, reducing noise for a standardized input. The contrast enhancement technique CLAHE improved the visibility of subtle details crucial for DR detection. Thresholding, precisely Otsu’s method, aided in precise segmentation. Combining features extracted from ResNet50, InceptionV3, and VGG-19 into a single matrix provided a holistic representation of the fundus images. This fusion of features allowed the model to capture a wide range of information, from basic structures to intricate details, leading to a comprehensive understanding of the ocular images. The diversity of these models in terms of architecture and training strategies contributed to a more robust feature set, enhancing the overall performance of the subsequent classification models.
The methodology was structured around utilizing various models for classifying ocular diseases (Table 1), each playing a role in the overall performance. The performance of the SVM or SVM gained an accuracy of 98.03%, indicating effective learning and generalization to the test set. KNN, a simpler algorithm, demonstrated a reasonable accuracy of 90.95%, serving as a baseline model. The DT model, with an accuracy of 87.12%, revealed interpretability, but hinted at potential overfitting. The modified CNN with a spatial attention layer outperformed other models with an accuracy of 99.31%, indicating the effectiveness of the spatial attention layer highlighting crucial spatial features.
| Model | Accuracy (%) |
|---|---|
| Support vector machine (SVM) | 98.0279 |
| K-nearest neighbors (KNNs) | 90.9521 |
| Decision tree (DT) | 87.1235 |
| Modified convolutional neural network (CNN) | 99.3055 |
| Proposed hybrid stacking ensemble | 99.7685 |
The proposed hybrid attention-based stacking ensemble combines the predictions of the above models with the help of the logistic regression model in a unique way. This ensemble leverages individual models’ strengths and weighs the predictions of base learners based on their reliability, which can be dynamically adjusted. The ensemble approach results in improved accuracy, robustness, and generalization of new data. By combining different types of models (traditional ML and DL), the stacking ensemble captures a diverse range of information from the dataset. Including diverse models, both conventional and DL, provides a comprehensive view of the dataset. Each model type captures different aspects of the data, contributing to a more robust solution.
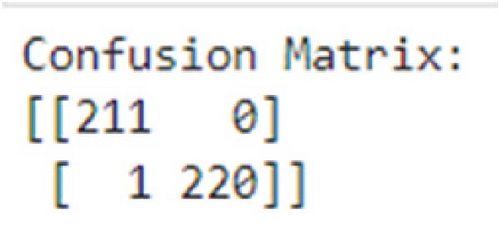
As in Figure 9, the confusion matrix indicates an excellent performance with minimal misclassifications. The stacking model achieved a high number of TP and TN, demonstrating its capability to identify both negative and positive instances correctly. The low values in the FP and FN entries suggest vital precision and recall.
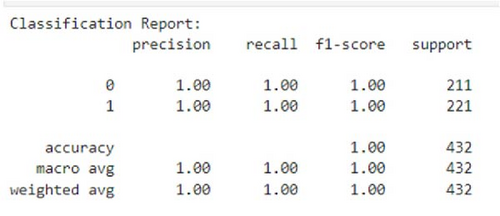
The classification report, as shown in Figure 10, reaffirms the exceptional performance of the stacking ensemble classifier. The near-perfect F1 score, precision, and recall scores for both categories indicate that the model achieved a balance between minimizing FP and FN.
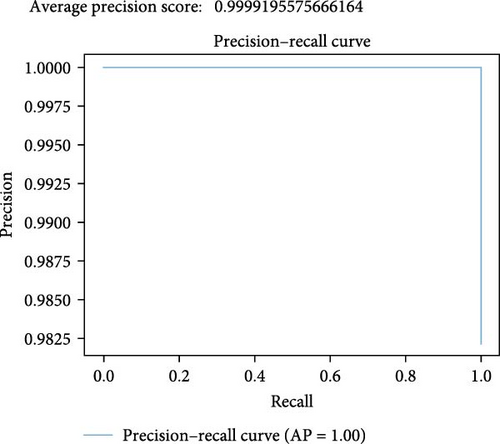
The remarkable average precision score of 0.9999 indicates an extremely high level of precision in classifying positive cases, highlighting the stacking ensemble’s capability to minimize false (wrong) positives and maximize true (correct) positives. The top-right corner (high precision and high recall) region, as achieved in our precision–recall curve shown in Figure 11, is the ideal scenario where both precision and recall are high. It shows that the model or the classifier successfully identifies the most relevant instances (high recall), while minimizing FP (high precision).
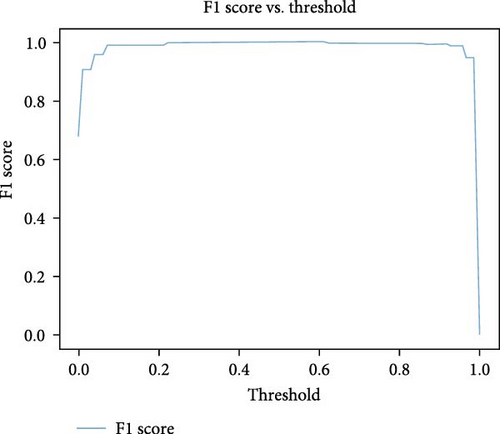
As seen in the F1 vs. threshold plot in Figure 12, the model achieves very high F1 scores, demonstrating a favorable equilibrium between precision and recall at specific thresholds. Thresholds around 0.28–0.96 are associated with optimal F1 scores, suggesting a robust performance in those ranges. The model demonstrates sensitivity to threshold adjustments, and performance varies across threshold values. The stacking model exhibits a commendable F1 vs. threshold graph, showcasing a solid ability to balance precision and recall at optimal thresholds, indicative of its robust performance in binary classification.
The ROC–AUC plot shown in Figure 13 and a score of 0.9999 indicate an exceptionally high performance of the stacking ensemble in distinguishing between TPR and FPR. This near-perfect score suggests that the model has achieved an outstanding ability to discriminate between different classes, demonstrating robustness and effectiveness in DR detection.
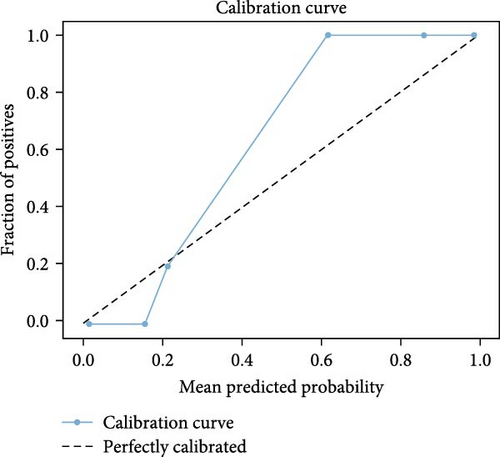
The calibration curve in Figure 14 shows that the model performs well in higher probability ranges (0.6–1), achieving a TPR of 1. Instances with predicted probabilities around 0.6, 0.9, and 1 are likely TP. However, the model shows weaker calibration in the lower probability range (0–0.2). At lower predicted probabilities, the model’s TPR is lower (0–0.2). This suggests that the model is quite good and reliable, especially in scenarios where it predicts higher probabilities. However, there is room for improvement in the lower probability range to enhance its reliability across all prediction levels.
The performance of our proposed methodology can be further justified by computing the confidence interval (CI) and statistical significance testing. Total number of instances (N) is the sum of TP, TN, FP, and FN and can be calculated as N = TP + FP + FN + TN = 211 + 0 + 1 + 220 = 432. To find the 95% CI for accuracy, the standard error (SE) of accuracy can be calculated as follows: , where Acc is the accuracy of the proposed model. The CI is given by CI = Acc ± Z × SE . For a 95% confidence level, Z≈1.96. Putting in the values, we get a CI of 99.30% and 100.24%. This interval suggests that we are 95% confident that the true accuracy of the model lies within this range.
For statistical significance testing, we have considered z-test. To perform z-test, we consider that the null hypothesis (H0) states that the true accuracy is 99.5% (expected accuracy = 99.5%) and alternative hypothesis (H1) states that the true accuracy is significantly different from 99.5%. The value of z is given by: z = (Acc − Expected/Accuracy) ÷ SE. The z-test indicates that the observed accuracy of 99.77% does not significantly differ from an expected accuracy of 99.5%. This means that based on the statistical test, there is no strong evidence to reject the hypothesis that the true accuracy could be as low as 99.5%. In other words, the observed accuracy of 99.77% aligns well with the expected accuracy of 99.5% within a reasonable confidence level.
5. Conclusion
In DR detection, our proposed methodology represents an innovative approach that addresses the documented challenges within the existing literature. The introduction emphasizes the criticality of early detection and timely treatment for DR, a condition with potential implications for vision loss if not promptly addressed. The proposed methodology introduces a hybrid framework to tackle this issue, seamlessly integrating advanced DL algorithms with robust image processing techniques. Our methodology includes strategic utilization of a diverse dataset, the implementation of data augmentation for rigorous model training and meticulous documentation of image preprocessing steps. The integration of cutting-edge CNN models, including ResNet50, InceptionV3, and VGG-19, underscores our commitment to leveraging state-of-the-art technologies for feature extraction.
The obtained results from our proposed methodology unveil noteworthy achievements. Individually, SVM, KNN, DT, and the modified CNN with a spatial layer achieved accuracies of 98.03%, 90.95%, 87.12%, and 99.03%, respectively. The proposed hybrid attention-based stacking ensemble, with base models SVM, KNN, DT, and a modified CNN, reached an accuracy of 99.768%, surpassing reported accuracies in the literature and establishing a new benchmark for DR detection. F1 score, precision, and recall for both DR positive (1) and DR negative (0) classes approaching near-perfect scores, rounded off to 1.00, highlight the reliability of our approach. This high level of performance suggests that our proposed methodology can reliably and accurately identify DR from retinal images, which has significant implications for early diagnosis and treatment. By integrating features from multiple pretrained CNNs and utilizing a hybrid attention-based stacking ensemble method, our approach offers a robust and comprehensive solution that can enhance screening processes, reduce the burden on healthcare professionals, and potentially improve patient outcomes through timely intervention.
Significantly, introducing a hybrid attention-based stacking ensemble, an innovative variation to the existing stacking ensemble technique, emphasizes the forward-thinking nature of our methodology. By amalgamating the strengths of diverse models, we not only surpass reported accuracies but also highlight the effectiveness of ensemble approaches in enhancing diagnostic accuracy and robustness. However, the computational complexity and resource requirements of our hybrid model might serve as a limitation, which might restrict its deployment in resource-constrained settings. Addressing this limitation would require exploring ways to reduce the model’s computational demands.
Disclosure
The study was conducted as part of the authors’ independent work.
Conflicts of Interest
The authors declare no conflicts of interest.
Funding
This research did not receive any specific grant from funding agencies in the public, commercial, or not-for-profit sectors.
Supporting Information
Additional supporting information can be found online in the Supporting Information section.
Open Research
Data Availability Statement
The dataset used in this study is publicly available and can be accessed from Kaggle. The specific dataset utilized is the Ocular Disease Recognition Dataset, available at the following URL: https://www.kaggle.com/datasets/andrewmvd/ocular-disease-recognition-odir5k. The organized data, augmented image data, and processed image data are available in the supporting information files.


