Evapotranspiration and Crop Coefficient for Haricot Bean (Phaseolus vulgaris L.) Using Nonweighing Lysimeter Under Semiarid Climate of Melkassa, Ethiopia
Abstract
The primary objective of irrigated agriculture is to produce crops with the help of irrigation. This field study was conducted during the 2017 and 2018 cropping seasons at the experimental farmland of Melkassa Agricultural Research Center, Ethiopia. The actual crop evapotranspiration and crop coefficient for the haricot bean were determined from nonweighing lysimeter studies. The soil–water balance approach was applied to compute the actual crop evapotranspiration of the haricot bean, whereas the reference evapotranspiration was computed with the help of the Penman–Monteith method. The crop coefficient was obtained from the ratio between the measured crop evapotranspiration and the reference evapotranspiration. The seasonal crop evapotranspiration for the haricot bean was 493.0 and 410.1mm during the experimental period of 2017 and 2018, respectively. The mean crop evapotranspiration for the haricot bean over the two experimental years was 451.6 mm. The mean locally produced actual crop coefficient values were 0.5 at the initial stage, 1.16 during the mid-season stage, and 0.67 at the end-season stage. The average FAO-adjusted Kc value over the two experimental years was 0.41 at the initial stage and 1.14 during the mid-season. The FAO-adjusted crop coefficient Kc values slightly differed from the crop coefficient Kc values developed. The findings provide valuable insights for enhancing the design and management of irrigated haricot bean production in the region. The specific crop coefficient Kc values determined for different growth stages are crucial for optimizing irrigation scheduling and improving water-use efficiency, contributing to sustainable haricot bean production in the semiarid environment.
1. Introduction
Knowledge of crop evapotranspiration (ETc) is crucial for enhancing water-use efficiency, improving yield, and enhancing yield quality. The haricot bean is a significant cash crop that is widely cultivated in Ethiopia, with altitudes ranging between 1400 and 2000 m above sea level [1]. After coffee and sesame, it is the third most valued export product, accounting for 9.5% of total agricultural exports [2]. According to Laike et al. [3], approximately 60% of Ethiopia’s haricot bean production comes from the Middle Rift Valley of Ethiopia. It is an essential food crop in many parts of Eastern and Southern Africa, including Ethiopia [4]. Farmers grow crops during periods of intermittent rainfall, making it the second most significant cash crop after tef [5].
Haricot bean is an important source of protein and cash for smallholder farmers in Ethiopia [6, 7] and helps fix nitrogen in the soil [8]. The average national yield of the haricot bean in Ethiopia under rainfall is 1.72 tons/ha [5], and is expected to increase under irrigation. However, its yield potential varies based on variety, soil fertility, and climate conditions. Murut et al. [6] reported the yield performance of four haricot bean varieties under both irrigation and rainfed conditions, including Awash–Melka—2.07 ton/ha (irrigation) and 1.9 ton/ha (rainfed), Awash—1:2.3 ton/ha (irrigation) and 1.65 ton/ha (rainfed), Mexican—142:2.05 ton/ha (irrigation) and 1.65 ton/ha (rainfed), Argen—1.56 ton/ha (irrigation) and 1.7 tone/ha (rainfed), and Chore—2.45 ton/ha (irrigation) and 1.96 ha/ton (rainfed). The authors concluded that the maximum yield was obtained under irrigation conditions for all the varieties. This is because of supplying the required amount of water to the crop based on their needs. Hence, to enhance crop production, water should be applied according to the evaporation demand of the crop (ETc).
Estimating crop evapotranspiration (ETc) is indispensable for irrigation scheduling, irrigation system design, and hydrological studies [9]. A widely recognized method for predicting crop evapotranspiration for irrigation scheduling is outlined in the FAO’s Irrigation and Drainage Paper No. 56 [9]. This method relates ETc to ETo by considering an appropriate crop coefficient (Kc). The standard values of Kc for various crops are given by Doorenbos and Pruitt [10] and Allen et al. [9] and subsequently updated by Pereira et al. [11]. However, local calibration of Kc values is essential for precise water management before utilizing them to estimate ETc [12]. Water balance experiments employing different types of lysimeters were performed to measure the actual estimates of ETc [13].
A lysimeter (weighing and nonweighing type) is an accurate tool for measuring the major components of the hydrological water balance [14]. It measures the amount of water loss due to drainage, transpiration, and evaporation from cropped lysimeters and is then used to calibrate the Kc values [15, 16]. Area-specific Kc values were then developed to predict ETc from the ETo. Numerous approaches have been proposed to calculate the reference evapotranspiration. In 1948, Penman introduced the original ETo equation, which was subsequently modified by several other researchers [16–18]. The FAO-56 Penman–Monteith technique, after modification, is the only standardized approach capable of yielding satisfactory ETo outcomes across diverse climatic scenarios.
This study was conducted in the semiarid region of the Awash Basin in Ethiopia, an area known for its scarce water resources and inefficient irrigation water management. With water demand surpassing supply, the basin is currently experiencing significant water stress [19]. This region faces an escalating challenge of water insecurity [20], highlighting the critical importance of precise irrigation management [21]. This issue is further exacerbated by the Ethiopian government’s recent commitment to increasing agricultural production, primarily through the expanded use of irrigation, placing additional strain on the already limited water resources.
Some studies have investigated the evapotranspiration of haricot beans in different parts of the world. Otoro and Hatiye [22], in the Arba Minch Southern Ethiopia, reported the haricot bean (Hawassa Dume variety) evapotranspiration under full irrigation treatments. Alipour et al. [23], in Afghanistan, provided common bean evapotranspiration under full irrigation treatments in clay loam soil texture. Other researchers, Laike et al. [3] in Melkassa, Ethiopia, reported lysimeter-based evapotranspiration and crop coefficient Kc of the haricot bean during the cool season. The current study focused on the Awash–Melka cultivar, a multidisease resistant cultivar that consistently outperforms other varieties, such as Awash-1, Mexican-142, and Argen, in terms of yield and resilience, making it a promising choice for farmers under irrigation conditions in Ethiopia [6]. The Awash–Melka variety has intermediate maturity, better yield, and adaptability to local conditions, making it well-suited for low-to-mid altitude haricot bean growing areas under irrigation conditions [6]. Additionally, in contrast to earlier research, this study focused on the dry season, which is the time when less water is available, highlighting the particular difficulties associated with water shortages in the area. Therefore, this study aimed to determine the evapotranspiration and crop coefficient Kc of the Awash–Melka variety under irrigated conditions in the water-limited semiarid Awash Basin, Ethiopia, to support effective irrigation water management in the region.
2. Materials and Methods
2.1. Study Area
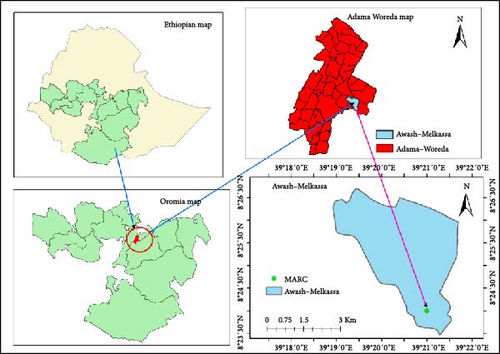
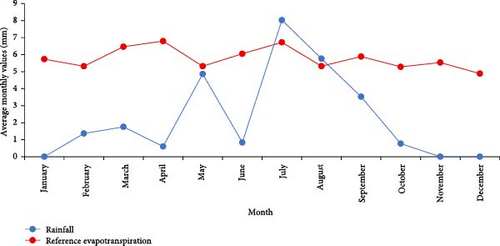
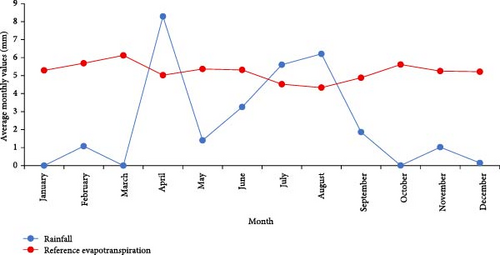
The field study was conducted at the Melkassa Agricultural Research Center, Ethiopia (8°24′N and 39°21′E; Figure 1). The area is characterized by semiarid tropical climatic conditions with two distinct seasons. The wet season occurs mainly between June and September, while the dry season is experienced during the remaining months of the year, with few rain events from March to May. The long-term (1977–2018) average minimum and maximum temperatures varied from 13.8 to 28.7°C. The area received a mean annual rainfall of 825 mm during the same period. From 1977 to 2018, the mean annual wind speed and ETo in the area varied between 0.3 and 2.71 m s−1 and 3.8 and 5.42 mm day−1, respectively. Figure 2a,b displays the recorded seasonal rainfall and computed reference evapotranspiration for 2017 and 2018, using the FAO Penman–Monteith equation, which provides insights into the area’s water budget. The data highlights a significant rainfall deficit and high evapotranspiration demand throughout the year, except for the period between late June and early September. This highlights the crucial importance of irrigation in agricultural production, especially during dry seasons. The soil in the study area belonged to the clay loam soil texture class. The soil’s water content at field capacity (FC) on a weight basis ranged from 31.80% to 32.89%, and the permanent wilting point (PWP) ranged from 20.89% to 22.41%. The bulk density ranges from 1.12 to 1.14 g cm−3. The average soil pH and electrical conductivity (EC) of the lysimeter plots were 6.50 and 1.64 dS m−1, respectively, while the total nitrogen content was 0.09%. The detailed soil and weather characteristics of the study area are presented in Tables 1 and 2.
| Soil depth (cm) | Texture | FC% (w/w) | WP% (w/w) | AWC (mm/15 cm) | BD (g cm−3) |
|---|---|---|---|---|---|
| 0–15 | Clay loam | 31.80 | 20.89 | 18.33 | 1.12 |
| 15–30 | Clay loam | 32.62 | 22.22 | 17.47 | 1.12 |
| 30–45 | Clay loam | 32.89 | 22.33 | 17.90 | 1.13 |
| 45–60 | Clay loam | 32.07 | 22.41 | 16.52 | 1.14 |
| 60–90 | Clay loam | 32.05 | 21.74 | 17.54 | 1.14 |
- Note: FC and WP are soil moisture contents at field capacity and wilting point on a weight basis, AWC is available water content in mm per 15 cm soil depth, and BD is the soil bulk density.
| Month | Tmean (°C) | RHmean (%) | Ave. u2 (m s−) | Ave. Rs (MJ m2 day−1) | Eff. rainfall (mm) | Ave. ETo (mm day−1) |
|---|---|---|---|---|---|---|
| 2017 | ||||||
| Jan | 17.6 | 41.23 | 2.84 | 22.83 | 0 | 5.73 |
| Feb | 22.5 | 55.61 | 2.95 | 21.49 | 17.4 | 5.32 |
| Mar | 23.95 | 46.13 | 2.71 | 23.93 | 24.6 | 6.47 |
| Apr | 24.22 | 46.17 | 2.99 | 24.83 | 5.8 | 6.80 |
| May | 23.51 | 60.10 | 2.27 | 22.00 | 70.3 | 5.32 |
| Average | 22.36 | 49.85 | 2.75 | 23.02 | — | 5.93 |
| Total | — | — | — | — | 118.1 | — |
| 2018 | ||||||
| Jan | 18.46 | 45.61 | 2.69 | 21.66 | 0 | 5.29 |
| Feb | 21.99 | 48.71 | 2.67 | 21.70 | 10.8 | 5.69 |
| Mar | 23.33 | 44.35 | 2.61 | 22.82 | 0 | 6.12 |
| Apr | 23.16 | 59.73 | 1.93 | 20.87 | 147 | 5.02 |
| May | 23.04 | 57.35 | 2.41 | 21.49 | 11.4 | 5.37 |
| Average | 22.00 | 51.15 | 2.46 | 21.71 | — | 5.50 |
| Total | — | — | — | — | 169.20 | — |
2.2. The Lysimeter Design and Layout
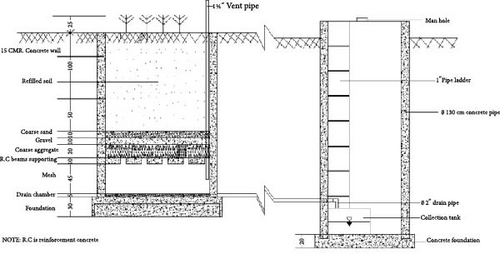
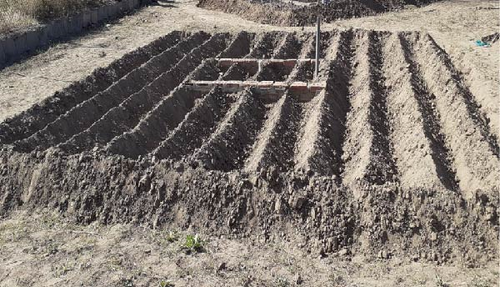
Two lysimeters were used to measure the ETc and compute the Kc of the haricot bean. The first lysimeter had an internal planting area of 2 m2, whereas the second lysimeter had an area of 4 m2. The overall depth of the lysimeters measured 2.6 m, comprising a 1 m effective soil depth along with an extra 1 m layer, 0.2 m of rock, 0.2 m of gravel, and 0.2 m of sand pack underneath (Figure 3a,b). The total area of the lysimeter was 36 m2 (6 m× 6 m), including the internal area. The outside area of the lysimeter was used as a buffer zone and access space to minimize external influences. To drain the excess water, the access chamber in each lysimeter was linked to an underground steel pipe. The lysimeter rims were placed 0.1 m above the soil surface to prevent surface runoff from entering the lysimeter during rainy days. Access tubes were inserted up to an effective root depth of 1 m to monitor the soil moisture level inside the lysimeters. The selection of two different lysimeter sizes was to assess the potential influence of lysimeter size on the estimation accuracy of crop evapotranspiration (ETc) and crop coefficient (Kc). Smaller lysimeters, which are easier to construct and manage, are more susceptible to edge effects. Larger lysimeters help to reduce such effects and more accurately simulate actual field conditions. By combining the data obtained from both lysimeters, the study aimed to develop consistent and reliable ETc and Kc values at local conditions.
2.3. Crop Agronomic Practice
The haricot bean cultivar Awash–Melka was grown during two consecutive cropping seasons in 2017 and 2018 on clay loam soil. The seeds were sown in February 2017 and March 2018, in and out of the lysimeter areas. The Awash–Melka variety has intermediate maturity, better yield, and adaptability to local conditions, making it well-suited for low-to-midaltitude haricot bean growing areas under irrigation conditions [6]. Before sowing, the two lysimeters were designed to have the same moisture content. The spaces between rows and plants were 60 and 10 cm, respectively [24]. All recommended agronomic practices (fertilization, weed management, pest control, etc.) were consistently applied within the lysimeter and in the surrounding area. The recommended fertilizer rate for the haricot bean is 50 kg ha−1 urea and 100 kg ha−1 diammonium phosphate (DAP). Hence, for each lysimeter, 360 g DAP and 90 g urea were used during sowing. The urea was applied at a split rate. The second application of 90 g urea was conducted on March 22, 2017, and April 5, 2018, around 30 days after sowing. Approximately 100 days after sowing, the haricot bean crops were harvested over two successive experimental seasons. Water application to the crop was terminated when 2 weeks were left for harvesting.
2.4. Neutron Probe Calibration
The neutron probe was calibrated based on the procedure provided in the user manual (Model 503DR CPN Hydroprobe). This instrument allows rapid and periodically repeated measurements of the volumetric wetness of the soil at different depths. During the calibration of the neutron probe, access tubes, a volume sample, a scale, and an oven were used. Two aluminum access tubes were installed at a depth of 100 cm at two points. This was performed by digging a hole with an auger and the aluminum access tube was driven into the hole. Wet and dry points were established to obtain a wide range of moisture content and to make it possible for the probe to read these ranges. Probe readings in the tube in count ratio or rat (count/standard count) units and volume samplers in pairs around the tube (within 15 cm of the tube) were taken at the desired depth. Parallel to the neutron probe measurements, soil samples were taken at 15 cm intervals up to 100 cm soil depth with the same depth as the neutron probe readings using an auger. Soil water at a depth of 15 cm was calculated using the gravimeter method. The probe reading in count ratio (rat) versus the volume sample data was plotted using an Excel sheet, and a trend line was created with its slope and intercept, and displayed its R2 value. The coefficients of the linear equation (a and b) obtained from the fitted curves were used to convert the neutron probe readings to soil moisture readings in a unit of 15 cm water depth per 15 cm soil depth.
2.5. Irrigation Application and Soil Moisture Monitoring
2.6. Crop Evapotranspiration (ETc) and Reference Evapotranspiration (ETo)
2.7. Crop Coefficient (Kc)
2.8. Adjustment of FAO Crop Coefficient Using Local Climate
3. Results
3.1. Actual Crop Evapotranspiration and Reference Evapotranspiration
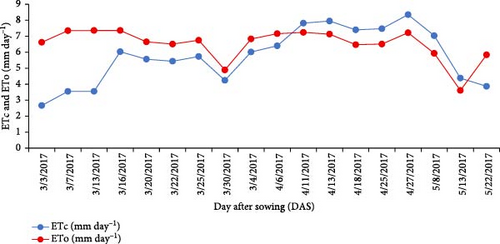
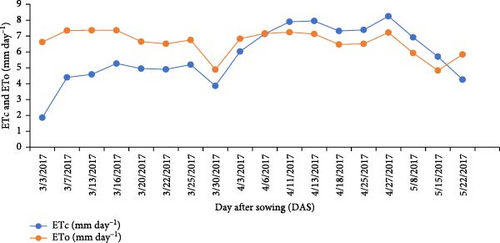
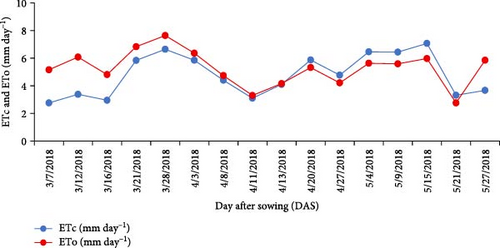
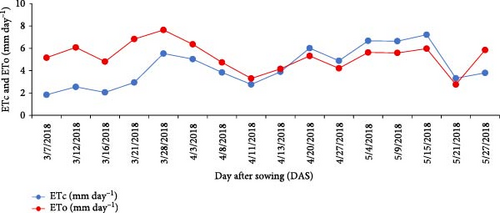
The seasonal actual evapotranspiration (ETc) and developed hydrological water balance components (cm) of the haricot beans are presented in Table 3. The average daily actual crop evapotranspiration (ETc) and referenceevapotranspiration (ETo) for the 2017 and 2018 haricot bean experimental periods are shown in Figure 4a–d. Accurate measurements of ETc based on crop growth stage, root depth, soil water-holding capacity, and precipitation data are essential for managing irrigation water in agricultural fields.
| Lysimeter-1 (2 m2) | Lysimeter-2 (4 m2) | Average | |||||||||||||||
|---|---|---|---|---|---|---|---|---|---|---|---|---|---|---|---|---|---|
| Year | 2017 | ||||||||||||||||
| Stages | Days | Peff | I | D | ΔS | ETc | ETo | I | D | ΔS | ETc | ETo | I | D | ΔS | ETc | ETo |
| Initial | 19 | — | 63.4 | 0.2 | 3.7 | 59.5 | 133.1 | 58.9 | 1.9 | −4.8 | 61.8 | 133.1 | 61.2 | 1.0 | −0.6 | 60.7 | 133.1 |
| Development | 24 | 24.6 | 121.9 | 11.2 | 2.4 | 132.9 | 155.2 | 186.3 | 83.1 | −2.9 | 130.7 | 155.2 | 154.1 | 47.2 | −0.2 | 131.8 | 155.2 |
| Mid-season | 37 | 55.0 | 201.2 | 28.0 | −32.1 | 260.3 | 226.1 | 244.9 | 52.0 | −28.3 | 276.2 | 241.9 | 223.1 | 40.0 | −30.2 | 268.3 | 234.0 |
| Late-season | 20 | 9.8 | 25.0 | — | — | 34.8 | 52.6 | 20.0 | — | — | 29.8 | 40.9 | 22.5 | — | — | 32.3 | 46.7 |
| Total | 100 | 89.4 | 411.5 | 39.4 | −26.0 | 487.5 | 567.0 | 510.1 | 137.0 | −36.0 | 498.5 | 571.1 | 460.8 | 88.2 | −31.0 | 493.0 | 569.0 |
| Lysimeter-1 (2 m2) | Lysimeter-2 (4 m2) | Average | |||||||||||||||
| Year | 2018 | ||||||||||||||||
| Stages | Days | Peff | I | D | ΔS | ETc | ETo | I | D | ΔS | ETc | ETo | I | D | ΔS | ETc | ETo |
| Initial | 18 | — | 83.8 | 11 | 1.1 | 71.7 | 109.6 | 33.9 | — | −11 | 44.87 | 109.6 | 58.84 | 5.5 | −4.95 | 58.29 | 109.6 |
| Development | 23 | 85.9 | 75.4 | 47 | −6 | 121.1 | 133.6 | 58.3 | 58.5 | −18.5 | 104.2 | 133.6 | 66.86 | 52.75 | −12.3 | 112.7 | 133.6 |
| Mid-season | 38 | 72.5 | 165.6 | 19 | 5.4 | 214.2 | 186.5 | 163 | 16.5 | −0.7 | 219.4 | 186.5 | 164.2 | 17.75 | 2.35 | 216.8 | 186.5 |
| Late-season | 21 | — | 23 | — | 1 | 22 | 35.1 | 22.8 | — | — | 22.8 | 35.1 | 22.9 | — | 0.5 | 22.4 | 35.1 |
| Total | 100 | 158.4 | 347.8 | 77 | 1.5 | 429 | 464.7 | 278 | 75 | −30.2 | 391.3 | 464.7 | 312.7 | 76 | −14.4 | 410.1 | 464.7 |
| Average over two years | 100 | 123.9 | 379.7 | 58.2 | −12.25 | 458.2 | 515.85 | 393.9 | 106 | −33 | 444.9 | 517.89 | 387 | 82.098 | −22.68 | 451.6 | 516.9 |
3.2. Locally Measured and FAO Adjusted Haricot Bean Crop Coefficient (Kc)
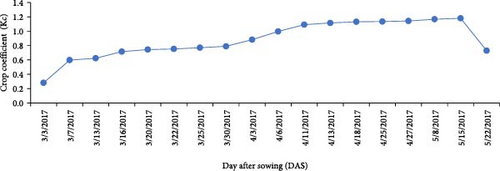
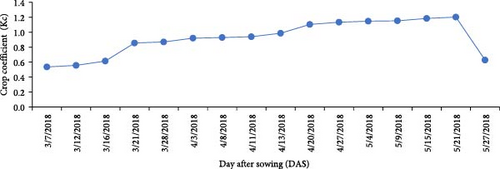
Figure 5a–d shows the developed daily actual crop coefficient values for the haricot bean during the 2017 and 2018 growing periods. The results showed that Kc values gradually increased from the start of the season, peaked in the mid-season, and then began to fall at the end. This outcome was consistent with the trend described for FAO-56. In 2017, the Kc values ranged between 0.46 and 0.5 at the initial, 1.14–1.15 at the mid, and 0.66–0.73 at the end of the season. However, the Kc values for the initial, middle, and end-seasons in 2018 ranged between 0.41–0.64, 1.15−1.18, and 0.63–0.65, respectively (Table 4). The average Kc values for the initial, middle, and end of the season for the two experimental seasons were 0.5, 1.16, and 0.67, respectively. Table 5 shows the mid-season Kc values of the locally measured and FAO-adjusted haricot bean.


| Measured Kc | |||
|---|---|---|---|
| Experimental year | Kc-ini-measured | Kc-mid-measured | Kc-end-measured |
| 2017 | 0.46–0.5 | 1.14–1.15 | 0.66–0.73 |
| 2018 | 0.41–0.64 | 1.15–1.18 | 0.63–0.65 |
| Average Kc | 0.5 | 1.16 | 0.67 |
| Experimental year | Kc-ini-(measured) Kc-ini (adj) | Kc-mid-(Measured) Kc-mid (adj) | Kc-end-(Measured) Kc-end (adj) |
|---|---|---|---|
| 2017 | 0.48 (0.35) | 1.15 (1.16) | 0.69 ( ∗∗) |
| 2018 | 0.525 (0.47) | 1.17 (1.11) | 0.64 ( ∗∗) |
| Average Kc | 0.5 (0.41) | 1.16 (1.14) | 0.76 ( ∗∗) |
- Note: Kc-mid (adj)) and Kc-end (adj)) = FAO adjusted Kc values for mid and end-season, respectively, where wind speed and RHmin differ from 2 m s−1 and 45%, respectively; Kc-mid- (Measured) and Kc-end- (Measured) = locally measured Kc values for mid and end-season, respectively.
- ∗∗Not adjusted Kc value because the FAO Kc end-season value is <0.45.
4. Discussion
This study evaluated ETc, ETo, and Kc values for the haricot bean over two growing seasons, 2017 and 2018. The seasonal haricot bean crop evapotranspiration during the 2017 and 2018 experimental years was 493.0 and 410.1 mm, respectively, with an average of 451.6 mm (Table 3). The lower value of ETc in 2018 was due to higher rainfall, lower air temperature, and wind speed compared to 2017, and thus, less irrigation was required. The average haricot bean daily crop evapotranspiration ranged between 2.67 and –8.35 mmday-1 in 2017 and 1.84 and –7.22 mm day-1 in 2018 (Figure 5). The maximum average daily crop evapotranspiration was observed at 56 DAS in 2017 and 70 DAS (mid-season) in 2018 (Figure 5). This is due to highest crop water demand occurring in the mid-season. The pattern of average daily ETc for each haricot bean growing season observed in the study area was comparable to the trend described in FAO-56. This trend generally shows a gradual increase in ETc from the initial, reaching the peak at the mid-season and starting to decline toward the end of the season. The variation in ETc is due to the combined effects of crop development, changes in the evaporative demand of the atmosphere, and differences in energy absorption characteristics. The increase in ETc from the initial to crop development stages can be explained by changes in evaporative demand and rapid crop growth. The decline in ETc toward the end-season stage was due to senescence and less physiological activities of the leaves because of aging [9]. These measurements are critical for understanding the water requirements at different crop stages, which can inform irrigation management strategies. The seasonal crop evapotranspiration of the haricot bean measured in this study was within the range previously reported as 300–500 mm [25]. The findings of this study are also comparable to those of Laike et al. [3], who conducted their research in the Central Rift Valley of Ethiopia and reported a haricot bean crop water requirement of 447.16 mm using a nonweighing lysimeter. Alipour et al. [23], in Afghanistan, reported haricot bean seasonal ETc of 579 mm under nonstress conditions. This may be due to the length of the crop growth period and the differences in agroecological conditions. Otoro and Hatiye [22], in the Arba Minch area in Southern Ethiopia, reported a haricot bean ETc of 410 mm using full irrigation treatments.
The average daily ETo values ranged from 3.61 to 7.36 mm day−1 in 2017 and 2.76 to 7.64 mm day−1 in 2018 (Figure 5). ETo represents the evaporative demand of the atmosphere, which is influenced by factors like temperature, humidity, wind speed, and solar radiation. High ETo indicates high water demand from the atmosphere, meaning crops lose more water through evapotranspiration and, therefore, require more irrigation to maintain optimal growth. The study reported average seasonal ETo values of 569.0 mm in 2017 and 464.7 mm in 2018 (Table 3). The higher ETo in 2017 suggests that atmospheric conditions were more demanding than in 2018 due to factors such as higher temperatures and wind speed. In 2018, increased rainfall contributed to lower ETo values, as the atmospheric demand for additional water was reduced by the available moisture in the soil. These variations illustrate how changes in weather patterns directly affect irrigation needs, requiring adjustments to ensure that crops receive adequate water without waste.
In this study, Kc values that relate ETc to ETo demonstrated a typical trend, increasing from the initial to mid-season and decreasing towards the end. For instance, in 2017, the Kc values ranged from 0.46 to 0.5 at the initial stage, 1.14–1.15 at mid-season, and 0.66–0.73 at the end (Table 4). In 2018, similar trends were observed but with slight variations, such as a broader range in initial-stage Kc (0.41–0.64) due to variable weather conditions. This shows that, while Kc follows a general trend, it may vary depending on climate factors. In all stages, the developed Kc values were greater than the FAO-adjusted values (Table 4). The average Kc-mid measured for this study was higher than the haricot bean Kc-mid values of 1.15 reported by Allen et al. [9] and Tasumi and Allen [26], 1.07 reported by Jabow et al. [27], and 1.01 reported by Laike et al. [3]. It showed that locally observed crop water needs were greater than the FAO reference values. This variation of Kc values between the locally developed, the FAO adjusted and other studies could be attributable to the difference in local climatic conditions, growing window, soil texture, and management practice. It suggests that more accurate irrigation water can be provided using locally measured Kc values than FAO values. The details of FAO-adjusted and locally measured Kc values for the haricot bean are presented in Tables 4 and 5.
5. Conclusions
This study offers useful observations of the dynamics of crop evapotranspiration, components of water balance, and crop coefficient for the Awash–Melka haricot bean variety in the semi-arid area of Melkassa, using a nonweighing lysimeter. As water becomes increasingly scarce due to competition across various sectors, precise water allocation in irrigated agriculture is imperative for achieving optimal crop yields and conserving water resources. Underestimating crop evapotranspiration might result in yield penalties attributable to water stress, whereas overestimation can lead to excessive water application, thereby lowering the water available for other uses. The daily average haricot bean evapotranspiration ranged from 1.84 mm day−1 during the initial stage to 8.35 mm day−1 at mid-season. The average seasonal crop evapotranspiration was determined to be 451.6 mm. The crop coefficient values for the initial, mid-season, and late-season stages were 0.5, 1.16, and 0.67, respectively. These findings are significant for Ethiopian agriculture, addressing gaps in haricot bean water requirements and crop coefficients, and can improve irrigation management practices in Ethiopia.
Conflicts of Interest
The authors declare no conflicts of interest.
Author Contributions
All authors, Tatek Wondimu Negash, Gobena Dirirsa Bayisa, and Abera Tesfaye Tefera, have read and approved the final content of the manuscript.
Funding
This research received financial support from the Ethiopian Institute of Agricultural Research.
Acknowledgments
The authors express their gratitude to the Ethiopian Institute of Agricultural Research for their generous financial support and to the Melkassa Agricultural Research Center for their technical assistance with the experiments.
Open Research
Data Availability Statement
All the data are available within the paper itself.


