Characteristic of Short-Duration Heavy Rainfall and Environmental Parameters
Abstract
Utilizing ERA5 monthly averaged data from 1981 to 2022, ERA5 hourly data from 2018 to 2022, and observed hourly precipitation data at the airports of the Civil Aviation Flight University of China (CAFUC), the variation characteristics of short-duration heavy rainfall (SHR) and the environmental conditions of each synoptic category were studied by classifying large-scale synoptic circulations related to SHR. The results indicated the following: Synoptic circulation was classified into four categories for the 71 SHR selected based on the criteria: vortex (14 cases), low-pressure trough (29 cases), subtropical high (26 cases), and other categories (2 cases). The average precipitation amount (PA) and precipitation frequency (PF) increased from 00:00 on the day of the SHR to 00:00 the next day, peaking at night, with the largest values in the vortex category and peaking earlier than the other two. The average precipitation intensity (PI) was largest in the subtropical high (9.3 mm/h), smallest in the low-pressure trough (6.8 mm/h), and closed in the daytime and nighttime in the vortex. For the four thresholds of ≥0.1, ≥10, ≥20, and ≥50 mm/h, the average PA and PF of nighttime were larger than the daytime, the vortex was the largest, and the peak time was shifted forward between the thresholds, while shifted backward in the low-pressure trough. Under the three synoptic categories, the increase in PA was mainly due to the contribution of increased PF, whereas the impact of PI was relatively small. Before the SHR, the vortex category had better moisture and dynamic uplift conditions than the low-pressure trough and subtropical high categories, reflecting the dynamic nature of the vortex. Atmospheric conditions were the greatest at the subtropical high, indicating the thermal nature of the subtropical high. A K index greater than 31 was necessary for an SHR event at the CAFUC airports.
1. Introduction
Short-duration heavy rainfall (SHR) is a common phenomenon in rainstorms with short lifecycles, small spatial scales, and strong disaster-causing potential [1]. This is a critical and challenging issue in predicting severe convective weather [2].
As a result of global warming, atmospheric water-holding capacity has increased, and extreme precipitation events have become more common, which may continue in the future [3–7]. As one of China’s most severe convective weather disasters, urban flooding caused by SHR has led to substantial property loss and even fatalities. From July 8 to 11, 2018, heavy rainfall affected 11 cities in Sichuan Province, resulting in significant impacts. Six million people suffered, with three deaths and an economic loss of 6.4 billion yuan [8]. On July 29, 2023, and July 21, 2012, Beijing experienced two torrential rainstorms, with a maximum hourly rainfall of 50.8 mm and exceeding 100 mm, respectively [9]. On July 22, 2021, Zhengzhou, Hebei, experienced an extraordinary torrential rainstorm with an hourly rainfall of 201.9 mm [10], setting a record for the highest hourly rainfall intensity since meteorological records began in China.
SHR is an hourly rainfall accumulation of more than 20.0 mm at the National Meteorological Center, China Meteorological Administration [11]. With improvements in the space-time resolution of observation data and the progress of numerical models, meteorologists have conducted many studies on SHR. Harold and David [12] analyzed the SHR process within a 3-hourly time scale in the United States, indicating that the distribution of SHR was similar to that of floods in the region. A study of SHR in China showed that the trends and intensities of precipitation varied with locality and level, with notable differences in spatial distribution [13–25].
Zhang and Zhai [13] pointed out that from 1961 to 2000, the frequency of extreme SHR in most parts of China during the warm season showed an increasing trend. In Jiangxi Province, a high frequency of SHR was mainly distributed in mountainous and valley areas [14], whereas it was located in mountainous areas and the central and eastern hilly regions in Anhui Province [15]. Wang et al. [16] found that by increasing the frequency of SHR, the terrain had a significant effect on the increase in SHR during the rainy season in Henan Province. In Beijing, SHR mainly occurred from the afternoon to early at night, lasting ~20–35 min, and was mainly distributed in the plains in front of the mountains [17]. The spatial distribution of SHR in Nanjing showed a clear urban–rural difference, with the highest number of days and strongest rainfall intensity occurring from July to August, with the evening being the peak period [18].
Southwest China is the most active zone of the SHR after southern China. In the Sichuan-Chongqing Basin, there was more rainfall in the west and less in the east, and the main center of the SHR was located primarily in the southwestern part, where the terrain transitioned from high mountains to the basin. The intensity, frequency, and amount of SHR exhibited consistent characteristics of diurnal variation, with a peak time between 12:00 and 18:00 (UTC), which was ~6 h earlier than that in Hubei [19], and the characteristics of nocturnal precipitation were prominent [20–23]. Mao et al. [24] and Deng et al. [25] found that SHR in Sichuan was mainly concentrated from July to August, with a peak at 18:00.
Weisman and Klemp [26] indicated two mechanisms for high rainfall rates that depend on large-scale environmental conditions. Doswell [27] examined the impact of weather systems on different scales of severe convective weather. It was noted that large-scale systems create a thermal environment favorable for severe convection, while mesoscale systems provide the dynamic lifting force needed to trigger these events. SHR occurs directly in mesoscale and small-scale systems under favorable large-scale environmental conditions [19, 28]. Precipitation >50 mm/h was mainly caused by a small-scale system [19], which was divided into continental and tropical convective patterns [29, 30].
Large-scale pressure systems restrict the development of meso- and small-scale systems, and the synoptic systems that affect the occurrence of SHR vary in different regions. Classifying atmospheric circulation related to SHR is conducive to understanding the mechanisms underlying the occurrence and development of SHR. Yang et al. [31] concluded that the weather systems causing SHR in Beijing could be classified into four synoptic types: interactions between subtropical high and westerly troughs, westerly small troughs, cold vortices in northeast China, and low-pressure vortices or inverted troughs over the Huanghuai Plain. The weather background of SHR in north China was divided into four categories: tropical cyclone; vortex and shear; the edge of the subtropical high under weak synoptic forcing; and other types [31–34].
The Tibetan Plateau vortex, the southwest vortex, and the shear line are fundamental mechanisms triggering intense summer rainfall in the Sichuan-Chongqing region [35–38]. The Sichuan Provincial Meteorological Bureau classified strong summer rainfall in the basin into four types based on circulation patterns: (1) eastward movement of the Tibetan Plateau vortex; (2) eastward movement of the short-wave trough in the westerlies, with persistent heavy rain in the western part of the basin located on the northwestern edge of the Western Pacific subtropical high; (3) influence of the deep trough in the mid-latitudes; and (4) heavy rainfall caused by the west end of the Jianghuai shear line in the eastern part of the Sichuan Basin [39].
To predict the SHR, it is crucial to understand the environmental conditions required to produce intense precipitation. In China, the SHR exhibits convective properties [40]. The main environmental factors affecting convection are moisture, dynamic, and thermal conditions [28, 41, 42]. After comparing the environmental conditions during two extreme torrential rain events in Beijing, Tian et al. [9] found that ordinary SHR could occur in environments with strong dynamic lifting and sufficient moisture, indicating that potential thermal instability was not a necessary condition. SHR requires abundant moisture [43], and the greater the precipitation, the higher the atmospheric temperature and instability energy required [44, 45].
Based on the previous understanding of SHR, this study classified the synoptic circulations related to SHR, examined the varying characteristics of SHR, and compared the environmental conditions of the synoptic category to supply more references for SHR forecasting and flight training.
2. Materials and Methods
The Civil Aviation Flight University of China (CAFUC), headquartered in Guanghan City on the Chengdu Plain in Sichuan Province, has four flight training subcolleges in Xinjin, Guanghan, Mianyang, and Suining and a training base in Zigong. It operates five general aviation and transport airports and mainly focuses on flight training for primary teaching aircraft, medium-teaching aircraft, and helicopters. Specialized flight training demands stringent weather conditions. Precipitation significantly impacts flight: light rain reduces visibility, while heavy rain can impair aircraft aerodynamics and cause runway icing in winter, severely jeopardizing flight safety.
The geographical locations and altitude distributions of the five CAFUC airports are shown in Figure 1. Xinjin Airport (code ZUXJ) and Guanghan Airport (ZUGH) are located in the western part of the Sichuan Basin. These two airports are surrounded by mountains and rivers, and water vapor conditions are suitable [46], with the Longquan Mountain Range to the east, which often experiences severe convective rainfall in the afternoon during summer [47]. Zigong Airport (ZUZG) is situated in a hilly region in the southeastern part of the basin owing to the surrounding gentle slopes, which have ample moisture, making it prone to low cloud formation [48, 49]. Suining Airport (ZUSN) is situated in the eastern part of the basin, with rolling hills 2–3 km away. Sufficient moisture often converges over the airport, resulting in a perennial presence of low clouds [50]. Mianyang Airport (ZUMY) is located in the northeastern part of the basin, in the middle and upper reaches of the Fujiang River, and because of the delayed construction of observational instruments, the hourly precipitation data are incomplete.
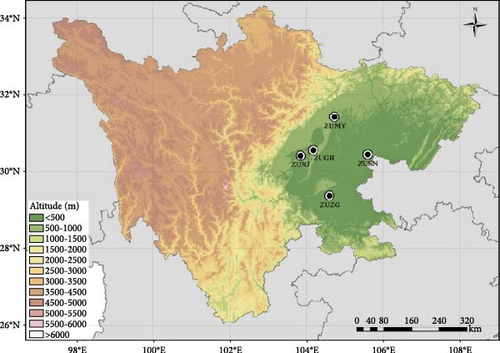
Considering the integrity of the data, this study selected hourly precipitation data collected and processed using an automatic weather observation system at four airports of the CAFUC—Xinjin, Guanghan, Suining, and Zigong—equating a total of 24 hourly data points from 2018 to 2022 to study the varying characteristics of SHR. According to the Civil Aviation Meteorological Ground Observation Records, questionable records were rejected to control data quality.
According to the Civil Aviation Airport Meteorological Observatory Construction Guide, there are precise requirements for the installation position of the airport’s automatic meteorological observation station, which must be installed no more than 120 m away from the center line of the runway but not less than 90 m, and about 300 m away from the entrance of the runway and the stopping end of the runway and the middle zone of the runway.
The extent of circulation anomalies is conducted using the ERA5 0.5° × 0.5° monthly average reanalysis data from 1981 to 2022. Synoptic systems and environmental parameters associated with SHR were analyzed using ERA5 hourly data by directly choosing 00:00, 06:00, 12:00, and 18:00 as 6-h interval data from 2018 to 2022, with the same resolution as the monthly data. The most recent period before the occurrence of SHR was considered the pre-event environmental field, and the most recent period after the event was considered the post-event environmental field.
According to the definition [51], an hourly precipitation ≥0.1 mm is recorded as one precipitation event. Hourly precipitation refers to the cumulative precipitation of the previous hour, such as precipitation at 12:00, which refers to the precipitation from 11:00 to 12:00. The sum of precipitation ≥0.1 mm from 00:00 on the previous day to 00:00 on the present day is recorded as daily rainfall [52]. The precipitation amount (PA), which is used to represent the amount of precipitation per unit of time, refers to the total precipitation divided by the total time in the statistical period. The precipitation frequency (PF), a measure of the frequency of precipitation occurrence, was calculated by multiplying the number of hours with the PA by 100 and dividing by the total number of hours in the statistical period. Precipitation intensity (PI) is defined as the total PA divided by the total number of hours of precipitation and is used to indicate PI.
In this study, precipitation data were divided by the hour, which may have split continuous 1-h precipitation events that exceeded the SHR threshold into two periods, causing them to fall below the SHR threshold. Consequently, the PF statistic in this study was lower than the actual PF.
3. Annual Variation of Precipitation
According to the definition, in the past 5 years, the average annual PA is highest in Suining and Zigong, both at 0.12 mm/h, followed by Guanghan (0.11 mm/h), with Xinjin recording the least at 0.10 mm/h. Suining had the highest PF at 9.16%), followed by Zigong and Xinjin, and Guanghan had the least at 7.41%). For the average annual PI, Guanghan is the highest (1.51 mm/h), followed by Suining and Xinjin at 1.31 and 1.26 mm/h, respectively, with Zigong having the lowest (1.06 mm/h).
Based on these standards, 71 SHRs were selected at four airports of the CAFUC over the past 5 years. Xinjin Airport had 13, Guanghan 20, Suining 25, and Zigong 13 cases.
As shown in Table 1, from 2018 to 2022, there is a significant difference in the proportion of SHR PA to annual PA at each airport. Overall, Guanghan Airport had the highest proportion at 23.64%, peaking in 2021 at 32.56%. Suining followed with 15.20%, while Zigong recorded the lowest at 9.66%. The annual PF of SHR to the annual total PF was highest at Suining Airport, with an average proportion of 3.80%, followed by Guanghan. Xinjin had the lowest frequency, accounting for only 1.87%.
| The proportion in the PA of SHR to the annual PA (%) | ZUXJ | ZUGH | ZUSN | ZUZG |
|---|---|---|---|---|
| 2018 | 22.9 | 19.6 | 24.0 | 4.4 |
| 2019 | 11.5 | 16.4 | 10.4 | 10.2 |
| 2020 | 23.4 | 24.7 | 16.3 | 6.7 |
| 2021 | 7.2 | 32.6 | 17.3 | 12.6 |
| 2022 | 4.0 | 24.9 | 7.9 | 14.4 |
| 5-year average | 13.8 | 23.6 | 15.2 | 9.7 |
4. Variation of Short-Term Heavy Rainfall
4.1. Classification of Synoptic Circulation
Based on the large-scale circulation patterns (500 or 850 hPa), a total of 71 SHR cases screened out at the airports were classified into four categories (Table 2): (1) vortex (14 cases), (2) low-pressure trough (29 cases), (3) subtropical high (26 cases), and (4) other type (2 cases), referring to the standards of the Sichuan Provincial Meteorological Bureau [39] and Sun et al. [32]. Combining the characteristics of the systems, the vortex category was further divided into the Tibetan Plateau vortex type and/or southwest vortex type, and the subtropical high category was divided into the edge of the subtropical high under a weak synoptic forcing type, the subtropical high edge with a western small trough type, and shear between the two high-pressure types. The 71 SHR events that occurred at the CAFUC airports mainly concentrated from April to October, which is consistent with the conclusions of Ran et al. [20]. The vortex category was mainly concentrated in July and August, the subtropical high category was concentrated from July to September, and the low-pressure trough category was concentrated from June to August.
| Synoptic category | Max hourly rainfall rate (mm/h) total amount (mm) |
Max hourly rainfall time (UTC) |
|
|---|---|---|---|
| Vortex (14 cases) | The Tibetan Plateau vortex with southwest vortex (6) |
|
|
| Southwest vortex (8) |
|
|
|
| Low-pressure (29 cases) | — |
|
|
|
The edge of subtropical high under a weak synoptic forcing (18) |
|
|
| Subtropical high edge with western small trough (4) |
|
|
|
| Shear between two high-pressure (4) |
|
|
|
| Other type (2 cases) | — |
|
|
4.2. Typical Short-Term Heavy Rainfall Cases
4.2.1. Vortex Category
As shown in Table 2, there were six short-term heavy rainfall cases caused by the cooperation of the Tibetan Plateau and southwest vortices. From August 10 to 14, 2020, persistent heavy rainfall occurred throughout the Sichuan Basin from west to east; 17 automatic observation stations (totaling 2107) recorded cumulative precipitation exceeding 400 mm, and 256 stations exceeded 200 mm [53]. Xinjin Airport experienced the maximum hourly rainfall rate (107.7 mm/h) between 09:00 and 10:00 on August 11.
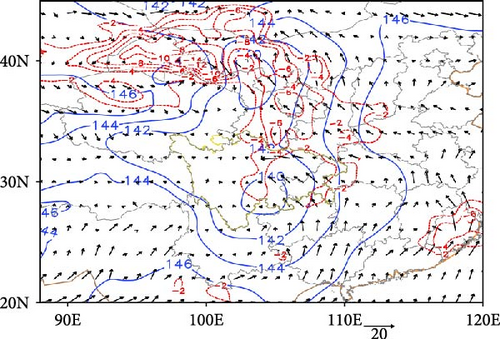
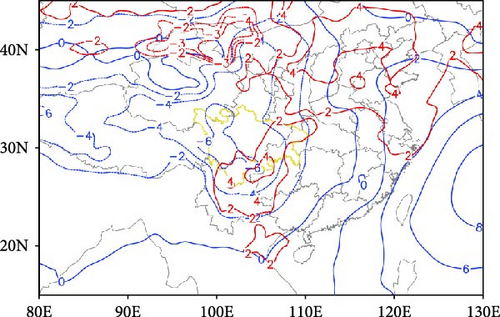
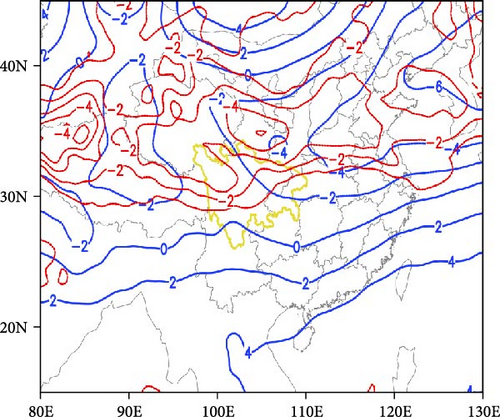
From 08:00 on August 10 to 02:00 on August 11, 2020, a Tibetan Plateau vortex formed in the southeastern part of Qinghai at 500 hPa and gradually weakened into a westerly trough while moving eastward toward the northwestern part of the basin. Positive vorticity advection ahead of the trough induces the formation and development of a southwest vortex in the lower layer [53]. As shown in Figure 2b, compared to the climatology, the Sichuan Basin and Qinghai–Tibet Plateau area were all negative anomaly areas, with a negative center at 6 dagpm located in the western part of the basin. Corresponding to the height deviation field, at 06:00 on August 11 (Figure 2a), before the SHR event, the intensity of the southwest vortex was 140 dagpm over the southwestern part of the basin. Cold air moved southward from mid-to-high latitudes, infiltrating the basin from the lower terrain of Mount Daba. This resulted in a 24-h negative temperature change in the northeastern part of the basin. Additionally, a southerly low-level jet (LLJ) from the South China Sea brought warm, moist airflow to the region, interacting with the cold air and causing slantwise lifting. The precipitation zone was located on the left side of the jet outlet area, where cyclonic shear and moist baroclinic forcing were strong. At 12:00 (not shown), after the SHR, the westerly trough remained stationary over the central part of the basin, the southwest vortex decreased slightly with some eastward movement, and the main body of the cold air shifted eastward. The range of the LLJ expanded, and moisture was transported to the basin. The SHR event at the CAFUC airport ended, and rainfall continued.
4.2.2. Low-Pressure Trough Category
On July 12, 2019, Guanghan Airport experienced an SHR event with the cooperation of an upper-level jet, a low-pressure trough, and cold air. Between 01:00 and 02:00, 02:00 and 03:00, the hourly rainfall rate was 56.1 and 21.4 mm/h, respectively. The cumulative amount was 77.5 mm.
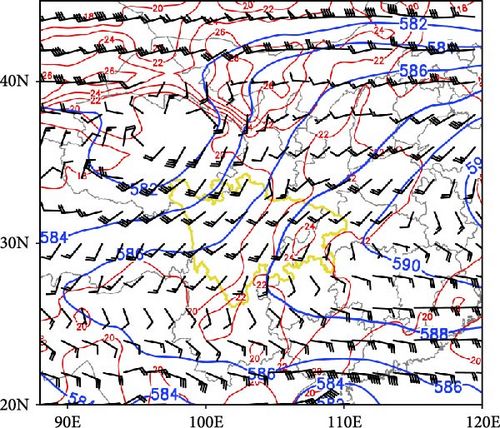
The distribution of the geopotential height anomaly with respect to the climatology at 500 hPa (Figure 3b) showed negative values in the north and positive values in the south. A closed negative center with 4 dagpm was located in the north, and positive values were in the south. A closed negative center with 4 dagpm was located in the southeastern part of Shanxi Province, with Sichuan Province having negative values. This corresponded to a deepening East Asian trough from the northeast swung downward to the southwest (Figure 3a), splitting off a low-pressure trough to the southwest and guiding cold air to enter the basin along a northeasterly path. Sichuan Province was controlled by the southern end of the low-pressure trough. Combined with the negative height changes, the negative temperature change of 2–3°C was conducive to the maintenance and deepening of the low-pressure trough.
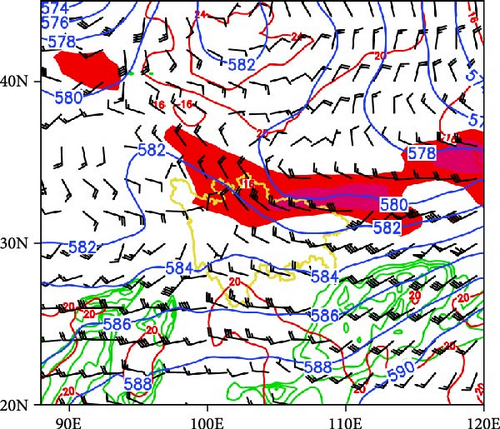
On the night of July 11, the basin was located on the right side of the entrance region of the westerly upper-level jet with a central speed of 40–45 m/s. This corresponded to a substantial wind divergence at the higher layer, which prompted a surface pressure reduction and the generation of a converging upward motion. The subtropical high is located at 20°N, and peripheral westerly winds continuously transport warm and moist currents to the basin. At 700 hPa, the southerly airflow from the Bay of Bengal continues to transport moisture to the basin at a central speed of 18 m/s. At 00:00 on July 12 (Figure 3a), the upper-level jet shifted slightly eastward and maintained a speed of 45 m/s. The low-pressure trough was slightly pressed southeastward, with its base located in the central part of the basin. Convective initiation occurs when cold air meets a warm and humid current from the south, resulting in an SHR event at Guanghan Airport. After the SHR, the upper-level jet shifts northeastward. The basin is controlled by the northwest airflow behind the trough. The moisture meets the returning cold air at the border between Sichuan and Chongqing, causing the rain belt to move eastward.
4.2.3. Subtropical High Categories
4.2.3.1. The Edge of Subtropical High Under a Weak Synoptic Forcing Type
From 01:00 to 04:00 on July 18, 2018, an SHR occurred at the Suining Airport, with a cumulative rainfall amount of 82.2 mm. The hourly rainfall intensity reached 69.4 mm/h between 02:00 and 03:00.
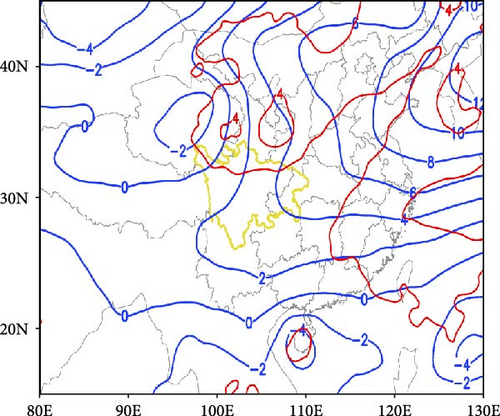
As shown in Figure 4b, all of China had a positive anomaly distribution at the height and temperature deviation with climatology at 500 hPa. The Sichuan Basin had a positive change of 2–6 dagpm and 2°C, corresponding to the evidence that the subtropical high extended westward to the western part of the basin with anomalies greater than 4–6 dagpm at 00:00 July 18 (Figure 4a), providing favorable conditions for the development of convective environment. The tropical depression in the South China Sea remained stable with little movement; the southeasterly airflow on the northern periphery transported water vapor to the central and eastern parts of the basin with the humidity greater than 90% at 850 hPa. Suining Airport is located on the northwest edge with high energy and humidity in the subtropical high, and an SHR event occurs between 02:00 and 03:00. At 06:00, the subtropical high extended westward, Suining Airport was within control, and the rainfall ended.
4.2.3.2. Subtropical High Edge With Western Small Trough Type
From 15:00 on September 12 to 01:00 on September 14, 2019, continuous precipitation occurred at Xinjin Airport with a cumulative precipitation of 80.3 mm. Hourly rainfall intensities were 30.5 and 21.0 mm/h from 15:00 to 16:00 12 and 01:00 to 02:00 on September 13. During this process, the Sichuan Basin was located on the right side of the divergence area at the entrance of the westerly upper-level jet. The subtropical high extends westward and remains stable with little movement. The small trough moved eastward, was blocked, and remained northwest of the basin. The continuous moisture transport from the Bay of Bengal met with cold southward air northwest of the basin.
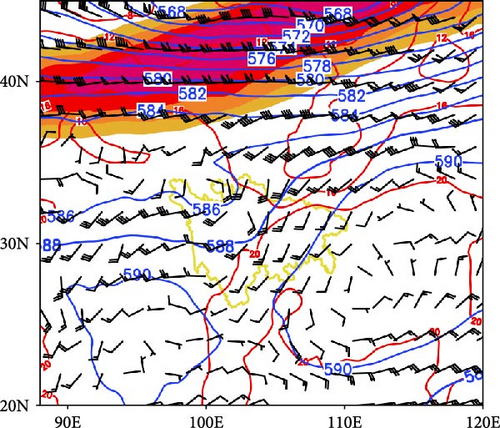
Compared to the climatology, the height deviation at 500 hPa was almost a positive anomaly area in China (Figure 5b), with a positive center greater than 10 dagpm located in the northeast region, corresponding to the latitudinally distributed subtropical high, controlling the region south of 32°N at 18:00 September 12 (Figure 5a), the southern and eastern parts of the basin were within control, with a positive change of 3–6 dapgm and 2–4°C. A short-wave trough gradually developed in the northeastern part of the western Sichuan Plateau. At 850 hPa, the temperature was 20°C, and the humidity was greater than 90%. The leading cold air is located around the Qinling Mountains, and the southwest airflow from the Bay of Bengal continues to transport moisture to the southern and eastern parts of the basin. At 18:00, the subtropical high pressed southward toward the central part of the basin. The southward movement of cold air promoted the deepening and southward pressing of the short-wave trough to the central part of the basin. The temperature at 850 hPa decreased to 18°C, and the humidity remained higher than 90%. Cold and warm air currents converged, resulting in an SHR event at Xinjin Airport.
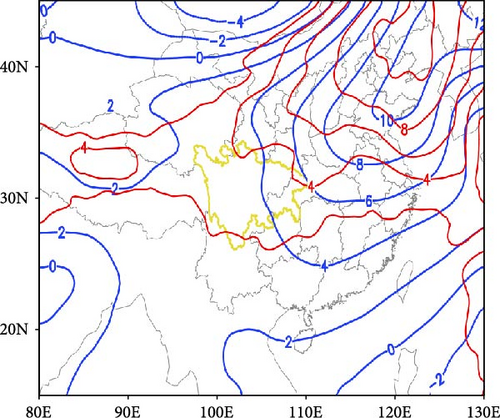
At 06:00 September 13 (not shown), the upper-level jet and subtropical high remained stable with little movement, whereas the trough deepened, with its position pressing slightly southward, promoting the continuous southward movement of cold air, and the temperature at 850 hPa dropped to 16°C. This precipitation event lasted under the influence of a circulation pattern characterized by a stable westward extension of the subtropical high, and the eastward movement of the short-wave trough was blocked.
4.2.3.3. Shear Between Two High-Pressure Type
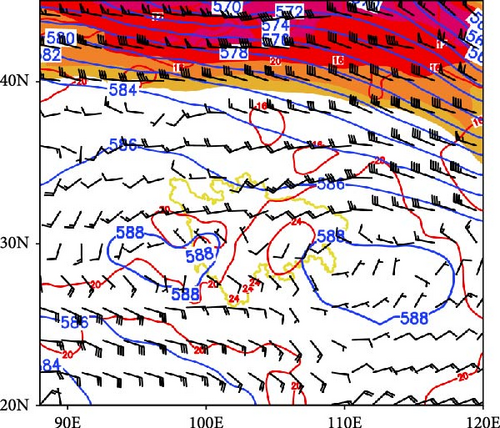
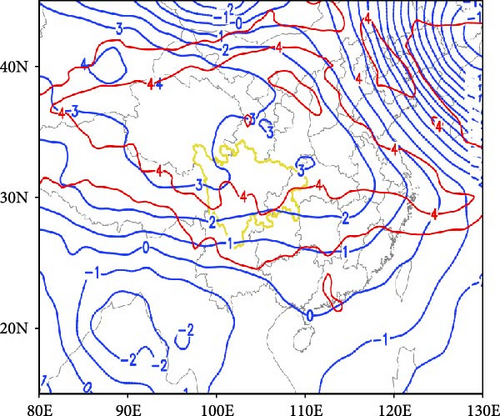
From 18:00 September 4 to 08:00 September 5 2018, heavy rainfall occurred at Xinjin Airport, with an accumulated precipitation of 155.2 mm. During 19:00–20:00, 20:00–21:00, and 21:00–22:00 September 4, the hourly rainfall intensities were 50.9, 27.0, and 37.4 mm/h, respectively. This event was caused by the shearing interaction between the subtropical high and Qinghai–Tibet Plateau.
Most areas in China were anomalous positive zones of height deviation at 500 hPa (Figure 6b), in addition to the northeastern parts, with a positive center greater than 4 dagpm located above the Tibetan Plateau. The Sichuan Basin had a positive variation of 1–3 dapgm and 2–5°C. At 18:00 September 4 (Figure 6a), the subtropical high extended westward to 105°E, standoff with the Qinghai–Tibet high, which is located on the southern part of the Tibetan Plateau. The central part of the basin is situated in a shear zone between the two highs. Cold air was present around the Qinling Mountains, whereas persistent water vapor from the South China Sea was transported to the central and eastern parts of the basin. At 00:00 on September 5, after the SHR, the extent of the Qinghai–Tibet High decreased. Cold air continued to move into the basin, and precipitation continued.
4.2.4. Other Categories
On June 28, 2021, an SHR event occurred at the Xinjin Airport. From 11:00 to 12:00, the hourly rainfall intensity reached 24.9 mm/h. Xinjin Airport was located on the right side of the center of the upper-level jet at 200 hPa; the basin was under the influence of northeast airflow in the middle and lower levels, cold air entered from the north, and there was no significant synoptic system affecting the process.
4.3. Daily Variation of SHR in Various Synoptic Categories
Select the thresholds of ≥0.1, ≥10, ≥20, and ≥50 mm/h, and count the hourly precipitation data from 00:00 on the day of the 71 SHR cases to 00:00 on the next day, 00:00 to 12:00 is daytime precipitation, and 12:00 to 00:00 the next day is nighttime precipitation [54].
For the three synoptic categories, the average PA and PF gradually increased from daytime to nighttime; both peaked at night, corresponding to the “nocturnal characteristic” of SHR. This is consistent with the conclusion that the SHR in Sichuan peaks at night [20–25].
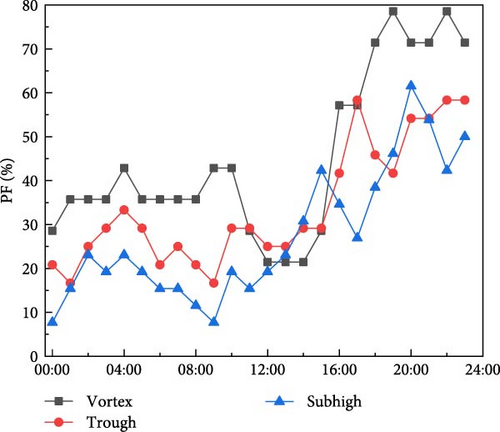
Nighttime PA and peak times varied across different categories. For the vortex, the PA was relatively larger with two peaks, occurring at 10:00 (8.16 mm/h) and 17:00 (11.54 mm/h) (Figure 7a). The average daytime PA was 2.7 mm/h, which increased to 4.33 mm/h at night. The average PA for the low-pressure trough and subtropical high categories was similar during both day and night, with their peaks occurring later than the vortex, both at 20:00. The PF of the three categories varied little during the daytime (Figure 7b) but increased significantly after 12:00. The PF for the vortex was significantly higher, followed by that of the low-pressure trough, with the subtropical high being the lowest. The peak time for the low-pressure trough was the earliest (17:00), with the vortex and subtropical high categories lagging slightly.
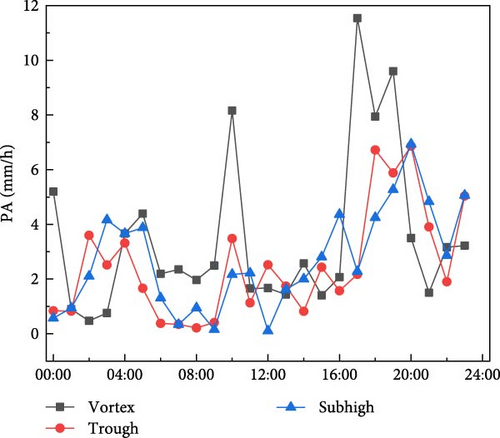
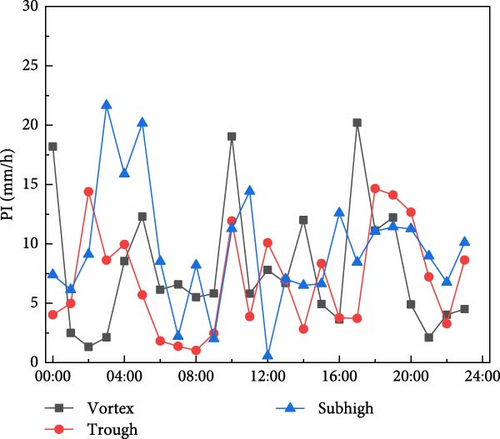
The average PI was the highest for the subtropical high (9.3 mm/h) (Figure 7c) and lowest for the low-pressure trough (6.8 mm/h). The diurnal variation of PI was not significant for the vortex, which was 7.8 mm/h (daytime) and 7.7 mm/h (nighttime), respectively. The average PI at nighttime for the low-pressure trough (7.5 mm/h) was greater than daytime (6.1 mm/h). In subtropical high, the average daytime PI (9.8 mm/h) exceeded the nighttime (8.7 mm/h). For the subtropical high category, PF was the lowest, but PI was the highest, probably related to its tropical type of precipitation, with a lower center of mass and greater intensity of rainfall.
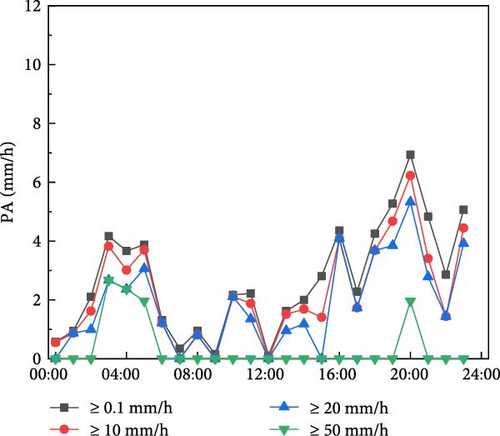
For the three synoptic categories, from 00:00 on the day of the SHR to 00:00 the next day, as the threshold increased, the average PA at night was higher than that during the day. The vortex category (Figure 8a) had the highest PA for each threshold, and the peak time was the same for each threshold, occurring at 17:00. Low-pressure trough category (Figure 8b), the peak times for ≥0.1 and ≥20 mm/h were the same (20:00), while ≥10 mm/h was slightly earlier (18:00), and ≥50 mm/h was at 02:00. For the subtropical high category (Figure 8c), the peak times for ≥0.1, ≥10, and ≥20 mm/h were the same at 20:00, with 50 mm/h at 03:00.
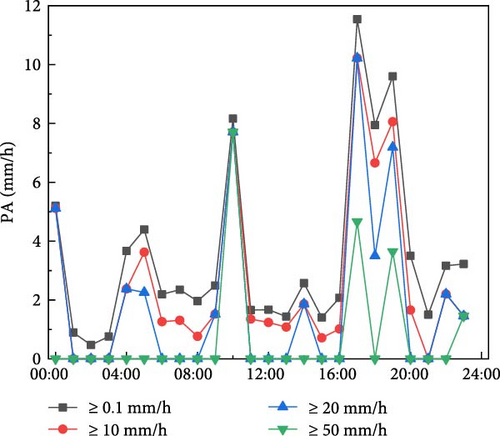
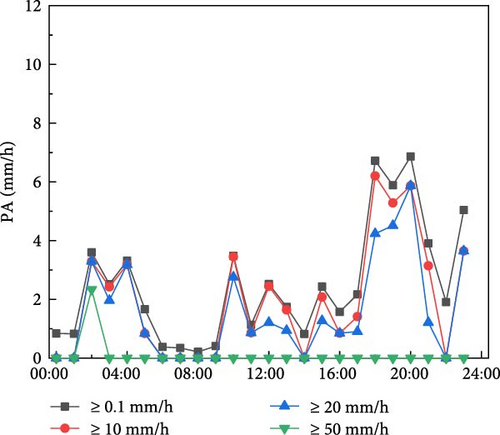
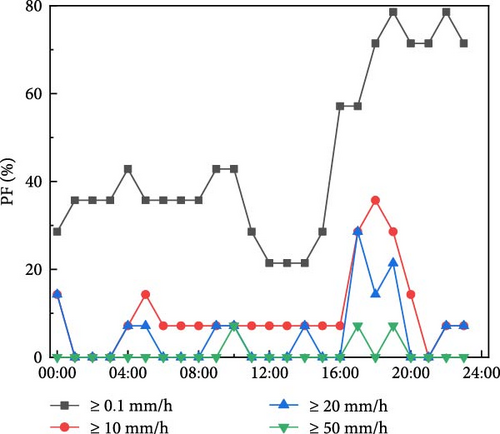
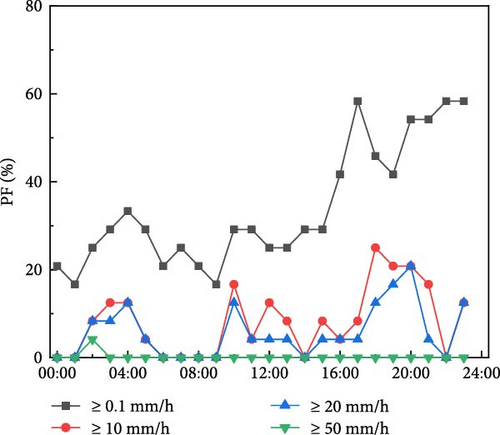
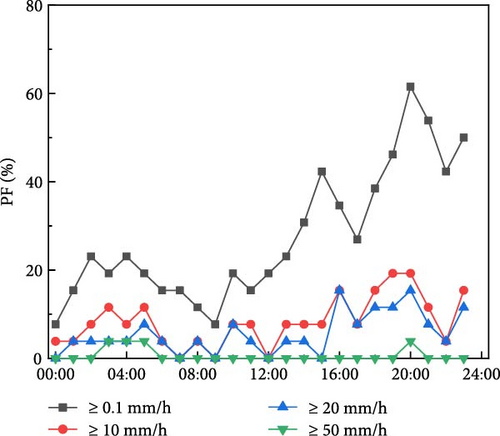
The PF under the four thresholds increased significantly after 16:00 (Figure 9), with the average PF at night being greater than that during the day. In the vortex category (Figure 9a), the PFs at all levels were significantly higher than those of the other two, with a peak shift forward between all levels. The peak time for the ≥0.1 mm/h level was the latest, occurring at 19:00 and 22:00, while the peaks for ≥20 and ≥50 mm/h were the earliest, both at 17:00. For low-pressure trough category (Figure 9b), the peak times for each threshold shifted backward, with the earliest peak time for the ≥0.1 mm/h at 17:00, followed by ≥10 mm/h (18:00), ≥20 mm/h and ≥50 mm/h (02:00). Subtropical high (Figure 9c), the peak times for ≥0.1, ≥10, and ≥20 mm/h were the same at 20:00, while ≥50 mm/h was slightly later than low-pressure trough, occurring between 03:00 and 05:00.
The average PI for all thresholds indicated that the daytime PI of the vortex was greater than that at night, peaking at 10:00. For the low-pressure trough category, the peak for each threshold occurred at 02:00, followed by a significant decrease, and then an increase from 09:00. The peak times for each threshold of the subtropical high were similar to those of the low-pressure troughs that occurred between 03:00 and 04:00.
Under the three synoptic categories, combined with the overall changes in PA, PF, and PI, the increase in PA was mainly due to the contribution of increased PF, whereas the impact of PI was relatively small. This is consistent with the conclusions of Wang et al. [16] and Ran et al. [20].
5. Variation of Environmental Parameters
5.1. Moisture Conditions
The precipitable water (PWAT) is the integration of water vapor from the ground to 200 hPa, representing the total water vapor content in the atmosphere [34]. The ranges of PWAT were 34.5–70.8, 40.6–67.6, and 51.2–63.1 for the three categories, respectively (Figure 10a). Tian et al. [11] showed that the PWAT was the best parameter for indicating hourly rainfall intensity; a PWAT of 28 mm was necessary for any SHR. Under these three categories, the PWAT of all SHR events exceeded 28 mm, thereby meeting the minimum PWAT requirement.
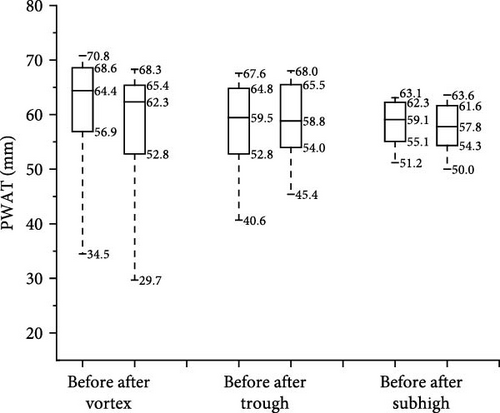
The median value of PWAT for the vortex was 64.4 mm; with this threshold, the low-pressure trough was ~25%, and the subtropical high was ~10%. This indicates that the PWAT for the vortex was larger than that for the other two categories. For the thresholds of 10%, 50%, and 75%, the PWAT of SHR in the three categories were higher than the climatology of SHR in Central and Eastern China (64.0 mm for 10%, 59.0 mm for the median value and 51.0 mm for 75%) [11], indicating a stronger water vapor environment of SHR within the Sichuan basin. The variation range of the PWAT for the subtropical high was smaller than that of the other two. The PWAT of 90% of events exceeded 51.2 mm at this threshold, which was significantly higher than the other two. This could be due to the SHR under subtropical high conditions, which occurred primarily in July and August; the higher the basic air temperature, the greater the water capacity of the atmosphere, leading to a higher PWAT.
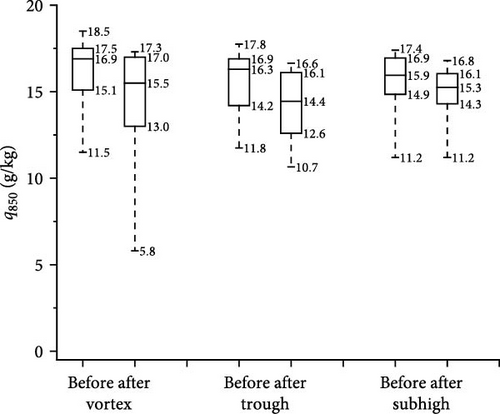
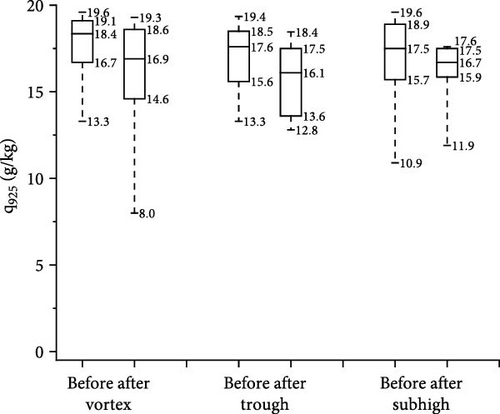
For the vortex, the median value of specific humidity (q) for 850 hPa (Figure 10b) was 16.9 g/kg, with this threshold less than 25% both for the low-pressure trough and subtropical high categories. The distribution of q at 925 hPa (Figure 10c) is the same as 850 hPa, with a median value of 18.3 g/kg. In Central and Eastern China, q values of 16.8 and 14.3 g/kg for 925 and 850 hPa are considered sufficient conditions for SHR events [11], and the corresponding values in the three basin categories are higher in Sichuan.
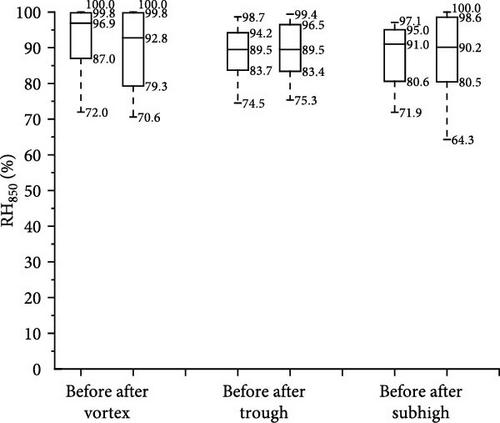
Air with less than 50% relative humidity is considered dry, while that greater than 65% is moist [11]. For the three categories, more than 75% of the events occurred under wet conditions with a relative humidity higher than 80% at 850 hPa (Figure 10d), with the highest value of 87% for the vortex. The median value for the vortex was 96.9%; with this threshold, the low-pressure trough was less than 10%, and the subtropical high was far less than 10%.
Overall, the moisture conditions of SHR for the vortex category ranked the highest.
5.2. Instability Conditions
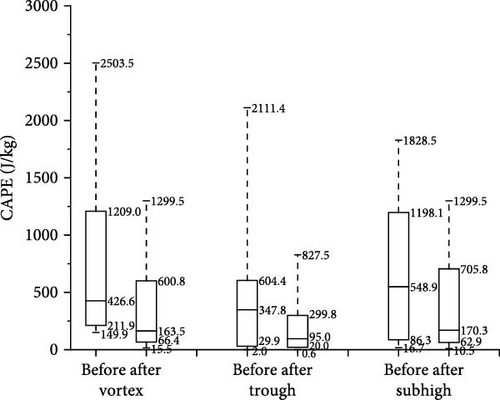
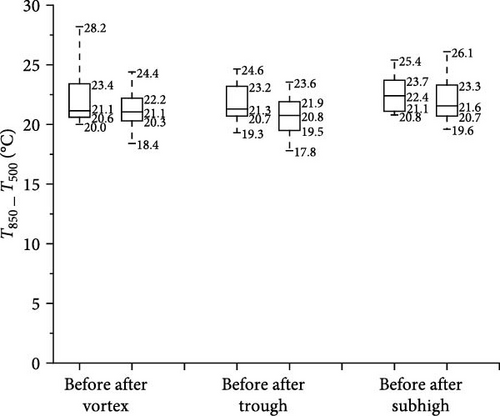
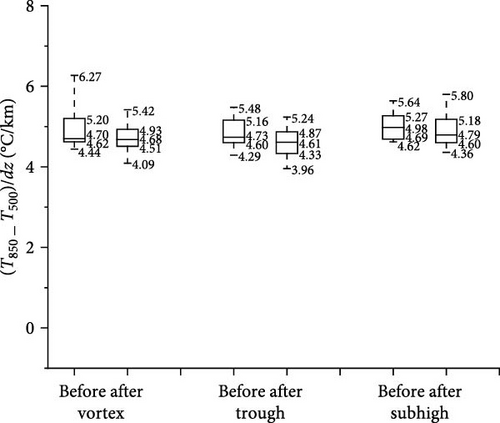
Atmospheric instability has essential implications in predicting the height and intensity of convective development. Five parameters are used to denote atmospheric instability. The convective available potential energy (CAPE) is used to represent the possible upward buoyancy force; a strong CAPE can provide more momentum for convective activity. The K index indicates potential instability, and a large K index is conducive to heavy rains. The vertical temperature gradient between 850 and 500 hPa is an indication of atmospheric instability [30]. The pseudo-equivalent potential temperature (θse) has important implications for the heavy rain area, generally occurring in the center of large values or areas with more significant gradients [34].
The median CAPE values for the three categories are very similar (Figure 11a). For low-pressure trough, 25% of the SHR events occurred with a CAPE of 604.4 J/kg, whereas this was ~50% for the vortex and subtropical high-pressure categories. Before the SHR event, ~10% of the CAPE values for the vortex category were below 150 J/kg and less than 20 J/kg for the low-pressure trough and subtropical high categories. The “7.20” extraordinary torrential rain in Beijing, the CAPE value was extremely weak [9]; in Central and Eastern China, about 25% of SHR events occurred with no CAPE [11], indicating that the SHR event can also occur in environments with weak atmospheric instability. Potential thermal instability conditions are not a prerequisite for SHR events; ordinary SHR events can occur in environments only with strong dynamic lifting and sufficient moisture conditions.
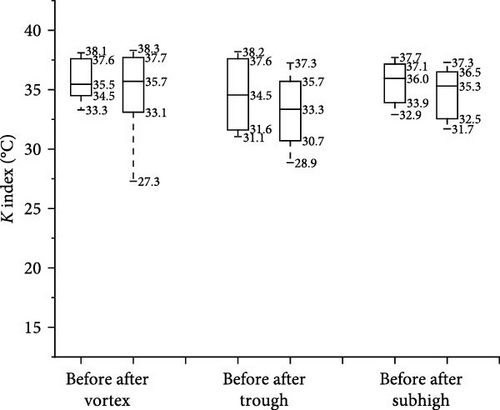
The distribution and range of the K index were similar for the three categories (Figure 11b), with 33–38 for the vortex and subtropical high categories, and 31–38 for the low-pressure trough, indicating that a K index larger than 31 was necessary for an SHR event at the CAFUC airports. Approximately 25% of SHR events occurred with K index greater than 37 for the three categories; with this threshold, the SHR events in Central and Eastern China were ~50% [11], indicating that the atmospheric instability of the SHR events in CAFUC was weaker than that Central and Eastern China.
The range of temperature difference between 850 and 500 hPa (DT85) before the event for the three categories was 20.0–28.2, 19.3–24.6, and 20.8–25.4, respectively (Figure 11c). The median value was 21.1, 21.3, and 22.4°C, respectively, which were all lower than the results of Fan and Yu [42] (23.4°C). The distribution of the vertical temperature gradient between 850 and 500 hPa for the three categories was the same as DT85, with the range of 4.44–6.27, 4.29−5.48, and 4.62–5.64 °C/km, respectively (Figure 11d). 10% of the events reached up to 6.27°C/km for the vortex.
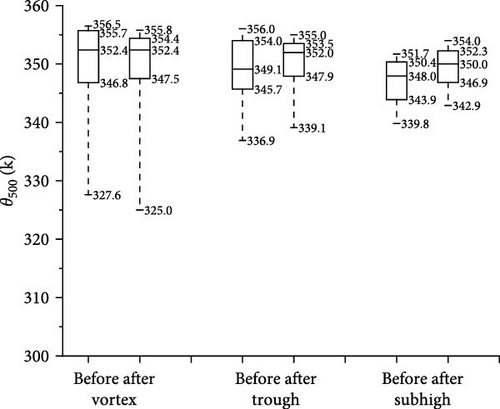
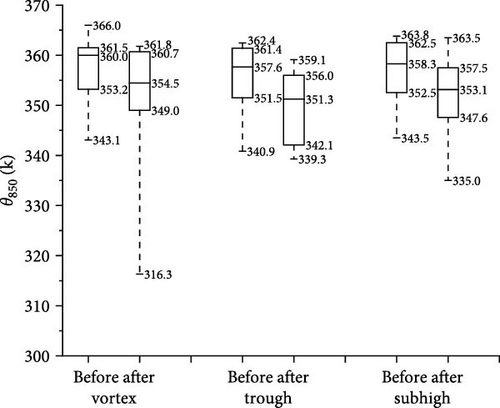
For the three categories, the range of θse at 850 and 500 hPa were 343–366, 340−362, 343–364 K, and 327–356, 336−356, 339–351 K, respectively. The median value of θse at 850 hPa was 360, 357.6, and 358.3 for the three categories, respectively, meeting the initial energy conditions for heavy rainfall in Sichuan (353 K) [37], and larger than the Central and Eastern China (349 K) [11]. The median value of θse at 850 hPa was larger than 500 hPa (Figure 11e,f), , corresponding to a state of instability of atmospheric stratification.
For the subtropical high category, the temperature at 500 hPa was the lowest, while it was the highest at 850 hPa, corresponding to the largest value of DT85 and the vertical temperature gradient, the median value difference of θse at 850 and 500 hPa (10 K) was larger than the other two (8 K), which was consistent with the thermal characteristics of the high-pressure system.
Overall, the atmospheric instability of the SHR in the subtropical high category tended to be greater, whereas the vortex and low-pressure trough categories were similar.
5.3. Dynamic Conditions
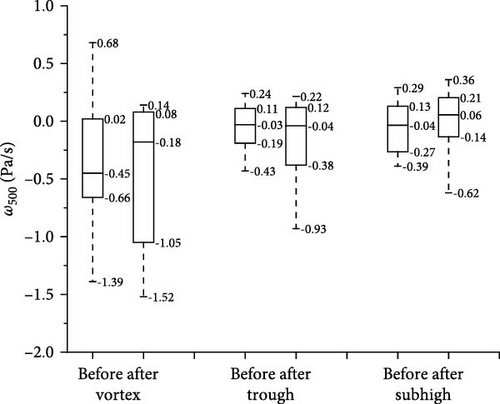
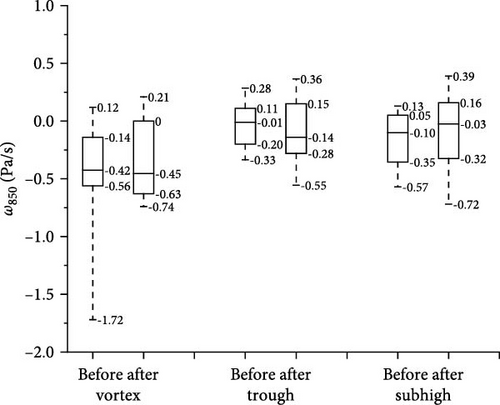
A dynamic lifting condition is necessary for triggering convection. The air parcel is lifted above the level of free convection under external forcing, overcoming the convective inhibition energy and promoting the development of a convective system under unstable stratification. Large-scale divergence is considered a convective system trigger, and maximum rainfall can occur 38 min before peak convergence or hours after maximum convergence [11]. This paper selects the vertical velocity (ω) under multilayer p coordinates, divergence, and vertical vorticity to analyze the dynamic lifting conditions during the SHR process.
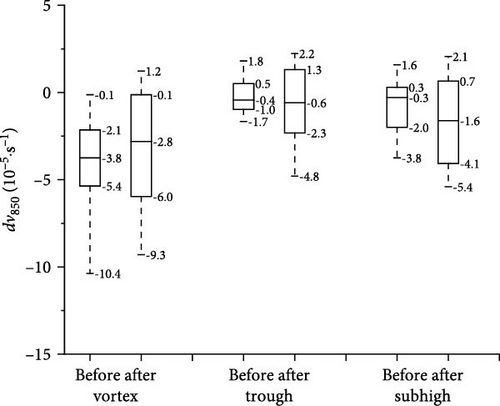
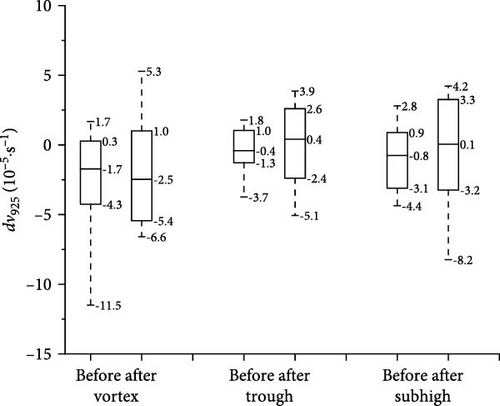
Before the occurrence of SHR associated with the vortex, they all occurred with a negative divergence at 850 hPa (Figure 12a), with a median value of −3.8 × 10⁻⁵/s, which was far greater than the same threshold of low-pressure trough (−0.4 × 10⁻⁵/s), subtropical high (−0.3 × 10⁻⁵/s), and climatology (−0.5 × 10⁻⁵/s) for SHR events in Beijing [9]. With this value, no SHR events and less than 10% events occurred for the low-pressure trough and subtropical high categories, respectively. The distribution of divergence at 925 hPa (Figure 12b) is the same as 850 hPa, with more than 75% occurring with a negative divergence for the vortex.
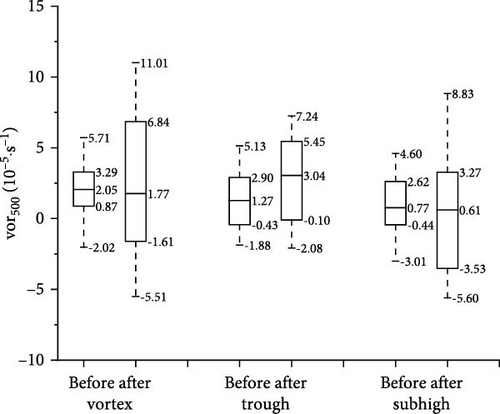
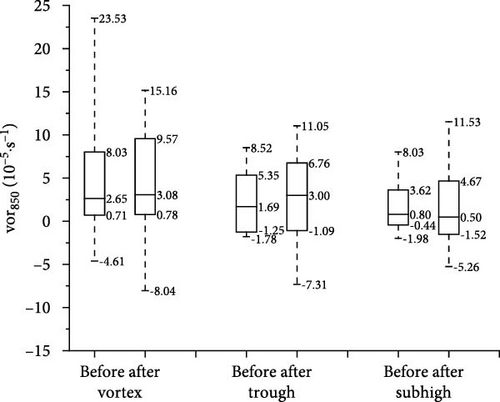
More than 75% of SHR events occurred with positive vorticity at 500 hPa for the vortex (Figure 12c), with this threshold, which was less than 50% for the low-pressure trough and subtropical high categories. The distribution of vorticity at 850 hPa (Figure 12d) was the same as at 500 hPa, with a median value of 2.65, 1.69, and 0.8 for the three categories, respectively. Approximately 10% of events were larger than 23.5 × 10⁻⁵/s for the vortex category.
The distribution of velocity for three categories (Figure 12e) was similar to the divergence; 75% of events occurred at a negative velocity, with a median value of −0.45 pa/s for the vortex, much larger than the low-pressure trough (−0.03 pa/s) and subtropical high categories (−0.04 pa/s). There were about 50% of events that occurred with a negative velocity in the low-pressure trough and subtropical high-pressure categories. The velocity distribution at 850 hPa (Figure 12f) was the same as at 500 hPa, and more than 75% of events happened at a negative velocity for the vortex.
Weisman et al. [28] indicated that in environments with low CAPE values and weak to moderate vertical wind shear, the entrainment of convective storms is enhanced, leading to increased evaporation. Precipitation efficiency decreases as vertical wind shear increases. In environments with strong vertical wind shear, convective clouds adopt a tilted structure, causing a significant portion of solid or liquid precipitation to evaporate before reaching the surface, thereby reducing effective surface precipitation [30]. For the three categories, the median values of vertical wind shear from 0 to 6 km before the SHR events were 4.6, 4.0, and 2.5 m/s, respectively, which were smaller in intensity and more conducive to enhancing the precipitation efficiency.
In general, in terms of moisture and dynamic lifting conditions, the intensity of physical quantities was the largest for the SHR events associated with the vortex category, whereas the low-pressure trough and subtropical high categories were similar. The parameters corresponding to the subtropical high category exhibited the highest intensities for atmospheric instability. These conclusions are consistent with those of Luo [34].
6. Conclusions and Discussion
From 2018 to 2022, the annual PA of SHR made the largest contribution to the annual PA (23.6%) in Guanghan, and the annual frequency of SHR had the largest ratio to the annual PF (3.8%) in Suining.
Synoptic circulation was classified into four categories for the 71 SHR selected: vortex (14 cases), low-pressure trough (29 cases), subtropical high (26 cases), and other categories (2 cases).
The average PA and PF increased from 00:00 on the day of SHR to 00:00 the next day and peaked at night, with the largest in the vortex category, peaking earlier than the other two. The average PI was largest in the subtropical high (9.3 mm/h) and lowest in the low-pressure trough (6.8 mm/h). The average PI was close during the daytime and nighttime for vortex; the average nighttime PI (7.5 mm/h) was greater than the daytime (6.1 mm/h) for low-pressure trough, as for subtropical high, the daytime PI (9.8 mm/h) exceeded the nighttime (8.7 mm/h) on the contrary. For the four thresholds of ≥0.1, ≥10, ≥20, and ≥50 mm/h, the average PA and PF of nighttime were larger than that of daytime, the vortex category was both the largest, and the peak time was shifted forward between the four thresholds, while shifted backward in the low-pressure trough. Under the three synoptic categories, the increase in PA was mainly due to the contribution of increased PF, whereas the impact of PI was relatively small.
Before the SHR, the vortex category had a better moist environment and dynamic uplift conditions than the low-pressure trough and subtropical high categories. The median value of PWAT for the vortex was 64.4 mm. With this threshold, the low-pressure trough was ~25%, and the subtropical high was ~10%. For the vortex category, almost all SHR events occurred with a negative divergence at 850 hPa, and more than 75% occurred with a positive vorticity negative velocity, with the median values far larger than the low-pressure trough and subtropical high categories.
Before the SHR, ~10% of the CAPE values for vortex were below 150 J/kg and less than 20 J/kg for the other two categories, indicating that the SHR can also occur in environments with weak atmospheric instability. The distribution of the K index was similar for the three categories, and a K index greater than 31 was necessary for an SHR event at the CAFUC airports. The median value of θse at 850 hPa was 360, 357.6, and 358.3 for the three categories, respectively, meeting the initial energy conditions for heavy rainfall in Sichuan (353 K) [37], and higher than in Central and Eastern China (349 K) [11]. With the larger median value difference of θse at 850 hPa and 500 hPa than the other two and the largest DT85 value and vertical temperature gradient, the atmospheric instability for the subtropical high category tended to be larger.
By comparing the variations in moisture, atmospheric instability, and dynamic conditions under the three synoptic categories, the dynamic nature of the vortex and low-pressure trough categories, and the thermal nature of the subtropical high category were reflected. The targeted category of environmental quantities can be determined for each synoptic pattern, which can be used as a reference during the operational forecasting of SHR at the CAFUC airports.
Conflicts of Interest
The authors declare no conflicts of interest.
Funding
Jing Zhang acknowledges that the research was supported by “the Fundamental Research Funds for the Central Universities,” Grant Number: “2023122.”
Acknowledgments
Jing Zhang acknowledges that the research was supported by “the Fundamental Research Funds for the Central Universities,” Grant Number: “2023122.” Jing Zhang acknowledges that Kang Liu, provided the observed hourly precipitation data of Suining Flight College, Civil Aviation Flight University of China.
Open Research
Data Availability Statement
In this study, hourly precipitation data were collected from automatic observation stations at four Civil Aviation Flight University of China airports. All datasets were made available by contacting the first author.


