Spatiotemporal Analysis of Climate Variability and Trends in West Arsi Zone, South-Central Ethiopia
Abstract
The objective of this study was to evaluate the historical trends and variability of rainfall and temperature and to estimate the extent of change across various agroecological zones (AEZs) in the West Arsi Zone of south-central Ethiopia from 1983 to 2019. Data on daily temperature and rainfall were collected from the Ethiopian Meteorological Institute. The study utilized the Mann–Kendall test, Sen’s slope estimator, and descriptive statistical methods to analyze data and identify trends. The analysis revealed a significant increase in mean annual temperature (p < 0.001) with 0.045°C per annum. The lowland and midland experienced significant increases in mean annual temperature (p < 0.001) by 0.063°C and 0.094°C per year, respectively, while insignificant increase was found in the highland AEZ. Analysis of rainfall revealed high interannual and seasonal variability, with the highest rainfall variability observed in the lowland. The analysis also revealed the study area experienced a significant decrease in annual average rainfall (p < 0.01) by 3.704 mm and Belg rainfall, short rainy season from mid-February to May (p < 0.05) by 22.46 mm per year. The annual number of rainy days (RDs >1 mm) shows a significant decreasing trend (p < 0.001). The analysis further revealed decreasing trends of rainfall in all AEZs where the midland experienced a significant decrease in annual rainfall (p < 0.01) by 8.72 mm and Belg rainfall (p < 0.05) by 4.734 mm. In the Kiremt rainfall pattern, there was a decreasing wet spell and an increasing dry spell, and the annual rainfall coefficient of variation (CV) was 17.22% in the highland, 26% in the midland, and 32.36% in the lowland. Overall, the detected alterations in rainfall patterns, coupled with their considerable variability, are expected to negatively affect rain-fed agriculture and the environment. The results of this study are anticipated to offer crucial insights into the spatiotemporal variability and climate trends, aiding decision-makers and development planners in crafting tailored strategies to enhance climate resilience.
1. Introduction
Global climate change has a detrimental impact on agricultural production, putting many regions of the world at risk [1–3]. Africa, including Ethiopia, is especially susceptible to climate-related risks because its communities heavily depend on natural resources like farming, herding, and fishing for their livelihoods [2, 4]. These environmental stresses expose a significant portion of the population to adverse outcomes [2].
Climate change is a global problem with threats to human existence in various parts of the world [5]. Changes in climate variability and extremes are receiving increased attention due to their significant impacts on the environment and society [6]. Analyzing climate extremes is crucial to understand their potential future impacts [7]. Fluctuation in climate extremes adversely affect food security and livelihood sources, particularly in regions where livelihood heavily dependent on water availability and a conducive climate [6]. The magnitude of this variability in precipitation and temperature, and its associated impact, varies across different locations. Therefore, detecting past trends, changes, and variability in climatic variables is important for understanding potential future changes and improving climate risk management [8].
In areas where livelihood practices depend on rainfall, studying the spatiotemporal dynamics of meteorological variables, especially rainfall and temperature, is crucial, as it can suggest feasible adaptation strategies [6]. In Ethiopia, the strong interannual and interdecadal variability of rainfall makes it challenging to detect long-term trends. However, the mean annual temperature has increased by 1.3°C, with an average increase of 0.28°C per decade between 1960 and 2006 [9]. The average annual minimum temperature in the country has increased by about 0.250°C every 10 years, while the average annual maximum temperature has increased by about 0.10°C per decade [10]. Projections indicate further temperature increases by 2060 and 2090 [9, 11–13].
Ethiopia has been plagued by recurring climate-related crises, including severe droughts and devastating floods, which have significantly impacted the country’s food security, leading to widespread hunger and related concerns [14]. However, there has been limited detailed research on the relationships between rainfall variability and fluctuations in agricultural production at regional and subregional scales until recently. The majority of the prior research on climate trend analysis was conducted at the national level, and the results showed that while precipitation changed at varying rates and with varying magnitudes across the nation, temperatures increased overall [13, 15]. However, some regional studies have found significant decreasing trends in precipitation, particularly in specific areas [8, 11, 16]. Ethiopia is experiencing more frequent and severe hydrometeorological hazards, such as floods and droughts, as a result of climate change and variability [11, 13]. Extreme rainfall, heat waves, and droughts can jeopardize food security by causing harvest failures [17]. Therefore, improving our understanding of climate extremes is essential for adaptation and mitigation strategies.
Numerous studies conducted in Ethiopia’s West Arsi Zone have focused on climate trends, their effects on rural livelihoods, vulnerability, and adaptation strategies [18–21]. However, these studies have not comprehensively addressed climate trends and variability across the diverse topography and relief features of the West Arsi Zone. Time series climate data analysis of local climate trends and variability is essential for effective decision-making and adaptation planning [8]. Furthermore, the investigation of climate change trends and variability across different agroecological zones (AEZs) is critical, as agroecology gains momentum as a scientific discipline and viable farming approach [22, 23].
Through disaggregated analysis at AEZs and aggregated analysis for the study site, this study aims to characterize the trends and variability of rainfall and temperature at different scales in the West Arsi Zone. Through a deeper understanding of climate variability and change, this research will strengthen the resilience of rural households whose livelihoods rely on rain-fed agriculture.
2. Methodology of the Study
2.1. Description of the Study Area
The study area is located in the West Arsi Zone, south-central part of Ethiopia. It extends from 6°7′55′N to 7°56′55′N latitude and 38°6′55′E to 39°43′55′E longitudes (Figure 1). The total land area of the zone is ~1,177,440 ha or 12,938 km2. West Arsi Zone was established in 2006 and consists of 12 districts, with the administrative center located in Shashemene town, which is situated 250 km south of Addis Ababa.
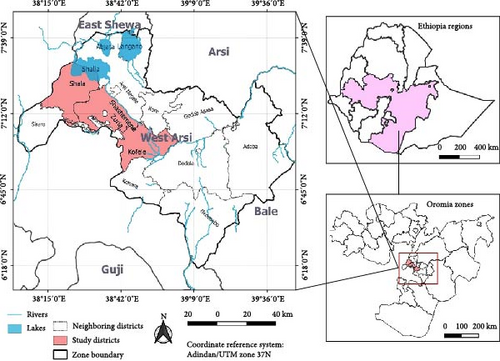
In the West Arsi Zone, the main rainy season, known as Kiremt, occurs from June to September. The dry season, called Bega, lasts from October to January, while the small rainy season, known as Belg, from February to May. The average annual rainfall in this area ranges from 800 to 1400 mm, and the average annual temperature varies between 15 and 20°C [24, 25]. The climate in the West Arsi Zone is highly influenced by its topography, resulting in significant variations with altitude and season [26, 27].
The highlands of the zone are classified as humid to subhumid tropical, while the areas along the floor of the rift valley are considered semiarid. According to Ethiopia’s classic climate category, the West Arsi Zone is divided into three distinct climate zones: Kolla, or the lowlands; Woyina-Dega, or the midlands; and Dega, or highland. These regions cover ~14.9%, 39.6%, and 45.5% of the land area of the West Arsi Zone, respectively [24, 26]. Accordingly, study sites were purposively selected from Shalla, Shashemene, and Kofale woredas dominated, respectively, by 70% lowland, 75% midland, and 90% highland agroecology [26, 28].
Farming practices such as cultivating crops and animal production are practiced side by side in rural areas, while informal enterprises such as livestock grazing, dairy, and small-scale trade are major economic activities in the urban area. The most commonly produced crops in the zone include barley, wheat, sorghum, teff, maize, haricot beans, horse beans, field peas, linseeds, tomatoes, cabbage, potato, and root crops. The zone is also known for the rearing of animals including cattle, equines (donkey, horse, and mule), and small ruminants [24]. Charcoal making and fuel wood extraction are also used as a means of livelihood mainly in the acacia woodland-dominated lowlands.
The land use/cover types of the study area include agricultural land, scattered acacia woodland, water body, and shrub/bushland; grass/grazing land, marshy/swampy land, in the lowland [29]; and rare riverine forest, state forest (conifer forest), and broad-leafed forests in the midland and highland parts. The zone has also different woody species, trees, and shrubs. The dominant vegetation types are acacia of different types, eucalyptus, Ficus sycomorus, Celtis africana, Cordia africana, Mimusops kummel, and Croton macrostachyus.
The total population of the zone is estimated to be 1,964,038 of which 973,743 are men and 990,295 women [24].
2.2. Data Source and Types
The Ethiopian Meteorological Institute (EMI) provided daily precipitation and temperature data (minimum and maximum) for three stations located in different AEZs of West Arsi Zone (Table 1). To accurately describe the climate and geographic distribution characteristics of extreme indices, gridded data representing average conditions of a 4 km grid area were used. This approach allows for a more detailed description compared to weather stations, which only provide a rough representation of the local environment.
| No. | Stations | Latitude | Longitude | Elevation (m) | Agroecology | Data period | |
|---|---|---|---|---|---|---|---|
| Temperature | Precipitation | ||||||
| 1 | Aje | 7.295 | 38.353 | 1855 | Lowland | 1983–2018 | 1983–2019 |
| 2 | Shashemene | 7.200 | 38.600 | 1927 | Midland | 1983–2018 | 1983–2019 |
| 3 | Kofale | 7.04 | 38.782 | 2674 | Highland | 1983–2018 | 1983–2019 |
Additionally, the use of gridded data was necessary due to the limited availability of long-term observed daily data from the weather stations, as they only have records for a short period of time.
The collected daily rainfall and temperature data were used to characterize rainfall and temperature trends and variability. Trends and variability of rainfall and temperature (minimum, maximum, and average) were investigated at annual, seasonal, and monthly scales. The selected indices of climate extremes used in this study and their definition by Expert Team on Climate Change Detection and Indices (ETCCDI) are presented in Table 2.
| No. | Index | Index name | Definition | Units |
|---|---|---|---|---|
| Temperature intensity and frequency | ||||
| 1 | TNx | Max Tmin | Maximum value of daily minimum temperature | °C |
| 2 | TXx | Max Tmax | Maximum value of daily maximum temperature | °C |
| 3 | TNn | Min Tmin | Minimum value of daily minimum temperature | °C |
| 4 | TXn | Min Tmax | Minimum value of daily maximum temperature | °C |
| 5 | SU25 | Summer days | Annual count when TX (daily maximum) >25°C | Days |
| Precipitation amount, frequency, and intensity | ||||
| 1 | R10 mm | Number of heavy precipitation days | Annual count of days when PRCP (daily rainfall) ≥10 mm | Days |
| 2 | R20 mm | Number of very heavy precipitation days | Annual count of days when PRCP ≥20 mm | Days |
| 3 | RD ≥ 1 mm | Wet days | Annual count of wet days when RD (daily rainfall) ≥1 mm | Days |
| 4 | PRCPTOT | Annual total wet-day precipitation | Annual total precipitation when RD (daily rainfall) ≥1 mm | mm |
| 5 | SDII | Simple daily intensity index | Annual total wet-day precipitation (PRCPTOT) divided by the annual count of wet days (RD ≥1 mm) | mm/days |
| 6 | CDD | Consecutive dry days | Maximum number of consecutive dry days (RD <1 mm) | Days |
| CWD | Consecutive wet days | Maximum number of consecutive wet days (RD ≥1 mm) | Days | |
| Onset | Onset of Kiremt season (June to September) | First 5 days after June 1 that total 20 mm or more with at least 3 wet days (RD ≥1 mm) and that is not followed by followed by a 7 dry spell (RD <1 mm). The actual date of onset is the first wet day of the wet event | mm/days | |
2.3. Methods for Testing and Estimating Trends and Extremes of Temperature and Precipitation
The data collected for this study underwent a quality check to ensure accuracy. No issues were found, such as negative daily rainfall or maximum temperatures lower than minimum temperatures. After the quality check, various indices were used to analyze long-term climate trends and extreme weather events (Table 2). The presence of significant changes and the magnitude of trends in climate parameters were determined using trend tests [30]. For the analysis of rainfall data, long-term mean values, as well as indices of variability and trends was calculated at monthly, seasonal, and annual time scales. The mean, standard deviation (SD), and coefficient of variation (CV) were calculated to assess spatiotemporal variability in rainfall and temperature indices. The precipitation concentration index (PCI) and standardized precipitation anomaly (SPA) were also used as statistical descriptors of rainfall variability.
2.4. Mann–Kendall’s Test
In this study, trends in temperature and precipitation variables and indices were examined using the Mann–Kendall test of Mann [36] and Kendall [37]. In particular, this test is frequently used to examine trends in temperature and precapitation variables and indices in time series data [6]. This nonparametric statistical test is advantageous because it does not require the data to follow a normal distribution, making it suitable for non-normal and skewed distributions. Furthermore, it is more resilient to outliers compared to parametric tests, optimizing its robustness [8]. Additionally, the Mann–Kendall test demonstrates greater robustness against outliers compared to parametric tests [8].
A significance level α = 0.001, 0.01, 0.05, or 0.1 can be used to test either an upward or downward monotone trend [39]. The decision for the two-tailed test was made by comparing the computed Z with critical values. The null hypothesis is rejected when the absolute value of computed Z is greater than the critical values or the p-value is less than the selected significance level (α = 0.05 or 0.1). Moreover, the result is deemed statistically significant when the null hypothesis is rejected, and the trend direction is upward for positive Z-values and downward for negative Z-values [39, 40].
2.5. Sen’s Slope Estimator Test
Overall, the Mann–Kendall test’s main advantage is that it does not require a particular data distribution, but its main disadvantage is that it cannot be used with time series data that have autocorrelation. This implies that patterns in the data that show a dependence on prior values may not be accurately captured by the test [39]. The statistical analyses and computations of climatic data can be performed using the Excel template—MAKESENS developed by the Finnish Meteorological Institute in 2002 (freeware V.1). This template requires a minimum of four values to compute the Mann–Kendall test and at least 10 values in time serious to calculate the confidence interval for Sen’s slope estimator [39, 40].
3. Result
3.1. Annual Temperature and Rainfall Characteristics in the Study Area
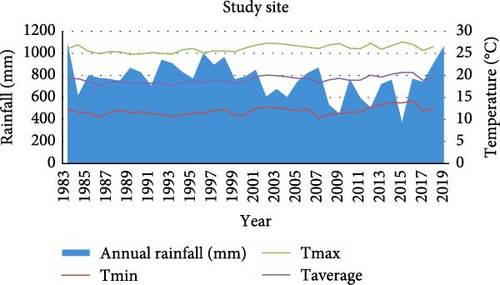
The aggregated average temperature of the three stations (Aje, Shashemene, and Kofale) was found to be 19°C, while the mean annual rainfall was 768 mm over the period 1983–2019. Considering each station individually, the mean annual rainfall generally varies from 626 mm in Aje, 778 mm Shashemene, and 900 mm in Kofale stations, while the mean annual temperature ranges from 20.38°C in Aje to 19.73°C in Shashemene, and 18°C in Kofale, representing lowland, midland, and highland AEZs, respectively. The mean annual minimum temperature across the sites was recorded as 12°C and varied across stations, Aje/lowland having the highest mean minimum temperature of 13°C followed by midland/Shashemene 12.23°C, and Kofale/highland 10.55°C. Furthermore, the mean annual maximum temperature at the sites was 26°C, with variations across stations: 22.8°C at Aje, 27.24°C at Shashemene, and 23.2°C at Kofale (Figure 2).
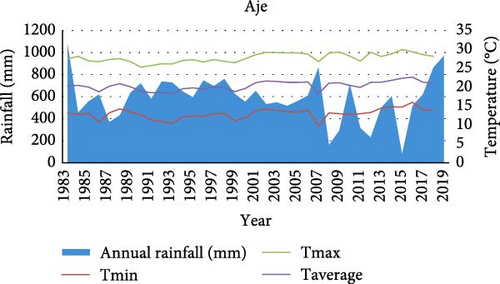
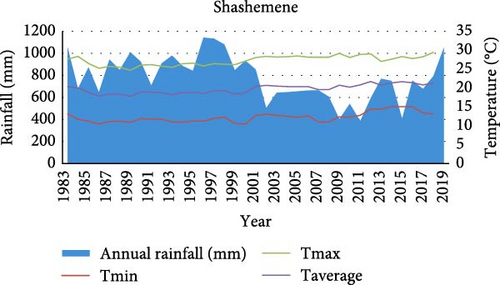
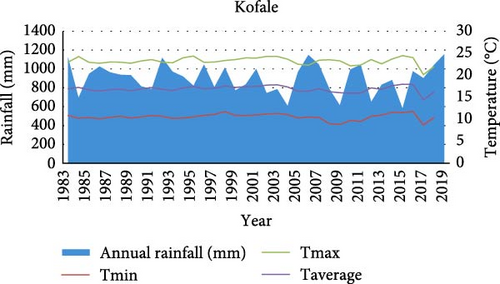
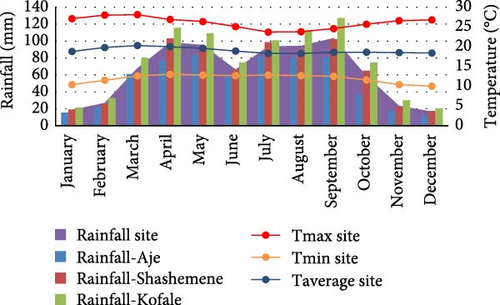
In the study area, temperatures fluctuate throughout the year with the highest average temperature record which was in March (20.35°C), while the lowest (18.25°C) was in August. The mean monthly rainfall values range from a low of 11.13 mm in December at Aje to a high of 127 mm in August at Kofale. For the study site, the mean monthly rainfall ranges from a low 18.6 mm in December to a high of 103.5 in September (Figure 3).
3.2. Annual, Seasonal, and Monthly Temperature Variability and Trends
3.2.1. Analysis of Annual Temperature Variability and Trends
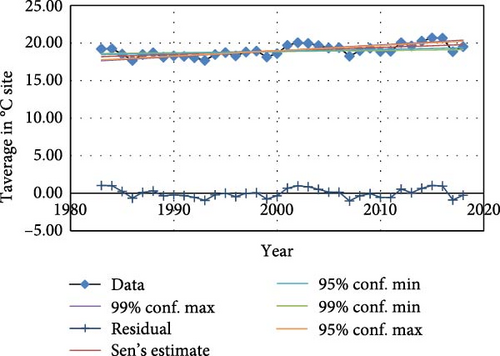
The analysis of the CV revealed that the Taverage (mean annual temperature) had a CV of 5.78% in the midland, 5.64% in the lowland, and 4.33% in the highland stations. Trend analysis revealed that climate in the study area has undergone a general warming trend from 1983 to 2018 (Figure 4). The aggregated Taverage (mean annual temperature) exhibited a significant increase (p < 0.001) of 0.045°C per year during this period. Moreover, the aggregated average Tmin (minimum temperature) showed a significant increase (p < 0.01) of 0.045°C per year.
Regarding the spatial variation of temperature trends, the magnitude of the increase differed between the Tmin and Tmax. The midland AEZs experienced the greatest magnitude of increase, while the highland AEZs observed the smallest increase during the observation period (Table 3). The mean annual temperature raised significantly (p < 0.001) at an average rate of 0.063°C per year in lowland and by 0.094°C per year in the midland, while highland AEZ experienced a much smaller increase of 0.001°C per year. Furthermore, the Mann–Kendall trend test revealed significant increase in Tmin (p < 0.01) and Tmax (p < 0.001) in the lowland and midland AEZs (Table 3).
| Stations | Parameters | Min | Max | Mean | SD | CV | ZMK | Slopes |
|---|---|---|---|---|---|---|---|---|
| Aje (lowland) | Tmin | 9.75 | 15.98 | 13 | 1.32 | 10.15 | 2.87 | 0.054 ∗∗ |
| Tmax | 25.31 | 29.98 | 27.8 | 1.2 | 4.32 | 3.42 | 0.069 ∗∗∗ | |
| Taverage | 18.24 | 22.67 | 20.38 | 1.15 | 5.64 | 3.36 | 0.063 ∗∗∗ | |
| Shashemene (midland) | Tmin | 10.41 | 15.05 | 12.23 | 1.31 | 10.71 | 3.8 | 0.079 ∗∗∗ |
| Tmax | 24.68 | 29.41 | 27.24 | 1.27 | 4.66 | 4.24 | 0.097 ∗∗∗ | |
| Taverage | 17.78 | 21.67 | 19.73 | 1.14 | 5.78 | 4.94 | 0.094 ∗∗∗ | |
| Kofale (highland) | Tmin | 8.70 | 11.8 | 10.55 | 0.73 | 6.92 | 0.86 | 0.008 |
| Tmax | 20.13 | 24.43 | 23.2 | 0.84 | 3.62 | −0.07 | −0.001 | |
| Taverage | 14.41 | 18 | 16.87 | 0.73 | 4.33 | 0.07 | 0.001 | |
| Areal average | Tmin | 10.38 | 14.28 | 12 | 0.92 | 7.67 | 2.74 | 0.045 ∗∗ |
| Tmax | 24.72 | 27.56 | 26 | 0.83 | 3.19 | 3.50 | 0.051 ∗∗∗ | |
| Taverage | 17.76 | 20.67 | 19 | 0.78 | 4.11 | 3.69 | 0.045 ∗∗∗ | |
- ∗∗ α = 0.01; ∗∗∗ α = 0.001.
3.2.2. Analysis of Seasonal and Monthly Temperature Variability and Trends
The Mann–Kendall trend test indicates increasing trends in the average temperature for all months and seasons. Seasonal scale analysis revealed the highest significant increase during the Bega season (p < 0.001) at a rate of 0.055°C per year. Furthermore, the seasonal scale analysis revealed significant increase in the minimum temperature in Bega (p < 0.001) and in the maximum temperature has highest significant increase in Kiremt (p < 0.001) (Table 4).
| Time | Mean | SD | CV% | Tmax | Tmin | Taverage | |||
|---|---|---|---|---|---|---|---|---|---|
| ZMK | Slope | ZMK | Slope | ZMK | Slope | ||||
| January | 18.76 | 0.88 | 4.69 | 1.59 | 0.023 | 3.12 | 0.068 ∗∗ | 3.53 | 0.052 ∗∗∗ |
| February | 19.76 | 0.98 | 4.95 | 2.22 | 0.053 ∗ | 2.22 | 0.052 ∗ | 3.46 | 0.060 ∗∗∗ |
| March | 20.35 | 1.04 | 5.11 | 1.69 | 0.046+ | 1.32 | 0.021 | 2.13 | 0.032 ∗ |
| April | 19.98 | 0.90 | 4.50 | 3.15 | 0.069 ∗∗ | 0.34 | 0.006 | 2.53 | 0.040 ∗ |
| May | 19.60 | 0.88 | 4.48 | 3.20 | 0.052 ∗∗∗ | 1.12 | 0.023 | 2.51 | 0.039 ∗ |
| June | 18.89 | 0.86 | 4.55 | 4.13 | 0.068 ∗∗∗ | 1.39 | 0.023 | 3.36 | 0.046 ∗∗∗ |
| July | 18.29 | 0.81 | 4.42 | 3.85 | 0.075 ∗∗∗ | 1.48 | 0.030 | 3.38 | 0.047 ∗∗∗ |
| August | 18.25 | 0.92 | 5.04 | 3.42 | 0.052 ∗∗∗ | 1.33 | 0.024 | 2.71 | 0.037 ∗∗ |
| September | 18.57 | 0.82 | 4.41 | 3.57 | 0.053 ∗∗∗ | 2.29 | 0.038 ∗ | 3.27 | 0.049 ∗∗ |
| October | 18.64 | 0.97 | 5.20 | 2.60 | 0.063 ∗∗ | 3.85 | 0.072 ∗∗∗ | 4.44 | 0.069 ∗∗∗ |
| November | 18.48 | 1.08 | 5.84 | 1.32 | 0.023 | 3.94 | 0.095 ∗∗∗ | 3.15 | 0.053 ∗∗ |
| December | 18.37 | 1.00 | 5.44 | 1.09 | 0.016 | 2.87 | 0.070 ∗∗ | 2.77 | 0.042 ∗∗ |
| Bega (October to January) | 18.56 | 0.88 | 4.74 | 1.92 | 0.025+ | 3.72 | 0.077 ∗∗∗ | 3.56 | 0.055 ∗∗∗ |
| Belg (February to May) | 19.92 | 0.85 | 4.26 | 3.50 | 0.061 ∗∗∗ | 1.48 | 0.027 | 3.01 | 0.040 ∗∗ |
| Kiremt (June to September) | 18.50 | 0.75 | 4.05 | 4.13 | 0.060 ∗∗∗ | 1.70 | 0.033+ | 3.31 | 0.043 ∗∗∗ |
- ∗ α = 0.05; ∗∗ α = 0.01; ∗∗∗ α = 0.001; +α = 0.1.
When considering the disaggregated analysis of seasonal temperature trends at different agroecological scales, the highest significant increase in Taverage was observed during the Bega season (p < 0.001), with the lowland experiencing an increase of 0.081°C per year and the midland experiencing an increase of 0.118°C per year throughout the observation period (Table 5).
| Stations | Tmin | Tmax | Taverage | ||||||
|---|---|---|---|---|---|---|---|---|---|
| Kiremt | Belg | Bega | Kiremt | Belg | Bega | Kiremt | Belg | Bega | |
| Aje | 0.029 | 0.031 | 0.108 ∗∗∗ | 0.054 ∗∗ | 0.091 ∗∗∗ | 0.070 ∗∗∗ | 0.043 ∗ | 0.057 ∗∗ | 0.081 ∗∗∗ |
| Shashemene | 0.047 ∗ | 0.061 ∗∗ | 0.141 ∗∗ | 0.118 ∗∗∗ | 0.098 ∗∗∗ | 0.063 ∗∗ | 0.091 ∗∗∗ | 0.080 ∗∗∗ | 0.110 ∗∗∗ |
| Kofale | 0.010 | −0.001 | 0.012 | 0.029 | 0.011 | −0.038 ∗ | 0.015 | 0.004 | −0.014 |
| Site | 0.033+ | 0.027 | 0.077 ∗∗∗ | 0.060 ∗∗∗ | 0.061 ∗∗∗ | 0.025+ | 0.043 ∗∗∗ | 0.040 ∗∗ | 0.055 ∗∗∗ |
- ∗ α = 0.05; ∗∗ α = 0.01; ∗∗∗ α = 0.001; +α = 0.1.
Overall, the analysis conducted at the annual, seasonal, and monthly scales consistently revealed a warming trend in the study area over the period of observation, and this warming trend had implications for extreme temperature indices, related to both the Tmin and Tmax, particularly in the lowland and midland AEZs. Specifically, the Mann–Kendall trend analysis indicated a significant positive trend (p < 0.001) in the number of summer days (SU25) by 1.66 days per year in the study area. Further, analysis revealed that SU25 exhibited a significant increasing trend (p < 0.001) in the midland AEZ by 4.02 days per year (Table 6).
| Index | Unit | Z statistics lowland (Aje) | Sen’s slope lowland (Aje) | Z statistics midland (Shashemene) | Sen’s slope midland (Shashemene) | Z statistics highland (Kofale) | Sens’s slope highland (Kofale) | Z statistics areal average | Sen’s slope average (site) |
|---|---|---|---|---|---|---|---|---|---|
| SU25 | Days | 2.89 | 1.488 ∗∗ | 4.77 | 4.029 ∗∗∗ | −0.57 | −0.488 | 2.98 | 1.667 ∗∗∗ |
| TXX | °C | 3.57 | 0.115 ∗∗∗ | 4.91 | 0.159 ∗∗∗ | 0.59 | 0.012 | 4.28 | 0.087 ∗∗∗ |
| TXn | °C | 1.43 | 0.057 | 3.94 | 0.092 ∗∗∗ | 1.16 | 0.033 | 2.74 | 0.060 ∗∗ |
| TNX | °C | 1.15 | 0.035 | 2.99 | 0.07 ∗∗ | −0.22 | 0.000 | 2.00 | 0.033 ∗ |
| TNn | °C | 2.81 | 0.095 ∗∗ | 3.67 | 0.118 ∗∗∗ | −0.16 | 0.000 | 3.39 | 0.071 ∗∗∗ |
- ∗ α = 0.05; ∗∗ α = 0.01; ∗∗∗ α = 0.001.
3.3. Annual, Seasonal, and Monthly Rainfall Variability and Trends
3.3.1. Analysis of Rainfall Variability
In the study area, the Kiremt and Belg rainfall had contributed 47% and 38%, respectively, to the annual total over the last four decades (1983–2019). The Kiremt rainfall (June to September) largely contribute to the annual rainfall in all stations and its contribution varies from 48% in the lowland and 46% in the midland and highland. Belg rainfall (February to May) also makes a considerable contribution to annual rainfall totals which varies from nearly 39% in the lowland and 38% in the midland and highland. Overall, Aje (lowland) has the lowest annual rainfall, while Kofale (highland) has the highest. The Kiremt season generally contributes more to the total annual rainfall compared to the Belg season across all stations (Table 7).
| Stations | Annual rainfall (mm) | Kiremt rainfall (mm) | Belg rainfall (mm) |
|---|---|---|---|
| Aje (lowland) | 626.40 | 302.75 (48.33%) | 242.67 (38.74%) |
| Shashemene (midland) | 778 | 360.34 (46.31%) | 295.30 (38%) |
| Kofale (highland) | 900 | 415.43 (46.16%) | 338 (37.56%) |
| Average (site) | 768.12 | 359.51 (46.80%) | 292 (38%) |
CV was employed to characterize the spatial variability of rainfall, and the result revealed high interannual and seasonal rainfall variability in the study area. Specifically, the annual rainfall CV was 17.22% in the highland (Kofale), 26% in the midland (Shashemene), and 32.36% in the lowland (Aje) stations throughout the observation period (Table 8). Moreover, the Belg rainfall exhibited higher variability compared to both the annual and Kiremt rainfall across all AEZs, with CV values of 39.89% in the lowland, 36.44% in the midland, and 29.71% in the highland. The Kiremt rainfall also displayed high variability, with CV values of 35% in the lowland, 29.59% in the midland, and 23.7% in the highland AEZs. Additionally, the analysis of monthly rainfall CV, averaged for the entire study site, revealed high variability during the drier months (October to January) of the Bega season, with values ranging between 113% in January and 130% in November (Table 8).
| Stations | CV% | Average PCI index | ||||
|---|---|---|---|---|---|---|
| Annual | Kiremt | Belg | Annual | Kiremt | Belg | |
| Aje (lowland) | 32.36 | 35 | 39.89 | 14.58 | 9.69 | 12.07 |
| Shashemene (midland) | 26 | 29.56 | 36.44 | 12.69 | 9.07 | 11.92 |
| Kofale (highland) | 17.22 | 23.7 | 29.71 | 12 | 9 | 11.35 |
| Average (site) | 20.68 | 24.45 | 30.31 | 13.1 | 9.25 | 11.78 |
- Abbreviations: CV, coefficient of variation; PCI, precipitation concentration index.
PCI: The analysis of PCI values indicated that all stations in the study area had an average annual PCI index greater than 12. According to Oliver [41], PCI values of less than 10 indicate uniform monthly distribution of rainfall, values between 11 and 20 indicate high concentration, and values above 21 indicate very high concentration [32, 35]. This suggests that there is irregular distribution of rainfall or a high concentration of rainfall in certain seasons and months of the year rather than an even distribution throughout the study area. The annual PCI values ranged between 11–31 in the lowland, 10–17 in the midland, and 10–15 in the highland (Table 8).
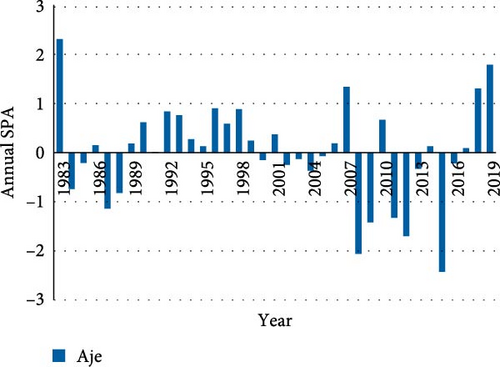
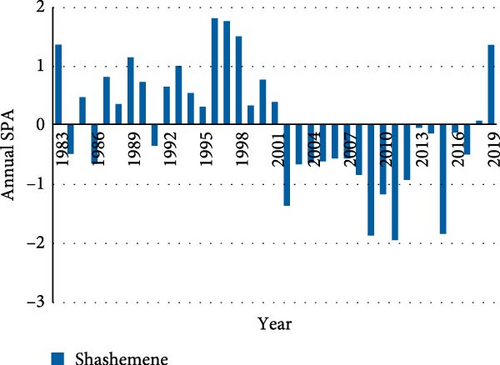
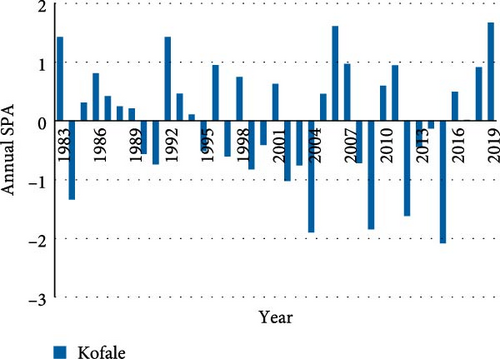
SPAs: The analysis of meteorological droughts at annual and seasonal time scales revealed varying magnitudes of drought in the study area, particularly from 2002 to 2019 (Table 9). As indicated in Bewket (2009), the drought severity classes are classified as extreme drought (S < −1.65), severe drought (−1.28 > S > −1.65), moderate drought (−0.84 > S > −1.28), and no drought (S > −0.84).
| Stations | Drought severity and observed periods | ||
|---|---|---|---|
| Extreme drought (SPA < −1.65) | Severe drought (−1.65 < SPA < −1.28) | Moderate drought (−1.28 < SPA < −0.84) | |
| Lowland (Aje) | 2004, 2009, 2015 | 1984, 2012 | 2002 |
| Midland (Shashemene) | 2009, 2011, 2015 | 2002 | 2010, 2003 |
| Highland (Kofale) | 2004, 2009, 2015 | 1984, 2012 | 2002 |
| Study site | 2009, 2015 | 2012 | 1984, 2002, 2004, 2008 |
- Abbreviation: SPA, standardized precipitation anomaly.
A disaggregated analysis of the annual SPA revealed three extreme drought years between 2004 and 2015 in the lowland area, while the midland area experienced three extreme drought years between 2009 and 2015. This suggests that the midland area experienced extreme drought events within a 3- to 5-year period while the lowland area within a 6- to 7-year period. Furthermore, the aggregated analysis of the average SPA at seasonal scales indicated the occurrence of extreme droughts in the Kiremt season of 2009 and 2015. Additionally, extreme droughts were observed in the Belg seasons of 2008 and 2015 (Figure 5).

The CV values range from a low of 46.58% in July to a high of 129.70% in November. Months with higher CV values have a larger spread relative to their mean values. The data suggests that there are significant variations in the values throughout the year. Months like October and November have higher CV values, indicating higher relative variability. On the other hand, months like July and August have lower CV values, indicating lower relative variability (Table 10).
| Month | Mean annual rainfall | SD | CV (%) |
|---|---|---|---|
| January | 20.35 | 23.14 | 113.71 |
| February | 30.26 | 38.34 | 126.70 |
| March | 70.81 | 37.14 | 52.45 |
| April | 104.52 | 57.46 | 54.97 |
| May | 102.45 | 51.56 | 50.32 |
| June | 71.37 | 37.18 | 52.09 |
| July | 98.71 | 45.98 | 46.58 |
| August | 102.32 | 59.05 | 57.71 |
| September | 110.28 | 52.62 | 47.7 |
| October | 63.60 | 51.39 | 80.80 |
| November | 26.12 | 33.88 | 129.70 |
| December | 18.13 | 21.23 | 117.09 |
- Abbreviations: CV, coefficient of variation; SD, standard deviation.
3.3.2. Analysis of Rainfall Trends
Annual rainfall trends: Analysis of annual rainfall showed significant negative trends in the study area. Annual rainfall in the study site decreased by 3.7 mm per year over the observation period (Figure 6).
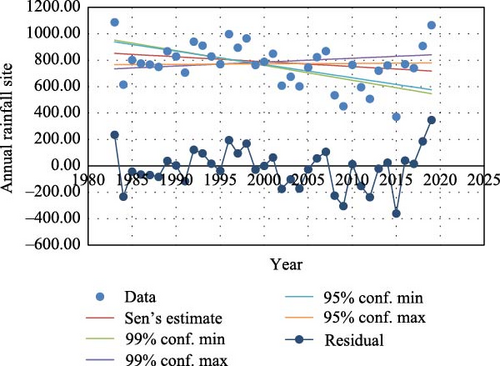
The disaggregated analysis of annual rainfall at the agroecological level revealed a consistent decreasing trend in the midland area, while the lowland and highland areas exhibited inconsistent decreasing trends (Table 11). The midland area had the highest significant decreasing trend (p < 0.05) in annual rainfall at a rate of 8.7 mm per year. In contrast, the lowland and highland areas showed insignificant decreases in annual rainfall, with rates of 1.81 mm/year and 1.32 mm/year, respectively, over the last four decades. Analysis of the Belg (short rainy season from February to May) rainfall trends indicated significant decrease in the study area. The results indicated a significant (p < 0.05) decreasing trend in Belg rainfall in the midland with a rate of 0.473 mm/year, while the lowland and highland areas showed insignificant decreasing trends during period of observation. For the Kiremt (main rainy season) rainfall, the analysis revealed inconsistent trends among the different AEZs. In the lowland and midland areas, there were insignificant decreasing trends, while the highland area showed an increasing trend in Kiremt rainfall. Overall, the analysis of mean seasonal rainfall for the study site indicated a decreasing trend in both Belg and Kiremt rainfall during the observation period (Table 11).
| Stations | Annual rainfall | Kiremt rainfall | Belg rainfall | |||
|---|---|---|---|---|---|---|
| ZMK | Slope | ZMK | Slope | ZMK | Slope | |
| Aje (lowland) | −0.75 | −1.815 | −1.09 | −2.030 | −0.41 | −0.577 |
| Shashemene (midland) | −2.58 | −8.72 ∗∗ | −1.63 | −2.030 | −2.52 | −4.734 ∗ |
| Kofale (highland) | −0.38 | −1.325 | 0.30 | 0.616 | −1.16 | −2.012 |
| Site average | −1.84 | −3.704+ | −1.35 | −1.17 | −1.71 | −2.46+ |
- Note: ZMK is Mann–Kendall trend test, slope (Sen’s slope).
- ∗ α = 0.05; ∗∗ α = 0.01; +α >0.1.
Monthly rainfall trends: The Mann–Kendall trend test was performed on the aggregated average rainfall data, revealing a decreasing trend in all months. The wettest months of the Kiremt season (June to September) and the Belg season (February to May) showed significant negative trends, indicating a decrease in rainfall (Table 12). When considering the monthly rainfall within the Kiremt season, the lowland area experienced a significant decreasing trend in July. The midland area showed significant decreasing rainfall trends in June and September. The highland area had insignificant increasing rainfall in August, September, and May but showed decreasing trends in the wettest months of February to April, June, and July. Overall, the aggregated analysis of monthly rainfall indicated a decrease in rainfall during all the wettest months of the Belg and Kiremt seasons, which are the short rainy season and the main growing season, respectively.
| Stations | June | July | August | September | ||||
|---|---|---|---|---|---|---|---|---|
| ZMK | Slope | ZMK | Slope | ZMK | Slope | ZMK | Slope | |
| Aje (lowland) | −1.29 | −0.527 | −1.68 | −0.932+ | −1.27 | −0.622 | −1.21 | −0.878 |
| Shashemene (midland) | −1.65 | −0.615+ | −1.43 | −0.862 | −1.46 | −0.842 | −1.95 | −1.371+ |
| Kofale (highland) | −0.78 | −0.317 | −0.67 | −0.319 | 0.40 | 0.316 | −0.45 | −0.121 |
| Site | −1.46 | −0.59 | −1.68 | −1.02+ | −0.97 | −0.34 | −1.59 | −0.99 |
| Stations | February | March | April | May | ||||
| ZMK | Slope | ZMK | Slope | ZMK | Slope | ZMK | Slope | |
| Aje (lowland) | −0.71 | −0.199 | −0.07 | −0.100 | −0.15 | −0.215 | −0.40 | −0.371 |
| Shashemene (midland) | −0.75 | −0.291 | −2.11 | −1.460 ∗ | −1.62 | −1.82 | −0.97 | −0.882 |
| Kofale (highland) | −1.40 | −0.594 | −0.83 | −0.474 | −1.21 | −2.267 | 0.40 | 0.471 |
| Site | −0.91 | −0.366 | −1.46 | −0.919 | −1.59 | −1.376 | −0.99 | −0.943 |
- Note: ZMK is Mann–Kendall trend test, slope (Sen’s slope).
- ∗ α = 0.05; +α >0.1.
The rainfall frequency and intensity indices indicate a significant decrease in the frequency of heavy (R10 mm) and very heavy (R20 mm) precipitation days in the study area (Table 13). The midland AEZ shows significant decreasing trends for both R10 mm (p < 0.01) and R20 mm (p < 0.05). In the lowland AEZ, there is an insignificant decrease in R10 and R20 mm, while no trend was found in the highland AEZ. In terms of the annual number of rainy days (RDs >1 mm), the study area experiences a range of 86–189 days per year, with an average of 141 days per year. The lowland, midland, and highland areas have average annual numbers of RDs of 115, 128, and 179, respectively. In the lowland, the annual number of RDs ranges from 21 in 2015 to 200 in 1993. The average simple daily intensity index (SDII), which represents the ratio of annual rainfall (PRCPTOT) when RR >1 mm to the annual number of RDs (RDs >1 mm), shows a significant decreasing trend (p < 0.001) with a magnitude of 0.04 mm/day in the study area from 1983 to 2019. The average simple daily rainfall intensity index is 5.67 mm/day, 5.82 mm/day, and 4.78 mm/day in the lowland, midland, and highland AEZs, respectively.
| Index | Unit | Aje | Shashemene | Kofale | Site average | ||||
|---|---|---|---|---|---|---|---|---|---|
| ZMK | Sen’s slope | ZMK | Sen’s slope | ZMK | Sen’s slope | ZMK | Sen’s slope | ||
| R10 mm | Days | −0.95 | −0.102 | −3.20 | −0.525 ∗∗ | −0.30 | 0.000 | −2.62 | −0.222 ∗∗ |
| R20 mm | Days | −1.57 | −0.054 | −2.35 | −0.100 ∗ | −0.61 | 0.000 | −3.09 | −0.091 ∗∗ |
| PRCPTOT | mm | −0.82 | −2.529 | −2.58 | −8.772 ∗∗ | −0.30 | −1.019 | −1.95 | −0.312+ |
| SDII | mm/days | −0.92 | −0.019 | −4.51 | −0.082 ∗∗∗ | −0.41 | −0.006 | −2.67 | −0.040 ∗∗ |
- Note: Significant at ∗ α = 0.05; ∗∗ α = 0.01; ∗∗∗ α = 0.001; +α >0.1.
3.3.3. Trend of Wet and Dry Spell
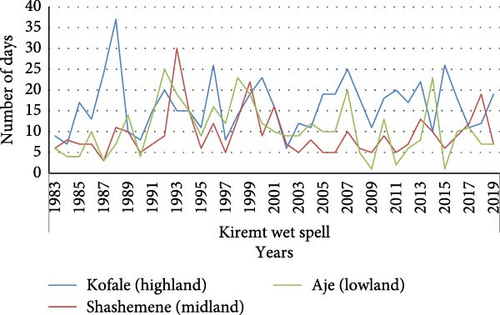
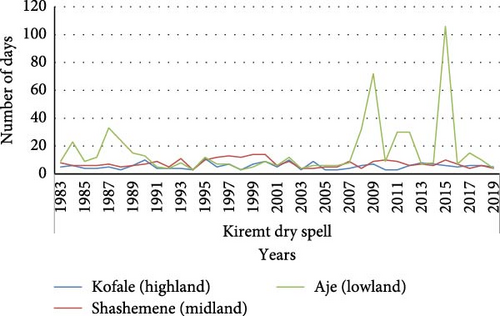
The mean wet spell of the Kiremt season was found to be 11 days in the lowland, 9 days in the midland, and 16 days in the highland. The Kiremt season wet spell ranges from 1 to 25 days in the lowland, 3 to 30 days in the midland, and 6 to 37 days in the highland AEZs. The mean dry spell during the Kiremt season was found to be 16 days in the lowlands, 8 days in the midlands, and 6 days in the highlands. The dry spell during the Kiremt season ranges from 3 to over 100 days in the lowland, 3 to 14 days in the midland, and 3 to 11 days in the highland AEZs. The mean wet spell of the Belg season was found to be 5 days in the lowlands, 6 days in the midlands, and 8 days in the highlands, while the mean dry spells during the Belg season were found to be more than 25 days in all AEZs. The wet spell during Kiremt season has a CV of 59.23% in the lowland, 57.39% in the midland, and 40.11% in the highland AEZs. The wet spell during Belg season has a CV of 81.19% in the lowland, 62.20% in the midland, and 46.24% in the highland AEZs, respectively, spell during variability in the highland AEZs during both of the shorter Belg and longer Kiremt rainfall seasons. Overall, the wet spells decreased (Figure 7), while dry spells increased (Figure 8) during the period of observation, with high variability in the lowland and low variability in the highland AEZs.
3.3.4. Trend of Dates of Kiremt Rainfall Onset and Offset
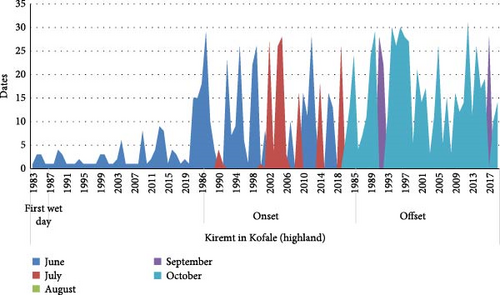
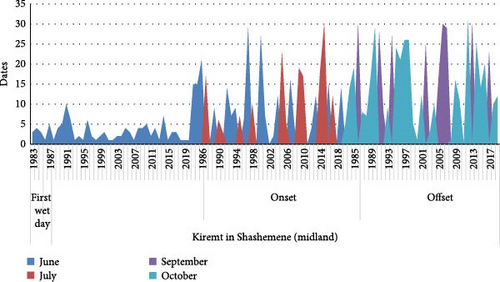
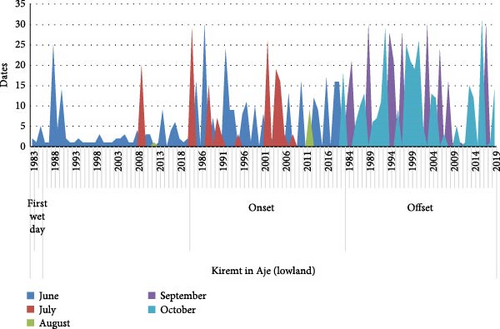
The first wet day during the Kiremt season is between June 1 and June 25 in lowland, with an exception in 2009, which is on August 20, June 1 to June 10 in midland, and June 1 to June 9 in the highland AEZs. On average, the first wet day of Kiremt season is on June 2 for highland and on June 3 for lowland and midland AEZs. The mean onset date was between June 12 and July 13 in the lowland, between June 11 and 14 in the midland, and between June 13 and July 14 in the highland AEZs. The earliest onset date for Kiremt in the midland and highland was June 5, while June 6 was the earliest onset of Kiremt in the lowland. The Kiremt rainfall cessation period was between September 26 and October 16 in the highland (Figure 9), between September 25 and October 14 in the midland (Figure 10), and between September 20 and October 13 in the lowland (Figure 11). Overall, the onset of rainfall for the growing season is likely to change from the expected mid-June to mid-July and end in early October, particularly in the lowland and midland AEZs. The implication of this is that from 1 year to the next, the length of the growing period is decreasing in the study area.
4. Discussion
Rainfall and temperature analysis revealed trends of rising temperatures and falling precipitation throughout the study area in all AEZS, with the midland (Shashemene) showing the largest and most notable increase. The study area’s rainfall pattern demonstrates different rates of variability, with the highland station (Kofale) having the lowest variability and the lowland station (Aje) having the highest. Analyzing rainfall variability and trends is primarily necessary to comprehend local climate, including rainfall patterns and amounts in specific locations and times [32]. The trends and variability of climate in the study area were analyzed using eight indices for rainfall (Tables 7–12) and six indices for temperature (Tables 3–6). At the annual, seasonal, and monthly time scales, trends and variability in temperature and rainfall were evaluated using both combined data for the study site and disaggregated data (for each station representing lowland, midland, and highland agroecology).
Analysis of temperature revealed significant rise in temperatures (Tmin,Tmax, and Taverage) in the study area, which is in agreement with warming trends in maximum and minimum temperatures reported by different authors for different regions of Ethiopia. Interns of seasonal scale analysis average, Taverage showed the highest significant increase in Bega which is line with different studies that revealed increasing Tmin and Tmax temperatures during the Bega season in different regions of Ethiopia [42]. In Ethiopia, studies confirmed an increase of 1°C in annual temperature, since the 1960s, with an average rate of 0.25°C per decade [13]. This increase in average annual temperature is projected to increase from 23.08°C per year during 1961–1990 to 26.92°C from 2070−2099 [43]. These conclusions are further supported by current empirical research conducted in Ethiopia’s Central Rift Valley, which includes the study area’s lowland areas. For instance, Kassie et al. [44] predicted a mean annual temperature rise of 1.4–4.1°C in the middle of the Rift Valley. The observed significant increase in temperatures could be attributed to the global and regional warming of climate system. Monthly temperature increased throughout the year across all stations, with the highest significant increase of Taverage in October (0.069°C per year), Tmin in November (0.095°C per year), and Tmax in July (0.075°C per year). This implies that temperature increases during months of both dry and wettest seasons. Studies revealed that the mean minimum temperature has been increasing throughout the country, even in the cool months approximately by 0.4°C per every decade over the past 50 years [43, 45–47].
Analysis of extreme temperature indices revealed increasing trends in hot days (SU25); maximum temperature extremes (TXX) and minimum temperature extremes (TNx) in lowland and midland AEZs, which is in line with other empirical studies in Ethiopia [48–50]. Mekonnen et al. [48] provide evidence for the increasing trend of hot days in lowland areas and emphasize the significance of this trend in the context of climate change. The study of Alemayehu et al. [50] revealed an increasing trend of maximum extreme temperatures in the lowland and midland areas of Ethiopia. In general, the number of hot days and the highest extreme temperatures are trending upward. On the other hand, there are some differences in the minimum extreme temperature trends, with both rising and falling trends noted. Thus, in order to better understand the effects of climate change and develop appropriate adaptation strategies, the investigation’s findings emphasize the need for additional research and monitoring of the region’s climate patterns.
The rainfall in the study area has highest mean in the highland (Kofale) and lowest in lowland (Aje). In general, the Kiremt season contributes more (48.80%) to total annual rainfall than Belg season, which accounts for 38% across all stations. This is consistent with several studies that found Kiremt rainfall to be the biggest contributor to annual total rainfall in various regions of Ethiopia [8, 18, 32, 51]. Edao et al. [32] revealed that rainfall received during the main growing season (June to September) contributed 52.3% to 70.8% to the total annual rainfall in the semiarid rift valley of Ethiopia. Similar results, demonstrating the significance of Kiremt rainfall in the region’s precipitation patterns, were reported by Kassie [44] in the Central Rift Valley of Ethiopia, which includes the lowlands sections of the West Arsi Zone. Additionally, Dendir and Birhanu [8] also observed comparable findings in southern Ethiopia. Bewket and Conway [51] examined rainfall patterns in Amhara region and found that Kiremt rainfall accounted for a substantial proportion, ranging from 55% to 85%, of the annual rainfall totals. In Ethiopia, Kiremt season rainfall has the lion’s share of the total annual precipitation (rainfall) which enables the production of 85%–95% of Ethiopia’s food crop [32, 52]. All together, these studies provide objective evidence to support the hypothesis that the precipitation patterns in Ethiopia and the study area are significantly influenced by Kiremt and Belg rainfall. When assessing local climate dynamics and investigating potential effects on various sectors, it is crucial to consider both Kiremt and Belg rainfall, as demonstrated by the consistent results of various studies. Overall understanding the contributions of Kiremt and Belg rainfall is crucial for water resource management, agricultural planning, and climate change adaptation strategies in the study area and beyond.
The CV in Ethiopia varies from 10% to 70%, of which, areas with CV above 30% are vulnerable to drought [47, 53, 54]. Analysis of rainfall variability revealed that it exhibited high variability in the lowland (Aje), while relatively low variability was observed in the highland (Kofale). This finding is in agreement with different studies that rainfall exhibited high interseasonal variability in Rift Valley [18] and high interannual variability in southern Ethiopia [2, 32, 33]. In particular, Belg rainfall showed the highest variability among the seasons, with the highest CV in lowland and lowest CV in highland AEZs. This finding aligns with previous studies conducted in Ethiopia [8, 18, 48, 51], which also reported high variability in annual and seasonal rainfall patterns. Particularly in the lowland and midland regions, the high variability of Belg rainfall can have a substantial impact on the livelihoods of agricultural households. The area receiving enough Belg rains has shrunk by 16% over the previous 20 years, leaving heavily populated regions of south-central Ethiopia’s Rift Valley vulnerable to almost constant food insecurity [55]. The increased variability in Belg rainfall has led to a rise in the number of relief aid beneficiaries over the past decade, reflecting the challenges faced by farmers in these regions due to inconsistent rainfall amounts and a decline in RDs during the Belg season. In Ethiopia, over 90% of the food supply comes from rain-fed subsistent agriculture and high rainfall variability means loss of major livelihood [56, 57]. Thus, assessing rainfall variability and trends based on historical data aids in a better understanding of the difficulties posed by drought, floods, and the different uses of water [32, 58, 59].
Further examination of the seasonal PCI indicated a moderate distribution of rainfall, with the peak occurring during the Belg season and reduced levels during the kiremt season across all AEZs. This suggests that annual rainfall distribution can be classified as highly concentrated in lowland regions, while midland and highland areas demonstrate a concentrated pattern of annual precipitation. A high concentration of annual rainfall indicates an irregular monthly distribution [60]. Additionally, analysis of rainfall variability at monthly scales revealed the highest variability in rainfall in drier months of November through December, while the lowest variability was in the wettest months of March through September. January experiences significant variability in rainfall due to the transition between the Belg and Kiremt seasons [61]. High variability of rainfall in February is associated with the influence of the Belg season on rainfall patterns [20]. Overall, the findings highlight the importance of considering the variability and distribution patterns of annual and seasonal rainfall for effective agricultural planning and management in the study area. It is essential to develop adaptive strategies that account for the specific challenges posed by the high variability of Belg rainfall, particularly in lowland and midland regions.
The analysis of SPA revealed the occurrence of drought years with varying levels of severity in the study area. The increased frequency of meteorological droughts has had adverse effects on rain-fed agriculture and resulted in reduced crop production or complete failure of cereal crops particularly in the lowland AEZ. Drought severity included extreme drought (SPA <−1.65), severe drought (SPA between −1.28 and −1.65), and moderate drought (SPA between −1.28 and −0.84). The severe and extreme drought episodes were found to cover larger geographical areas, while moderate drought episodes tended to affect more localized areas [62, 63]. The impact of drought is determined by various factors including the magnitude, duration, frequency, and spatial extent of the rainfall deficit [62–64]. In the study area, major cereal crop productions such as maize and surface freshwater availability have been significantly affected by meteorological droughts particularly in the lowland areas (Figure 7). Maize is the most important cereal cultivated in Ethiopia as it ranks second after teff in area coverage and first in total national production and yield per hectare [65, 66]. This implies that climate change and variability have greatly impacted food security and led to an increased number of people requiring relief aids in the study area. Climate change poses a significant threat to Ethiopia because the country lacks the adaptive capacity and resilience of socioeconomic systems [67]. Overall, high variability in rainfall characterized by increasing dry spells and rise in temperature adversely impacts the environment (such as reduced availability of surface freshwater) and food security associated with crop failure and crop diseases (Figure 12), particularly in more vulnerable lowland and midland areas.

Moreover, the analysis conducted in this study revealed a significant decrease in monthly rainfall during the wettest months of March, June, and September in the midland and in July in the lowland. This finding is consistent with national-level studies that have indicated a declining trend in rainfall from February to April, during the short rainy season, with a consistent trend observed from 1981 to 2000 [43]. Furthermore, it is worth noting that the number of days with rainfall exceeding 10 mm (R10 mm) has decreased in the study area over the past four decades, which is in line with other studies conducted in Ethiopia [8, 22, 68]. Similarly, the number of days with rainfall exceeding 20 mm (R20 mm) has also shown a decreasing trend in the study area, with a significant decrease of 0.1 days per year observed in the midland. However, this finding contradicts with other studies that have reported significant increasing trends in R20 mm in the midland AEZ, particularly in southern Ethiopia [8, 22, 63]. For instance, this result contradicts with the findings of Esayas et al. [22] who revealed a positive trend in the number of very wet days, including R20 mm, in the midland and highland AEZs, where R20 mm increased by 0.325 days per year over the period 1983–2018 in the midland of Wolayita Zone.
Generally, the analysis of annual, seasonal, and monthly rainfall patterns has revealed notable declines in the midland region, whereas decreases observed in the lowland and highland areas were not statistically significant. The marginal reduction in rainfall in these regions may be due to substantial year-to-year variability influenced by local geography and hydrology, such as the presence of lakes in lowland areas. Conversely, the pronounced negative trends in midland rainfall could be attributed to widespread environmental degradation and urban development. Thus, it is crucial to recognize that Ethiopia’s climate systems exhibit diverse topographical features and relief patterns at the local scale, resulting in varying trends and extremes across different regions. This underscores the importance of localized analysis and comprehension of these climatic dynamics. By examining the distinct characteristics of each region climate, policymakers and stakeholders can devise targeted and effective strategies to mitigate adverse effects and bolster resilience in response to climate change [43].
5. Conclusion
In this study, it is concluded that the maximum and minimum temperatures significantly increased, whereas the annual and seasonal rainfall decreased significantly over the observation period. The warming climate was particularly pronounced in the lowland and midland areas, but the magnitude and significance of the decreasing rainfall trends varied among different AEZs. The number of hot days and maximum extreme temperatures also showed an increasing trend, while the number of days with rainfall above the threshold, total precipitation, and daily intensity exhibited a decreasing trend over time. The increased frequency of meteorological droughts has had adverse effects on rain-fed agriculture and resulted in reduced crop production or complete failure of cereal crops particularly in the lowland AEZ. The negative impacts of climate change and variability on rain-fed agricultural households are evident, leading to challenges in crop production, food security, and an increased reliance on relief aid during growing seasons in the lowland and midland parts of the study area. To effectively address these challenges, it is crucial to analyze rainfall and temperature data in different geographical settings. This study underscores the need for further research in the region to identify local factors contributing to climate variability and better understand its impacts on livelihood practices across various geographical settings. Continued research and monitoring of climate patterns will provide valuable insights into changing climate patterns and inform the development of evidence-based adaptation plans and strategies for sustainable development in the face of a changing climate.
Ethics Statement
The authors have nothing to report.
Consent
The authors have nothing to report.
Conflicts of Interest
The authors declare no conflicts of interest.
Funding
The research did not receive specific funding but was performed as part of PhD supported by the Ethiopian Ministry of Education, and the authors declare that there is no conflicts of interest in this regard.
Acknowledgments
The authors would like to thank the Ethiopian Meteorological Institute for providing the gridded daily temperature and rainfall data.
Open Research
Data Availability Statement
The climate data (from Ethiopian Meteorological Institute) used to support the findings of this study are available from the author upon request.


